I was texted these ECGs.
“Bad chest pressure with severe left shoulder pain 3 nights ago. Then SOB and nausea the next day. Now appears to be in cardiogenic shock.”
(Later review showed systolic BPs in the range of 55 to 83. So she was quite hypotensive.)
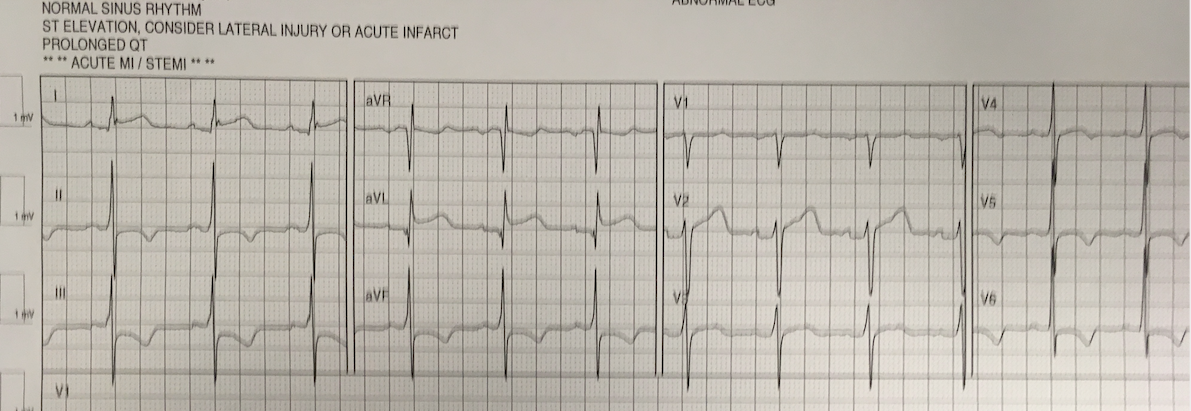
First recorded at time zero:
 |
| There is sinus rhythm. Rate of only 70 suggests some beta blockade.
The QT is very long. There is T-wave inversion in inferior leads, suggestive of reperfused or subacute MI. There is a Q-wave in III, so this may be subacute There is ST depression in V2-V4. |
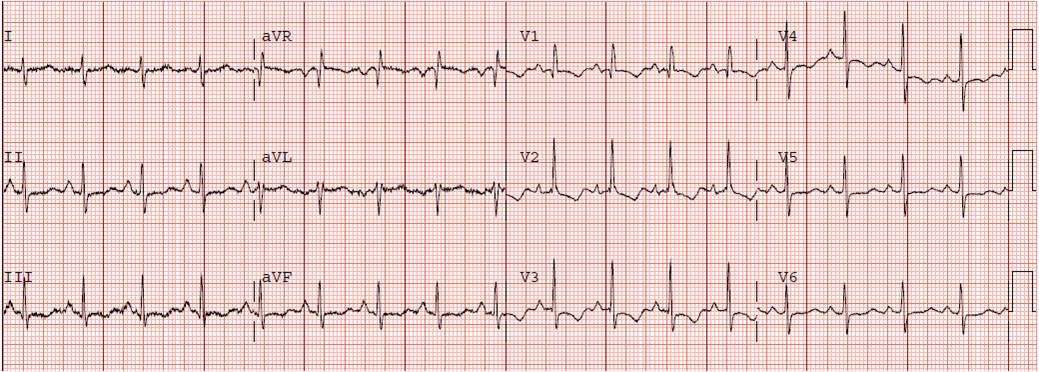
20 minutes:
 |
| Again, very long QT.
Now, T-waves are upright in inferior leads, inverted in aVL. The QRS is the same, so this is not lead placement. This is highly suggestive of re-occlusion (Pseudonormalization of T-waves). |
They did a POCUS cardiac echo:
Anterior wall is contracting and thickening.
Lateral Wall (lower right) is not contracting or thickening.
Posterior wall (at bottom of screen) also is not contracting or thickening.
Aside: Some insist on calling this posterior wall “lateral,” even though it is clear that it is anatomically posterior. This is because if you oriented the heart with the RV directly right and the LV directly left, then that wall would indeed be lateral. But the heart is oriented with the RV more anterior and LV more posterior, so that wall really is closest to the back (posterior). You also can see that this orientation of the heart also renders the anterior wall a bit lateral.
Whatever you call this wall, that it is posterior is important, because it means the ST Elevation vector of that wall will be directly opposite V2 and result in ST depression in V2, NOT ST elevation in lateral leads I, aVL, V5, or V6!!
This insistence on calling it lateral is due to a paper by Bayes de Luna — https://www.ahajournals.org/doi/full/10.1161/circulationaha.106.624924]
Case Continued
I could only see the ECGs, not the echo.
I learned that the patient is on Sotalol for control of PVCs. This explains the long QT. All electrolytes were normal.
Paraphrasing Smith response: “There are dynamic T-waves inferiorly and ST depression in V3. This is ischemia until proven otherwise. By the ECG, it is not necessarily subacute, but could be. However, cardiogenic shock usually takes some time to develop, so it is probably subacute.”
Then I was told that the troponin I returned at greater than 50,000 ng/L. This can only be due to STEMI.
I said “activate the cath lab.”
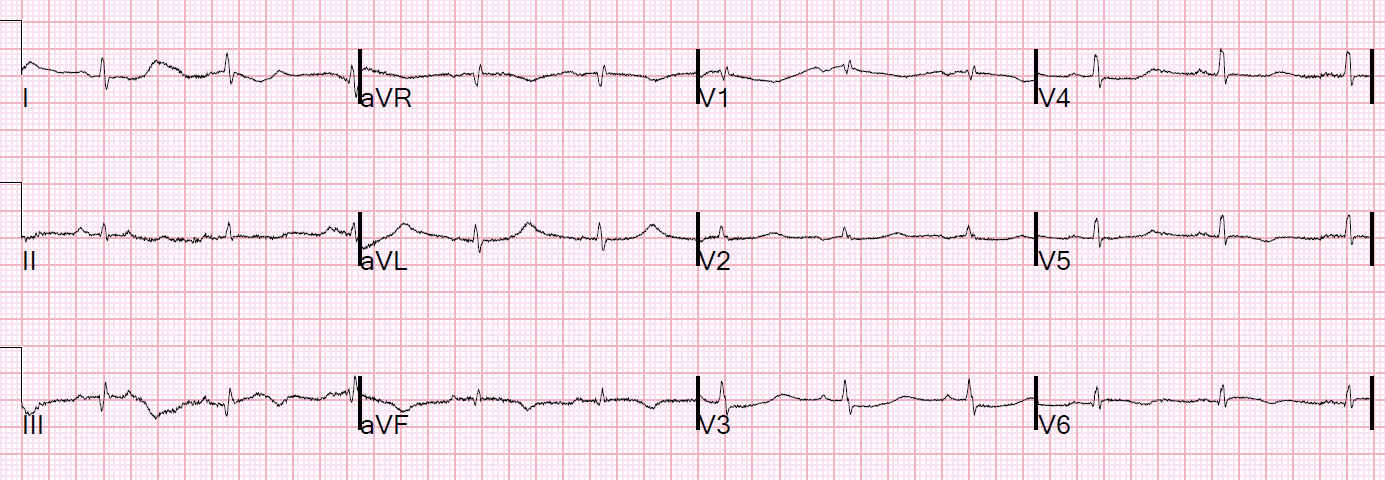
Another ECG was recorded at 70 minutes:
 |
| Inferior T-waves are again inverted, and upright in aVL |
Here is the angiogram:
 |
| What do you see? |
Here I annotate it:
 |
| This shows 100% occluded circumflex (red arrow) and a 90% stenosis of the LAD (Yellow arrow). The LAD was thought to be not thrombotic, but a chronic tight stenosis. |
Both were opened:
 |
| Beautiful open arteries |
Formal Echo
–Severely decreased left ventricular systolic function with an estimated EF of 20%.
–Regional wall motion abnormality–basal to mid anterolateral, basal to mid inferolateral, and apical lateral akinesis.
–Regional wall motion abnormality–mid to apical anterior hypokinesis.
–Elevated left-sided filling pressure based on Doppler parameters (grade 2 diastolic dysfunction.)
ECG from 2 days later:
 |
| Atrial Fibrillation now.
Inverted Reperfusion T-waves inferior |
Learning Points:
1. Circumflex occlusion may have minimal ECG findings.
2. When one artery is occluded, then the heart depends on others (in this case, the LAD) to perfuse contracting myocardium. A fixed stenosis in that other artery, especially in the context of hypotension from the occlusion of the first coronary artery, can lead to ischemia and very poor LV function and worsening shock.
3. Cardiogenic shock and ACS is an indication for the cath lab, even if you don’t think there is OMI.
4. ST depression in V2/V3 is posterior MI until proven otherwise.
5. A troponin I greater than 5000 ng/L is almost always due to OMI (there was some thought that this might be takotsubo, but takotsubo does not often have a troponin I greater than 5000 ng/L).
6. Sotalol prolongs the QT
7. There is new data showing better outcomes when bystander lesions (non-culprit) are stented.
![]()
===================================
MY Comment by KEN GRAUER, MD (8/28/2020):
===================================
Dr. Smith highlights a number of important lessons to be learned from today’s case. I limit my comments to some additional points of interest.
- For clarity — I have consolidated the first 3 ECGs in this case in Figure-1.
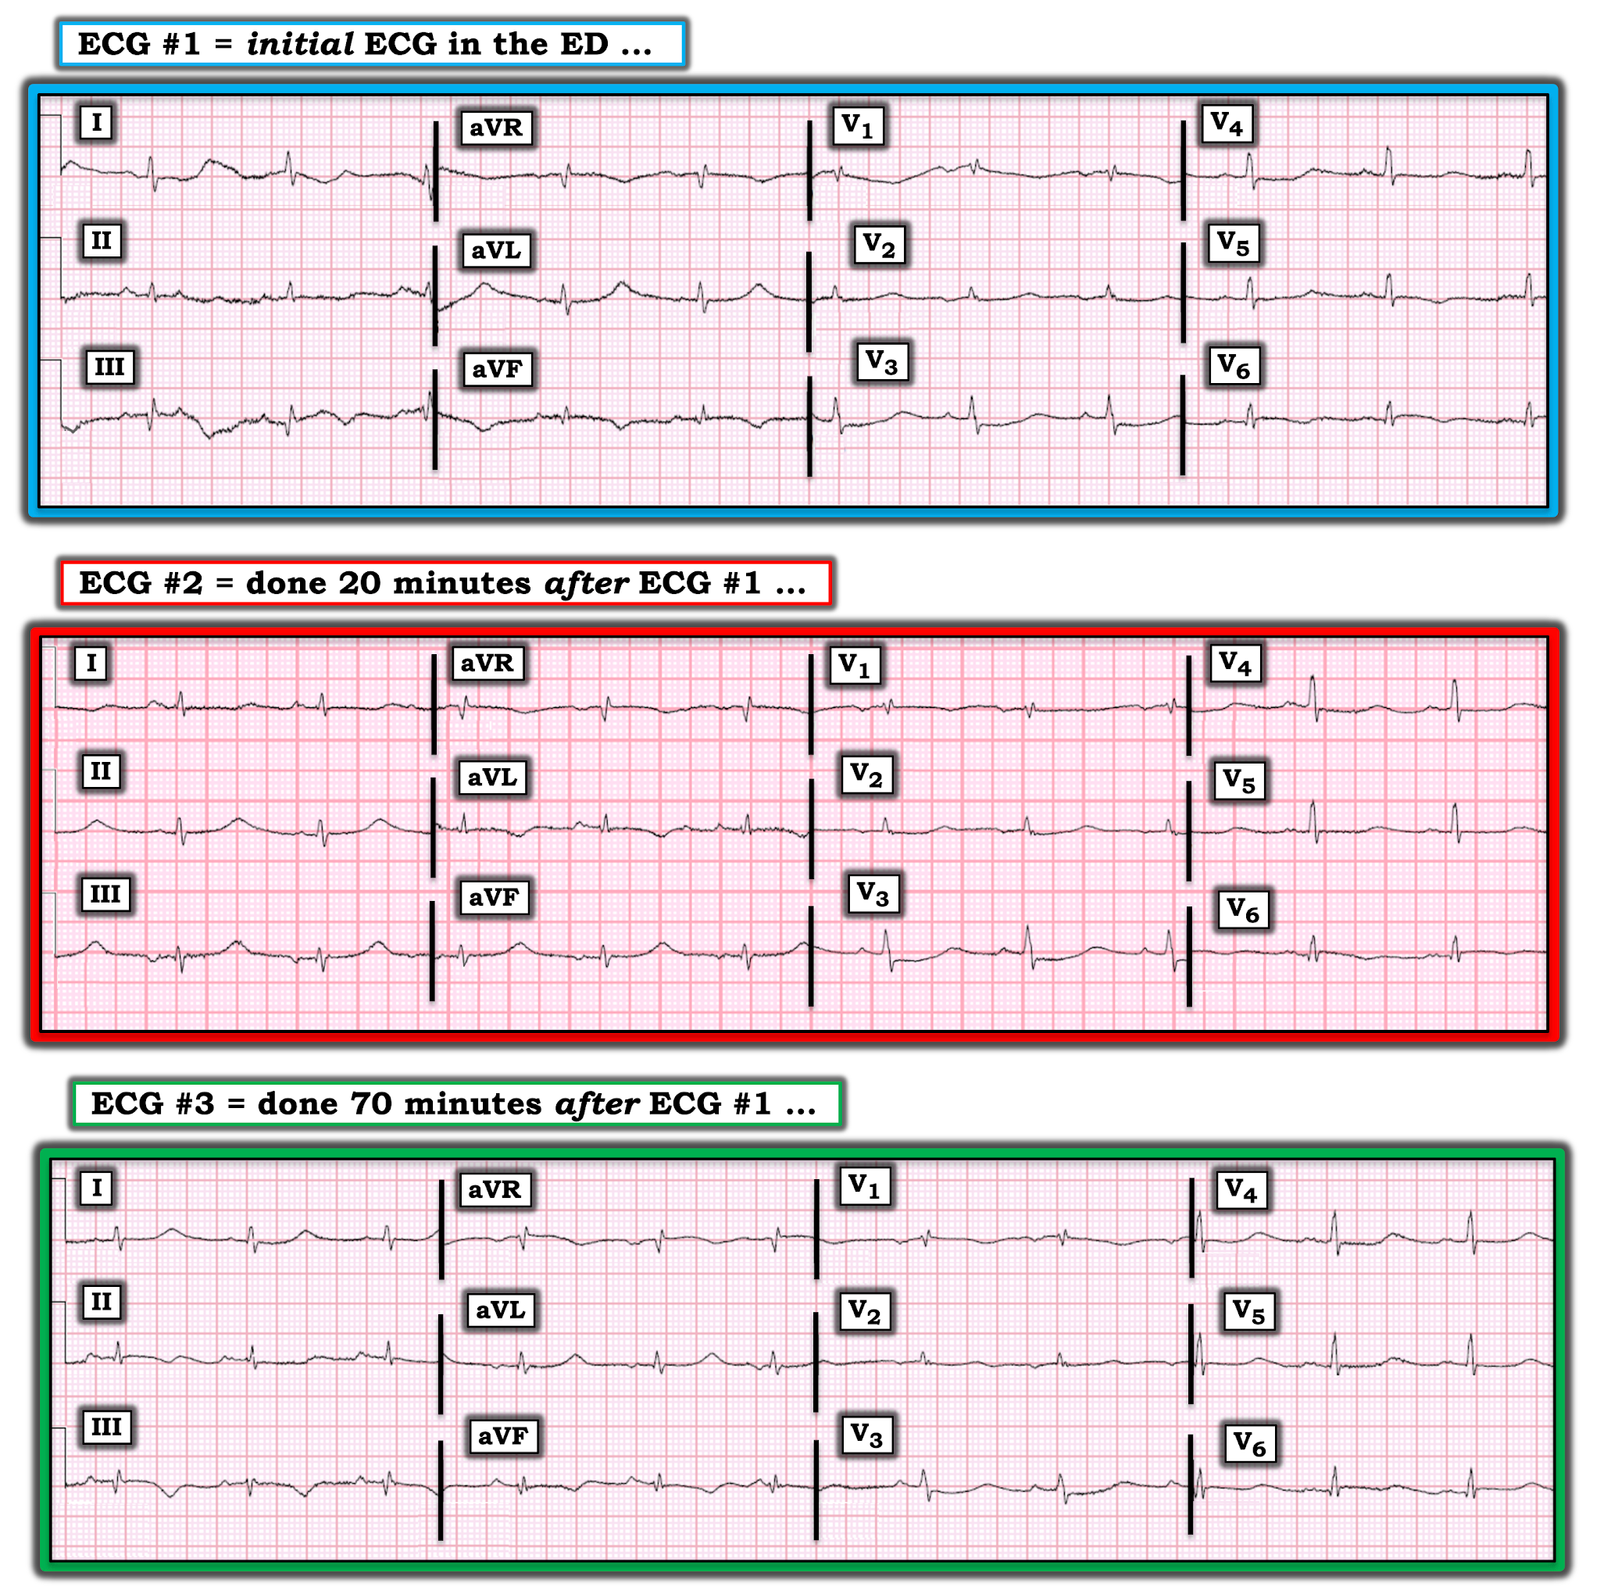 |
| Figure-1: The first 3 ECGs shown in today’s case (See text). |
My THOUGHTS on ECG #1: We are told that the patient in today’s case had an episode of severe chest pain 3 nights prior to admission. This was followed the next day by increasing dyspnea — and, by the time the patient was seen in the ED (when ECG #1 was obtained) — the patient was in cardiogenic shock.
- The rhythm in ECG #1 is sinus at ~65-70/minute.
- The PR interval is normal and the QRS complex is narrow. As per Dr. Smith — the QTc is extremely long. Selecting lead aVL as that lead in which we clearly see the limits of the QT interval — I measure a QT ~540 msec. Correcting for a heart rate of ~65-70/minute suggests the QTc ~550-560 msec, which is markedly prolonged.
- There is generalized low voltage. QRS amplitude does not exceed 5 mm in any of the 6 limb leads — and it is well under 10 mm in all 6 of the chest leads, despite normal standardization (See Figure-2 below).
- There is no chamber enlargement (although given how reduced QRS amplitude is in all 12 leads — assessment of ventricular enlargement is probably not possible on the basis of ECG criteria).
Given the clinical presentation of chest pain 3 days earlier, followed by development of cardiogenic shock — the KEY to interpretation lies with assessment of Q–R–S–T Changes:
- Baseline artifact makes it problematic to interpret ST-T wave changes in leads I, II and III. We only see 2 complete complexes in these leads — and the 1st of these 2 complexes is completely distorted by artifact. Based on the appearance of the 2 complexes that we do see in lead aVF — it does look like there is a relatively large Q wave in lead III (ie, nearly equal in size to the tiny R wave amplitude in this lead) — with a smaller Q wave in lead aVF. My impression was that despite no ST elevation in the inferior leads — the ST segment was coved (best seen in lead aVF) with T wave inversion — and, a mirror-image oppositive (reciprocal change) picture for the ST-T wave in lead aVL was seen in lead aVF. As per Dr. Smith — this strongly suggests recent inferior MI with reperfusion changes (consistent with the history of CP onset 3 days earlier).
- In the Chest Leads — as tiny as QRS complexes are, there is an rsR’ in lead V1, which together with narrow terminal s waves in lateral leads I and V6 qualifies as IRBBB (Incomplete Right Bundle Branch Block).
- There is early transition — since the tiny QRS complex in lead V2 is already all positive! This is relevant — because early transition (with relative early increase in anterior lead R wave amplitude) is a sign consistent with posterior MI.
- There is definite ST depression in lead V3. As Dr. Smith has commented on many occasions — maximal ST depression in leads V2,V3 indicates posterior MI until proven otherwise.
- Depending on which of the 2 complexes we look at in lead V4 of ECG #1 — there may also be some ST depression in this lead.
- Depending on which of the 2 complexes we look at in lead V5 — there may or may not be ST segment coving with T wave inversion …
- I thought there was ST segment coving with slight-but-real ST elevation in lead V6 (since both of the QRST complexes in lead V6 show this).
- Putting This Together — In view of the history, and taking into account additional difficulties imposed by artifact, low voltage, and the greatly prolonged QTc — I thought the appearance and distribution of changes seen in ECG #1 were most consistent with recent infero-postero-lateral MI, that was probably now showing reperfusion changes. This anatomic distribution of ECG changes is consistent with the cath finding of acute LCx (Left Circumflex) occlusion.
Regarding the LOW Voltage: The list of potential causes of generalized low voltage on ECG is long (Figure-2).
- One of the causes of low voltage that is easy to overlook is loss of myocardium (and of myocardial function). The dramatically reduced QRS amplitude in all 12 leads in today’s case provides yet one more clue to the presence of cardiogenic shock.
Regarding the Very Prolonged QTc: We are told that today’s patient was on Sotalol for control of PVCs. This apparently was a long-term antiarrhythmic medication for this patient — but we are not given further details.
- Initial priorities in this patient were clearly to determine the anatomy — and reestablish coronary perfusion. This was superbly accomplished, as evidenced in the 2nd cardiac cath picture showing “beautifully open” coronary arteries.
- Optimal management at this point in this patient’s course would entail finding out specifics regarding Sotalol antiarrhythmic therapy. This should include details regarding the dosing regimen — the nature of the ventricular arrhythmia being treated — and the patient’s “baseline” QTc at steady state for his/her current Sotalol dose.
- A QTc of ~550-560 msec (as was seen on ECG #1) increases risk for Sotalol-induced Torsades de Pointes. This should be addressed.
- Serum K+ and Mg++ values (as well as renal function) should be promptly checked — since low values of these electrolytes increases risk of Sotalol-induced Torsades.
- The indication and dosing of Sotalol for this patient should be reconsidered prior to giving the next dose.
My THOUGHTS on Serial ECG Changes: To facilitate lead-by-lead comparison of the serial ECG changes in today’s case — I put the first 3 tracings that were shown together in Figure-1. Note that QRS size and morphology remains virtually the same for all 12 leads in each of the 3 tracings in Figure-1 — which tells us that any ST-T wave changes we might see must be real!
- As per the astute clinical deductions by Dr. Smith — the principal change between ECG #1 and ECG #2 occurs in the limb leads. Specifically, the T wave inversion initially seen in lead aVF (and suggested in lead III) of ECG #1 — has been replaced by upright T waves. Given how tiny QRS amplitude is — the now upright T waves in leads II, III and aVF of ECG #2 look disproportionately tall (ie, hyperacute). As per Dr. Smith — these dynamic ST-T wave changes in the setting of cardiogenic shock suggest reocclusion.
- Comparison of these same limb leads with their ST-T wave appearance in ECG #3 — shows return to T wave inversion in leads III and aVF that we saw in ECG #1, with the T wave again becoming upright in lead aVL. Perhaps there has been spontaneous reopening (and reperfusion) of the infarct-related artery?
- In contrast to the above serial limb lead ST-T wave changes — there has been virtually no serial change in the chest leads between ECGs #1, #2 and #3.
- NOTE: Isn’t it much EASIER to appreciate serial ECG changes when serial tracings are placed right next to each other?
Final Thought: I found the 2nd Learning Point highlighted above by Dr. Smith of special interest — since it can be all-too-easy to overlook the disproportionate effect on hemodynamics that occlusion of a single coronary artery might have when there is significant narrowing in one or more of the other coronary arteries.
- I wonder how much the ST-T wave appearance in the 3 serial tracings of Figure-1 may have been influenced by some cancellation of forces? It would seem that this patient who presented in cardiogenic shock should have had ECG evidence of diffuse, subendocardial ischemia (ie, diffuse ST depression with ST elevation in lead aVR). Could some of the ST elevation from recent/acute LCx occlusion (in association with severe LAD narrowing) have been cancelled out by diffuse ST depression from diffuse subendocardial ischemia?
 |
| Figure-2: Causes of generalized low voltage on ECG (See text). |
![]()
ADDENDUM = Correction! (August 30, 2020):
Being an “expert” in ECG interpretation is sometimes very humbling. So I’d like to CREDIT gtob — who wrote us today. I’ve copied his comment below in Figure-3:
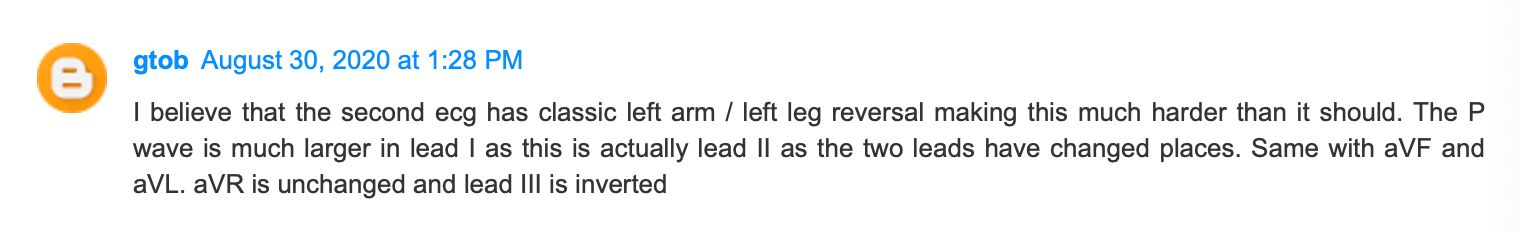 |
| Figure-3: Comment from gtob questioning LA-LL Lead Reversal (See text). |
Our THANKS to gtob — who I believe is completely correct in his comment to us! So, we all “live & learn”. Despite my love for detecting technical errors — I missed this one. Let’s all learn from this.
- In the July 28, 2020 post in Dr. Smith’s ECG Blog — I cited my favorite on-line “Quick GO-TO” reference for the most common types of lead misplacement, which comes from LITFL ( = Life-In-The-Fast-Lane). Simply put in, “LITFL Lead Reversal” into the Search bar — and the link comes up instantly!
- In Figure-4 — I have put ECG #2 on TOP, with addition of a box listing the effects that LA-LL Lead Reversal has on the ECG.
- In the MIDDLE of Figure-4 — I have inverted lead III — switched the position of leads I and II — switched position of leads aVL and aVF — and left aVR alone.
- In the BOTTOM of Figure-4 — I have again shown ECG #1 — so that we can compare how correcting for the effects of LA-LL Lead Reversal results in a 2nd ECG that looks virtually identical to ECG #1. Therefore — Although clinical management would really not have been changed in this case (because this patient still needed prompt cath and reperfusion) — in retrospect, there were no “dynamic” ST-T wave changes. Instead (as per gtob) — there was LA-LL reversal on ECG #2.
Additional Learning Points from this Case:
- Remember that we are all human and subject to missing certain findings. The KEY is to learn from our oversights — which is why I always like to go back and try to figure out why I may have missed a given ECG finding. That way, I won’t miss it again! This case presented a very difficult series of tracings to interpret because of very small QRS and P wave amplitude — LOTS of artifact on initial ECG #1 — minimal ST-T wave deviations — and a very long QTc.
- As per gtob — the “tipoff” to LA-LL reversal in ECG #2, is that the P wave in lead I is clearly larger than the P wave in lead II (and that is unusual when there is sinus rhythm).
- There is another subtle-but-real “tipoff” that I did notice, but I did not follow up on. In ECG #2 — we see a qRS complex. This is very different than QRS morphology was in lead III for ECG #1. And as we take another look at Figure-4 — it should now be obvious that morphology for the tiny QRS and ST-T wave complex in ECG #2 is virtually the mirror-image of what we saw in ECG #1. Next time I see this — I need to pay more careful attention to the relative size of P waves in leads I compared to lead II.
- Live & Learn!
 |
| Figure-4: Showing the effects of LA-LL Lead Reversal — then taking another look at ECG #1! (See text — and See LITFL Lead Reversal). |