Written by Pendell Meyers
I received two texts recently, in both cases the practitioners were worried about possible inferior hyperacute T-waves with an inverted T-wave in aVL. I was not given any clinical history.
What would you tell the team in these two cases?
 |
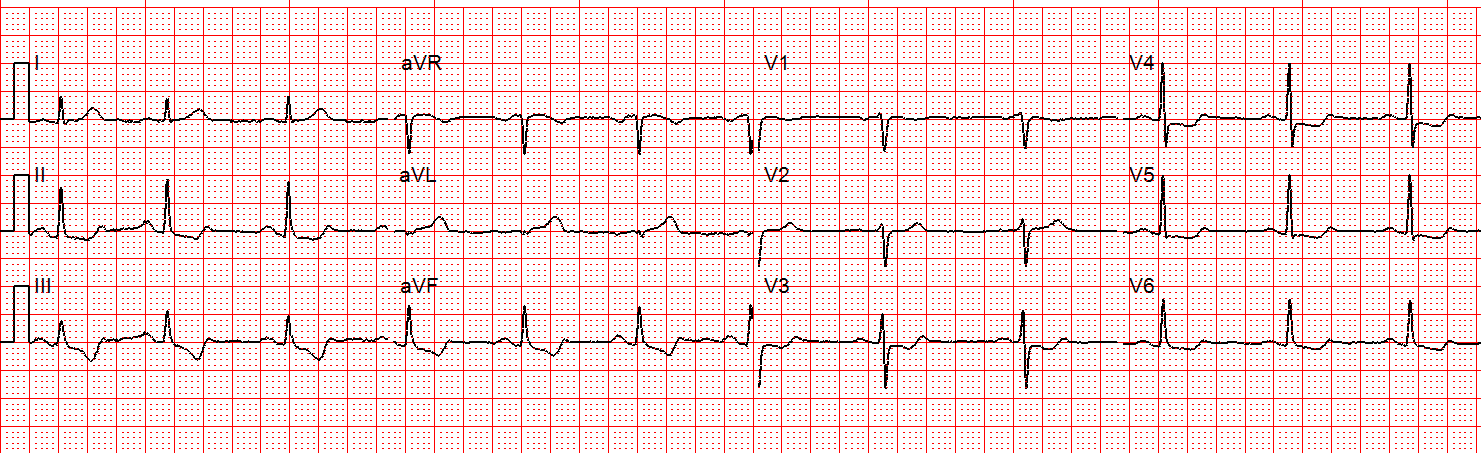
| Case 1 |
 |
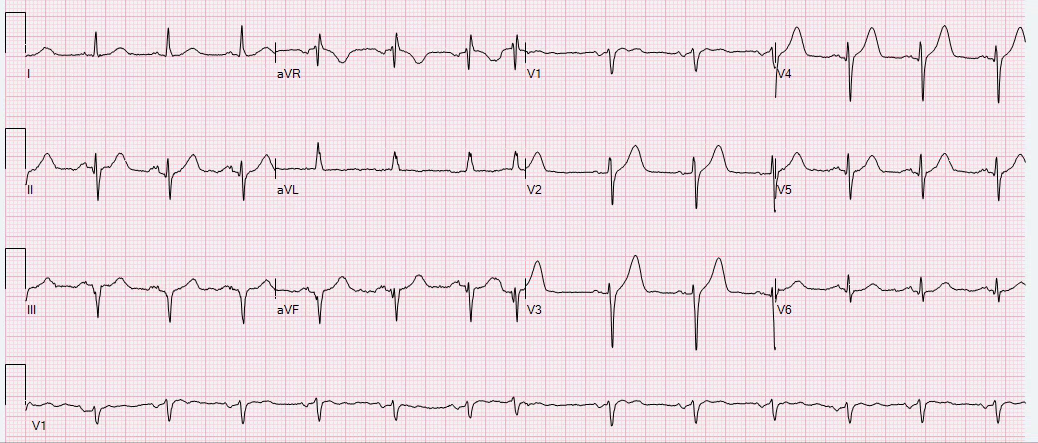
| Case 2 |
My responses:
Case 1: “Not hyperacute. The T-wave in aVL is likely that way at baseline, send baseline if available. What’s the story?”
Case 2: “Agree with concern for inferior posterior. This is almost completely diagnostic barring an identical baseline. What’s the story?”
Did you agree with my assessments? Why do I say that Case 1 is not hyperacute and Case 2 is? Was I even correct?
Case 1:
The T-waves are tall in absolute millimeter terms, but they are not “fat” enough (the area under the ST-T is not enough compared to the QRS complex). The QRS complex is narrow and negative in aVL, which means it is possible or even likely than the baseline T-wave is also negative in that lead. So when I see the negative T-wave in this case it does not necessarily alarm me because it is not fat, and it may simply be the baseline T-wave in this lead for this patient. A repeat would be helpful to confirm this suspicion, however it was not available.
After I gave my opinion, the team told me that the patient was a middle aged male in the ED for seizure activity with a history of seizure disorder and had not been taking his medications. He had no chest pain or shortness of breath. Troponin was negative. He did not have ACS.
Case 2:
Atrial fibrillation with slow response. This patient also has a narrow, normal QRS complex. In this case, the axis is such that the QRS is positive in aVL. Leads III and aVF have a suspiciously straight ST segment morphology, with a large amount of area under the ST-T segments compared to the small, normal QRS complexes. Because the QRS is normal and upright in aVL, the negative large volume T-wave in that lead is highly diagnostic for reciprocal change. This is supported by STD in lead I which is not appropriate for its normal QRS complex. There is also STE in leads III and aVF, though whether it formally reaches 1mm in both leads is questionable and cannot be agreed upon by a majority of people to whom I have shown this ECG. I also had suspicion for posterior involvement because of the morphology in lead V2 which has an “awkwardly” straight, isoelectric ST segment from the J-point to the abrupt start of the T-wave, which to me is suggestive of relative ST depression and straightening although there is no absolute STD.
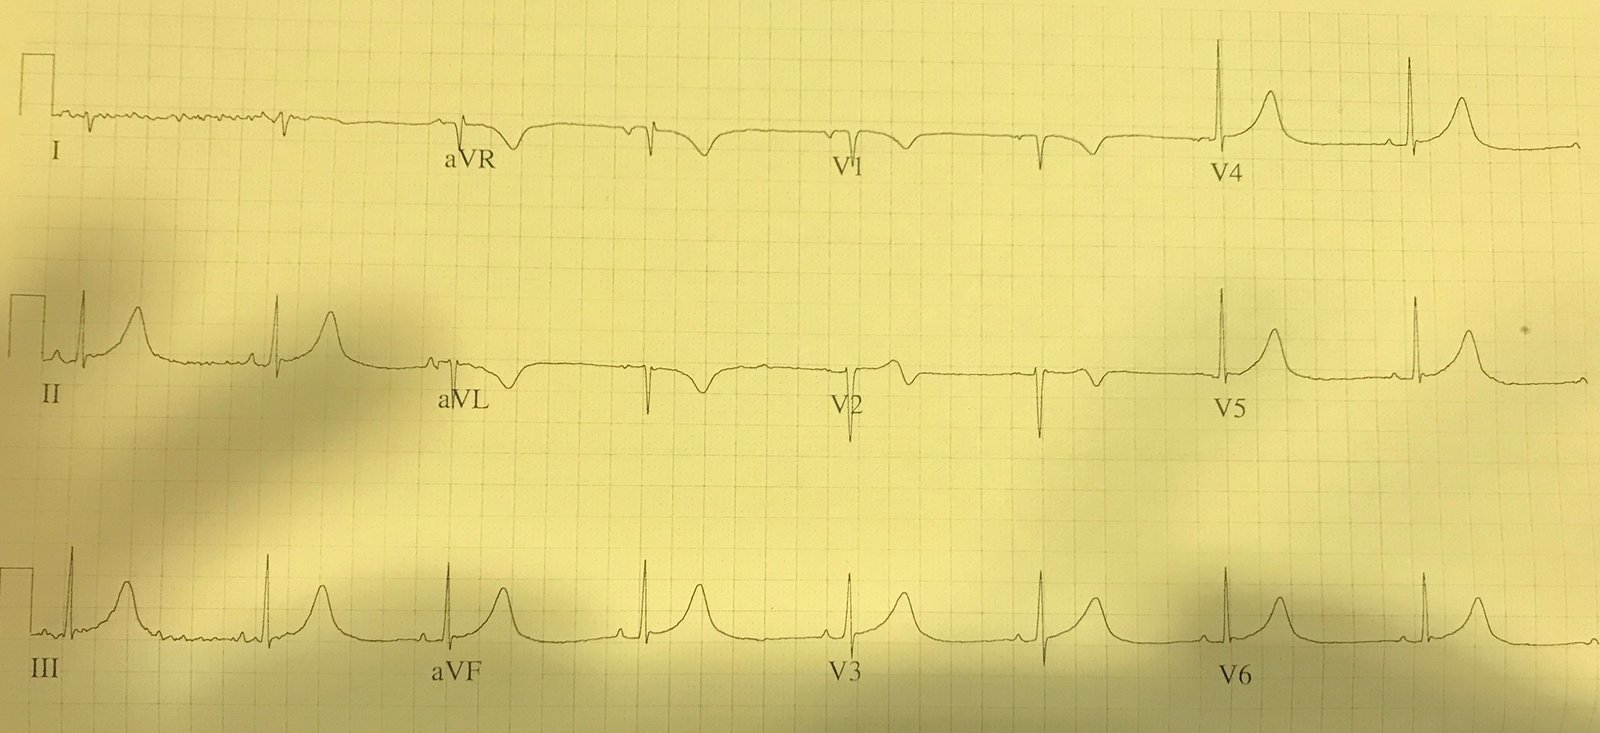
Comparison with a baseline would be your next step for Case 2, and here it is:
 |
| Baseline on file, showing normal relationship between the area under the ST-T curve compared to the QRS. This is proof that the findings on presentation ECG are new and diagnostic in comparison. Notice that the T-wave is negative in aVL at baseline, but the ratio of area under the T-wave is greatly increased and exaggerated between the two ECGs. |
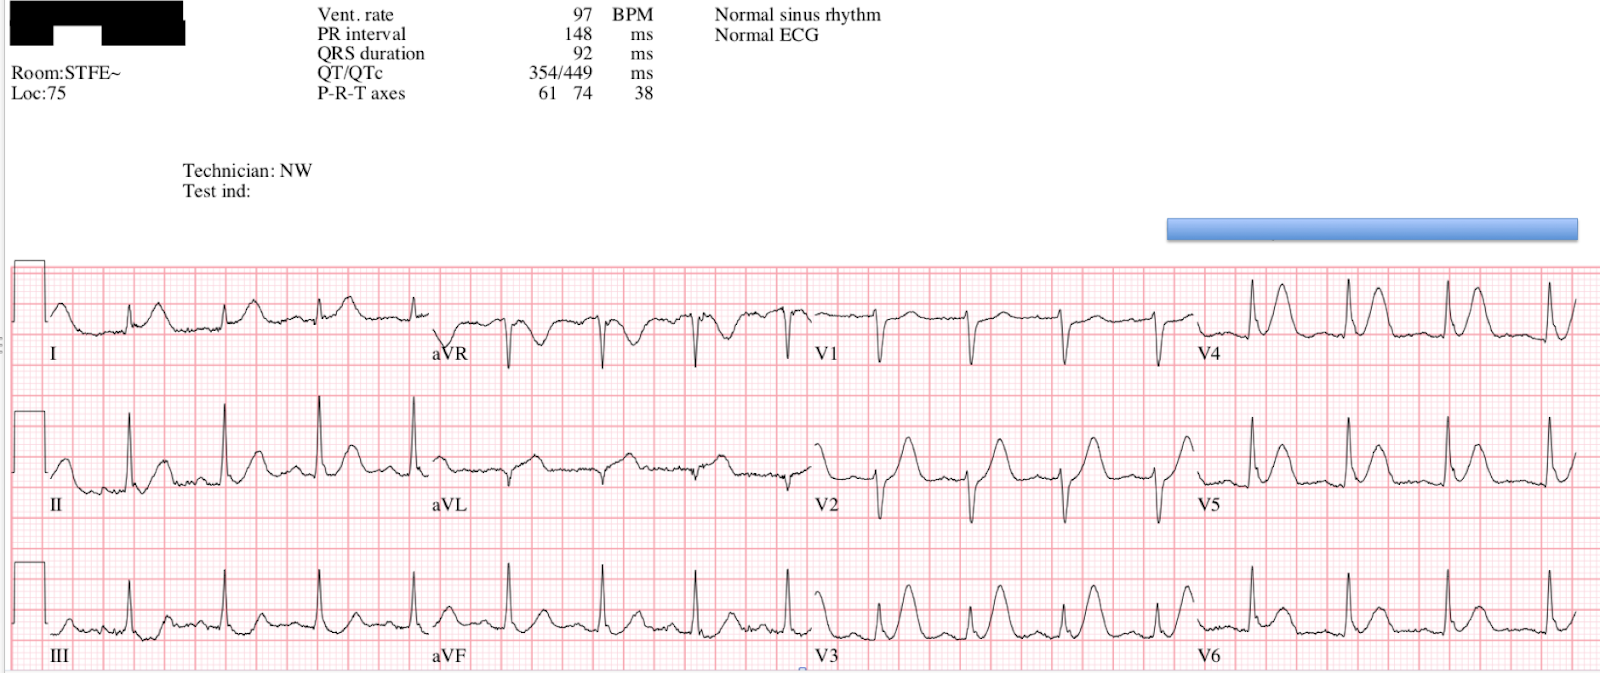
A repeat ECG was performed shortly thereafter:
 |
| Similar findings, possibly slightly more obvious hyperacute T-waves in the inferior leads. |
These hyperacute T-waves were diagnosed immediately by the ED team, and cardiology was called for emergent cath. However, this may not meet formal STEMI criteria because there may not be a full millimeter of STE in lead aVF depending on the exact baseline. It is very close if not diagnostic. The cardiologists believed that it did not meet our ACC/AHA criteria, and so emergent cath was cancelled.
First troponin T was undetectable. Second trop was 0.01 ng/mL. Third was 0.02 ng/mL. The fourth troponin shot up to 0.61ng/mL, then no further trops were measured.
He went for delayed cath ~28 hrs later, where they found 100% mid-distal LCX occlusion (TIMI 0). PCI was performed with good angiographic result.


Here is his post-intervention ECG:
 |
| Post-intervention, showing terminal T-wave inversions in the inferior leads indicative of reperfusion. |
Because troponin measurements were stopped around 9 hours after presentation, we do not know the peak troponin level. There was an inferoposterior WMA on echocardiogram, with 45% EF at that time (no old echo available).
Learning Points:
Hyperacute T-waves are recognizable with experience, and appear to the experienced electrocardiographer as fat, symmetric, large-volume T-waves judged against the size and morphology of the preceding QRS complex.
A patient with Occlusion MI should theoretically receive greater mortality benefit from reperfusion at the hyperacute T-wave stage of OMI than the ST elevation stage. Because our current paradigm does not provide recommendations or education regarding hyperacute T-waves, you must learn this on your own initiative if you are interested in providing this benefit for your patients.
As you begin to orient yourself to normal vs. hyperacute T-waves in actual practice, you must understandably go through a calibration period where you see many normal variants which appear alarming to you before you have enough experience to tell them apart from true positive hyperacute T-waves. Like any other process in medicine that cannot simply be achieved by reading a table written by the ACC/AHA, this takes time and effort. You and the learners you teach will predictably go through a period of decreased specificity (many false positives) before achieving expertise, and this temporary period should not dissuade you from further study!
![]()
———————————————————–
Comment by KEN GRAUER, MD (11/12/2018):
———————————————————–
I LOVE this post by Dr. Pendell Meyers regarding comparison between 2 ECGs texted to him out of concern for potential hyperacute inferior T waves with reciprocal change in lead aVL. I made my impressions about these 2 tracings before knowing the history for each patient — and before reading Dr. Meyers interpretation. Although I independently reached the same conclusions as Dr. Meyers — my path to this conclusion offers a different perspective.
- For ease of comparison — I’ve reproduced both initial tracings in Figure-1.
==========================
Case #1:
- I was initially very concerned in Case #1 about the appearance of the T waves in the inferior leads. Despite the fact that the T wave peak is not overly “fat” — T wave amplitude in each of the inferior leads is clearly taller-than-it-should-be given the height of the QRS in these leads. In support of possible acute change, the deep T wave inversion in lead aVL is indeed a “mirror image” of the taller-than-expected inferior T waves. Adding to my initial concern was the biphasic T wave in lead V2 …
That said — the reason I suspected the picture we see in Case #1 was probably not acute was a combination of the following factors:
- The ST-T waves in leads V3, V4, V5, and V6 look virtually identical to the ST-T waves in leads II, III and aVF. This makes no less than 7 out of 12 leads with a near-identical picture — and, that is highly uncharacteristic of acute MI. That’s because acute MI usually localizes to one or two lead group areas. In contrast — repolarization variants and ECG abnormalities due to metabolic factors are far more likely to be generalized.
- There really isn’t ST elevation in the ECG for Case #1.
- The fairly deep, symmetric T wave inversion in lead aVL is not necessarily abnormal. The T wave axis often follows fairly close behind the QRS axis — so T wave inversion per se in lead aVL may normally be seen when the QRS complex is predominantly negative (as it is in Case #1). And, if it turns out that the multiple prominent T waves in Case #1 are not due to acute ischemia — then the depth of the T wave inversion in lead aVL is not out of proportion to what might be expected for a repolarization variant given an all negative QRS in lead aVL.
- The fairly deep, T wave inversion in lead V1 is also not necessarily abnormal — especially given how tall T waves are in 7/12 leads.
- Despite its worrisome appearance — the biphasic T wave in lead V2 may simply be a “transition T wave” between the deep T inversion in V1 and the surprisingly tall T wave in lead V3.
- NOTE — Although duration of the QT interval looks long (ie, I measure the QT to be at least 480msec) — significant bradycardia with a heart rate below 50/minute makes it difficult to know what (if anything) this longish QT interval might mean.
- BOTTOM LINE for Case #1 — I was not certain that the initial ECG in Case #1 was not acute — BUT — the generalized nature of nearly identical-looking T waves in 7 out of 12 leads, along with a clearly potentially benign rationale for the findings in leads aVL, V1 and V2 — made me suspect that the findings in ECG #1 were probably not acute. As per Dr. Meyers — I wanted to know the history. As soon as I learned that this patient had a history of seizures, and did not have any acute chest pain — I became much more confident that this was not an acute tracing.
 |
| Figure-1: Comparison between the initial ECGs recorded for Case #1 and Case #2 (See text). |
==========================
Case #2:
- The rhythm for the initial ECG in Case #2 is slow AFib. There is some baseline artifact that distorts ST-T waves, and accounts for slight difference in the shape of some of these ST-T waves for successive beats in the same lead. That said — IF this ECG was obtained from a patient with new acute symptoms — it is virtually diagnostic of acute OMI ( = Occlusion-based Myocardial Infarction).
- Dr. Meyers has astutely highlighted the problem with the current paradigm for assessing acute tracings. Whether or not 1 mm of ST elevation is attained in ≥2 neighboring leads should be irrelevant to deciding what constitutes optimal care for the patient in Case #2. There simply is NO WAY that the ST segment straightening + slight-but-real J-point ST elevation + T wave “fattening” at its peak in leads III and aVF is normal.
- In the context of these changes in leads III and aVF — the fatter-than-expected T wave peak in lead II is also consistent with acute change.
- As per Dr. Meyers — leads aVL, V2 and V3 should serve to confirm a diagnosis of OMI if this patient was having new chest pain until one can prove otherwise on acute cath. Given the modest height of the R wave in lead aVL — a textbook picture of mirror-image reciprocal change is seen for the ST-T wave in aVL (including slight-but-real J-point depression that is the mirror-image opposite of the slight J-point ST elevation in leads III and aVF). The shape of the T waves in leads V2 and V3, coming after relative straightening of the preceding ST segment sticks out like a “sore thumb” — and strongly suggests acute posterior wall changes (as are usually seen in association with acute inferior OMI).
==========================
FINAL THOUGHT — Take a last look at the 2 tracings in Figure-1. Isn’t it striking in Case #1 how similar the ST-T waves are in 7 out of the 12 leads?
- When upright T waves are more-prominent-than-expected in multiple leads without localization as a result of a non-ischemic cause — you’ll often see prominent non-ischemic deep T wave inversion in several of the remaining leads (as we do here) — and, sometimes you’ll even see a non-ischemic “transition” biphasic T wave (as we do here in lead V2 of Case #1).
- In contrast — Note localization of hyperacute ST-T waves to the inferior leads in Case #2 — with localization of reciprocal changes as expected with inferior OMI to leads I and aVL — with ST-T wave abnormalies suggestive of associated posterior OMI localized (as expected) to leads V2,V3. That’s WHY I suspected the ECG for Case #1 was probably not acute — but that the ECG for Case #2 was virtually diagnostic of acute OMI despite the initial cardiology decision to cancel immediate cath.
![]()