Written by Magnus Nossen
The patient in today’s case is a 90-something male with a medical history of prostate cancer and chronic AFib, on oral anticoagulants. The patient contacted EMS due to sudden onset chest pain. Below is the prehostpial ECG recorded by EMS.

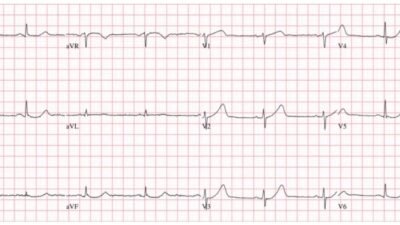
This ECG was recorded with a paper speed of 25 mm/s. The layout is in the Cabrera Format (See Dr. Grauer Comment in the October 26, 2020 post of Dr. Smith’s ECG Blog for review on the Cabrera Format). Below the ECG has been digitized using the PMcardio App.
— What do you think of this prehospital ECG? —

= = =
The on-call cardiologist described this ECG as “unusual and challenging to interpret.” Due to the presence of typical symptoms, the patient was deemed appropriate for urgent coronary angiography. Although the ECG appears unusual, it remains important to carefully analyze it to try to understand the underlying pathology.
Interpretation
The rhythm is irregularly irregular, with an overall heart rate of 82 bpm. The rhythm is atrial fibrillation. The QRS complexes are wide, showing a right bundle branch block (RBBB) pattern accompanied by left axis deviation consistent with left anterior fascicular block (LAFB). Hyperacute T waves are seen in the lateral leads I and aVL. Leads V4, V5, and V6 also demonstrate hyperacute T waves, but these are preceded by ST-segment depression characteristic of De Winter morphology. The inferior leads II, III, and aVF display reciprocal changes with mild ST depression and T-wave inversion.
This ECG is diagnostic of an occlusion of the left anterior descending artery (LAD), indicated by hyperacute T waves and De Winter pattern in the anterolateral leads. The RBBB and LAFB makes these finding more difficult to identify.
If this ECG does not convince you, have a look below where the precordial leads from the prehospital ECG have been compared with an ECG from 12 years prior. Notice the dramatic ST-T wave changes.

Old ECG on file with RBBB and LAFB

The Queen of Hearts was not used for ECG interpretation in this case. But it would have identified the OMI if it had been implemented. See the image below for the Queen of Heart’s interpretation and explainability when I provide QoH with the initial prehospital ECG.
Queen of Hearts interpretation and explainability

Rhythm and conduction interpretation by the QoH

Outcome:
The patient was urgently taken to the catheterization lab, where a subtotal stenosis of the proximal left anterior descending artery (pLAD) was identified and stented. On admission, the Troponin T level was 353 ng/L and subsequently increased to 4409 ng/L (a very high troponin T consistent with large MI, equivalent to a peak troponin I of 20,000-40,000 ng/L or higher). Echocardiography revealed an apical wall motion abnormality consistent with the findings observed on the ECG and during the catheterization procedure.
The above echo-loop from the apical 4 chamber view shows distal septal and apical wall motion abnormalitity, as expected from the ECG and angiography findings.
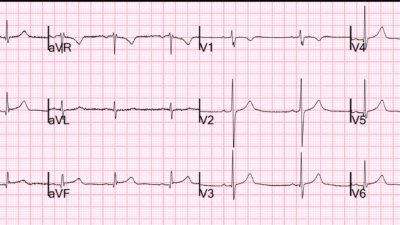
ECG recorded the day after the PCI procedure

Following the PCI procedure and restoration of flow in the LAD, the ECG demonstrates classic signs of reperfusion. T-wave inversion in the early precordial leads V1 and V2 is typically seen in right bundle branch block (RBBB) as part of secondary repolarization changes. However, in this ECG, the T-wave inversion extends across all the precordial leads. Additionally, the R wave amplitudes in leads V4 and V5 are markedly reduced compared to the prehospital ECG, indicating significant myocardial loss.
There is persistent right bundle branch block (RBBB) and left anterior fascicular block (LAFB), which, if caused by the acute infarction, would be associated with a poor prognosis. However, since this bifascicular block was present on an ECG recorded 12 years earlier, it does not carry the same prognostic significance. The patient did well short term.
Learning Points:
- RBBB and LAFB may complicate ECG interpretation of acute ischemia. If in doubt always compare with old ECG if available.
- The Queen of Hearts is trained to detect ischemic changes in the setting of conduction system abnormalities and can be helpful in aiding clinicians in identifying ischemia in the setting of a wide QRS.
= = =
======================================
MY Comment, by KEN GRAUER, MD (10/1/2025):
As per Dr. Nossen — today’s initial ECG is characteristic of deWinter T Waves, which given the history of new CP (Chest Pain) in this 90-something man with known AFib — is diagnostic of acute LAD OMI. I found this tracing remarkable for the following reasons:
- It provides an excellent example of deWinter T Waves — with some modification of this pattern because of preexisting bundle branch block and preexisting ST-T wave changes.
- The smooth transition from one limb lead to-the-next of the Cabrera format is highlighted.
- The fluctuating Low Voltage in the limb leads seems to reflect a corresponding fluctuation of LV function.
= = =
Comparison of Today’s Initial ECG with the 2013 Tracing:
For ease of comparison in Figure-1 — I’ve placed today’s initial ECG together with a previous ECG from 2013. Note the following:
- We’ve featured many varieties of deWinter T Waves in recent years in Dr. Smith’s ECG Blog (For review of this syndrome, including description from the original 2008 deWinter manuscript — See My Comment in the January 31, 2025 post).
- As per Dr. Nossen — leads V4,V5,V6 in ECG #1 manifest the characteristic J-point depression, from which arises an abrupt takeoff of the ST segment that culmintes in tall, hypervoluminous T waves in these 3 leads.
- Surprisingly — there are no such hyperacute T waves in the anterior leads of ECG #1. The prior (2013) ECG suggests why this is so — as the GREEN arrows in ECG #2 highlight preexisting J-point depression in leads V2,V3 (and perhaps ever-so-slightly also in lead V1).
- Compared to the 2013 tracing — I interpreted the ST segment in lead V1 of ECG #1 as coved, and now slightly elevated. I interpreted the unusually-shaped biphasic T waves in leads V2,V3 in ECG #1 as the net result of the deWinter T wave pattern — ST-T wave depression from the preexisting RBBB — and the extensive evolving anteroseptal infarction in process of “trying” to elevate anterior lead ST segments.
- Although not mentioned in the brief history we are provided — the deep and wide Q wave in lead V1 of ECG #2 suggests this patient had previous anteroseptal infarction back in 2013. There now appears to be extension of these anterior Q waves in today’s initial tracing (within the dotted RED circles in ECG #1).
- As per Dr. Nossen — lead aVL and lead I in ECG #1 both manifest hyperacute T waves (“fatter”-at-their-peak and wider-at-their-base than they should be) — with reciprocal ST depression in each of the inferior leads (BLUE arrows in leads II,III,aVF). These limb lead findings are typical of acute proximal LAD occlusion.
- As I discuss in My Comment at the bottom of the page in the October 26, 2020 post — the “beauty” of the Cabrera format is its much more logical display of limb lead sequencing, in which there are equally spaced 30 degree intervals between each of the 6 limb leads (with substitution of lead -aVR for lead +aVR allowing this to happen). This is easy to appreciate in ECG #1, in which leads -aVR and II serve as “transition leads” between the hyperacute T waves of leads aVL and I — and the marked reciprocal ST depression of leads aVF and III.
- Finally — Note the low voltage that was already present in the limb leads of the 2013 tracing. QRS amplitude in the limb leads was slightly greater in today’s initial ECG — but note how tiny QRS amplitude has become in today’s final tracing recorded after the PCI procedure (this final ECG shown above in Dr. Nossen’s discussion). This extreme low voltage that is now evident in today’s post-PCI ECG is relevant, as it almost certainly reflects depressed LV function (“myocardial stunning”) from this patient’s extensive antero-lateral infarction (See the review on Causes of Low Voltage that can be readily accessed from the Menu on top of each page in this Blog).
= = =
Figure-1: Comparison between today’s initial ECG and the 2013 ECG.