I was texted this ECG by a reader without any info:

What do you think?
The reader’s interpretation was this: “Patient supposedly has an old bundle, but doesn’t know what type. I thought the right bundle looked a little shark fin like.”
Is this “Shark Fin“?
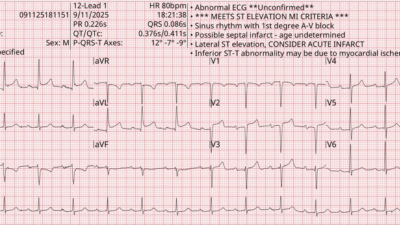
No, this is not shark fin. This is RBBB and LAFB, and the QRS duration is so long (about 195 ms) that it almost looks like a shark fin. But shark fin is due to the R-wave merging into the ST segment (see example below and many examples here). One might think of hyperK when the RBBB QRS is so wide, but as far as I know there was no hyperK in this case.
This is just a very wide RBBB (most RBBB is less than 170 ms and most LBBB less than 190 ms)
The ECG is diagnostic of LAD Occlusion, even without shark fin. See the slight STE in V2, where there should be discordant STD, STE in V3-6, and hyperacute T-wave in lead V5. And LAD OMI in the setting of RBBB/LAFB is terrible.
There is absence of the initial r-wave in the rSR’ (“rabbit ears”) typical of RBBB. Instead, there is a small q-wave. This tells us that the infarct is likely subacute, and is consistent with many hours of chest pain. One also sees this when there is RBBB with LV aneurysm. (But V4-6 rule out aneurysm, and rule in subacute OMI)
I immediately answered that it is LAD OMI but not shark fin.
He then told me that it was a middle-aged man with intermittent chest pain for days, then constant for many hours.
The PMCardio Queen of Hearts AI Model sees it all:


This was diagnosed with High Confidence.
New PMcardio for Individuals App 3.0 now includes the latest Queen of Hearts model and AI explainability (blue heatmaps)! Download now for iOS or Android. https://www.powerfulmedical.com/pmcardio-individuals/
The patient went for immediate angiography and there was a proximal LAD Occlusion (at the ostium — very dangerous)
Here is an LAD shark fin, from this post:

Here is one example of a (inferior posterior) shark fin, from this post:

= = =
======================================
MY Comment, by KEN GRAUER, MD (9/15/2025):
Today’s case illustrates how difficult it may sometimes be to assess a single ECG for acute ischemic change in the presence of an underlying conduction defect. This is especially true when: i) The QRS complex is very wide; — ii) There is evidence of prior infarction; — and, iii) No baseline tracing is available for comparison.
- For clarity in Figure-1 — I’ve labeled today initial ECG with those findings I found most suggestive of the diagnosis.
= = =
Why ECG #1 shows Acute Changes:
The ECG in Figure-1 — shows sinus rhythm at ~60/minute, with a normal PR interval and obvious QRS widening:
- As shown by the onset and offset borders of the QRS complex in simultaneously-recorded leads I,II,III — I measure the QRS = 0.16 second. This degree of QRS widening in the absence of some acute toxicity — is almost always accompanied by significant underlying heart disease.
- Predominant positivity of the QRS in right-sided lead V1 (qR pattern) — in association with wide terminal S waves in left-sided leads I,aVL — is most consistent with RBBB (Right Bundle Branch Block).
- Predominant negativity (rS pattern) in each of the inferior leads — in association with a qR pattern in lateral leads I,aVL — is consistent with LAHB (Left Anterior HemiBlock) — which makes this a bifascicular block (RBBB/LAHB).
There are abnormal Q waves:
- There should not be a wide initial Q wave in leads aVL,V1,V2 with an uncomplicated bifascicular block. And although tiny — the Q in lead I looks wider-than-it-should-be (the 4 Q waves within the dotted BLUE ovals in Figure-1). Especially in association with the wide QRS showing RBBB/LAHB — this strongly suggests antero-lateral infarction from LAD occlusion at some point in time.
KEY Point: Without availability of a prior tracing — We would not be able to tell if any of the above findings are acute. However — leads V3-thru-V6 are acute!
- My “eye” was immediately drawn to the 2 leads within the RED rectangle Both lead V4 and V5 show ST segment straightening with significant J-point ST elevation that should not be there (RED arrows in these leads).
- Although difficult to appreciate because of the small size of the QRST complex with some artifact undulation of the ST segment — I interpreted the RED arrow in lead V4 as highlighting T-QRS-D (Terminal QRS Distortion) — that strengthens the case for acute LAD OMI (See My Comment and illustration in the November 14, 2019 post in Dr. Smith’s ECG Blog for more on T-QRS-D).
Neighboring leads suggest additional leads are involved in the acute process:
- Abnormal ST segment straightening with excess J-point ST elevation is also seen in lead V6 (within the BLUE rectangle).
- The findings in lead V3 are especially subtle. Normally with RBBB — the ST-T wave depression that we see in leads V1,V2 here should not abruptly end in lead V3, especially given persistent R wave predominance in this lead. Instead — the dotted RED line in this lead shows there is some ST elevation in lead V3, whereas there should be none. I interpreted the ST-T wave picture in lead V3 as a “transition lead” between the RBBB-influenced ST-T wave depression in leads V1,V2 — and — the abnormal acute ST elevation from LAD OMI seen in leads V4,V5.
= = =
Putting It All Together:
In this patient with 3 days of worrisome symptoms — today’s ECG suggests acute LAD OMI in need of prompt cath. Whether the RBBB/LAHB and the abnormal Q waves are all “new” (with onset during the past 3 days) — and/or whether this patient at some time in the past had previous anterior MI, and is now presenting with new superimposed LAD OMI — is uncertain without more history and without a prior ECG.
- But regardless of what might be “new” vs “old” vs “new superimposed on old” — the abnormal ST-T wave findings in leads V3-thru-V6 have to be assumed a new acute event until proven otherwise by prompt cath.
Figure-1: I’ve labeled the initial ECG in today’s case.