Dr. Smith's ECG Blog

Instructive ECGs in Emergency Medicine Clinical Content

Associate Editors:
— Pendell Meyers & Ken Grauer (2018)
— Jesse McLaren & Emre Aslanger (2022)
— Willy Frick (2024)

editors

Chest pain with New LBBB: It helps to actually measure the ST/S ratio

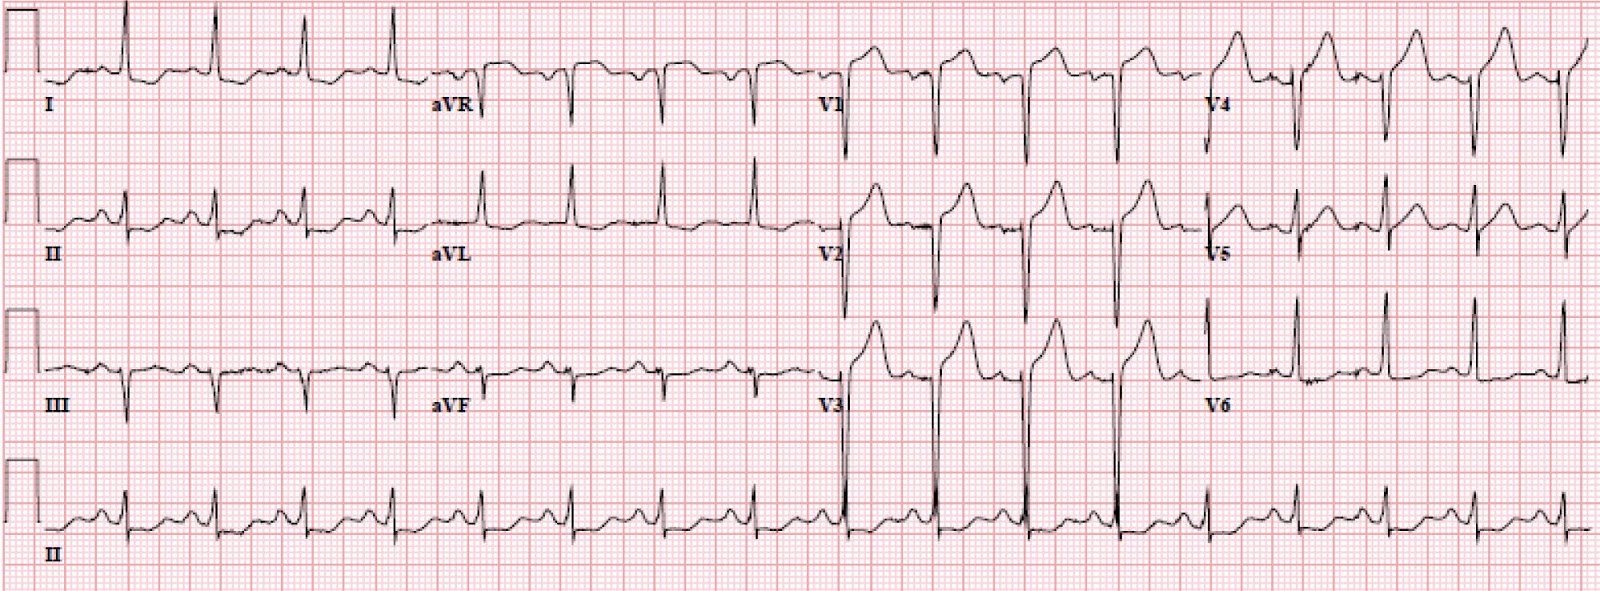
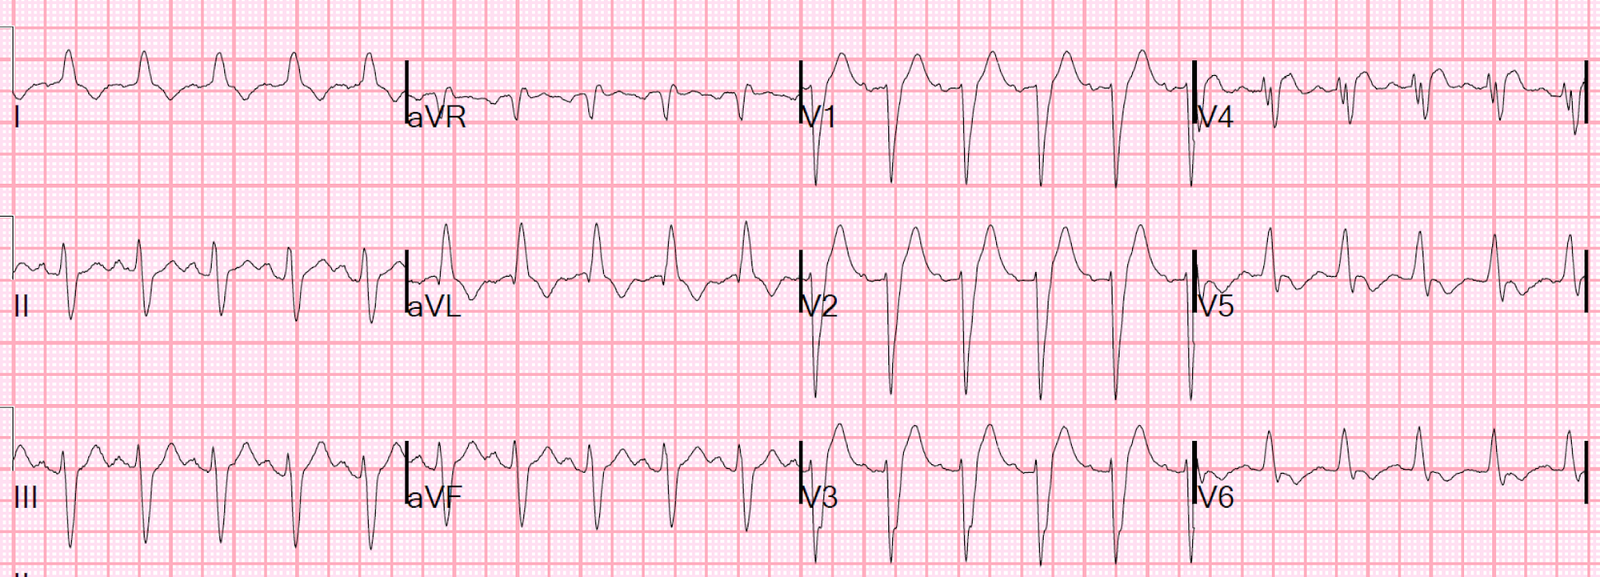
An elderly male presented with 48 hours of off and on chest pain.  This ECG was recorded with pain:

The QRS is 130 ms.  It is essentially LBBB, though some might quibble with the tiny Q-wave in aVL or the fact that the intrinsicoid deflection (onset to peak of R-wave in V5, V6) is not quite 60 ms (it is at least 55 ms).
When I first glanced at this, I did not think it looked like STEMI (that is, I did not think it met the modified Sgarbossa criteria)

But then I measure it.  Here is V3 magnified:

Here I point out where the J-point and the PQ junction are:

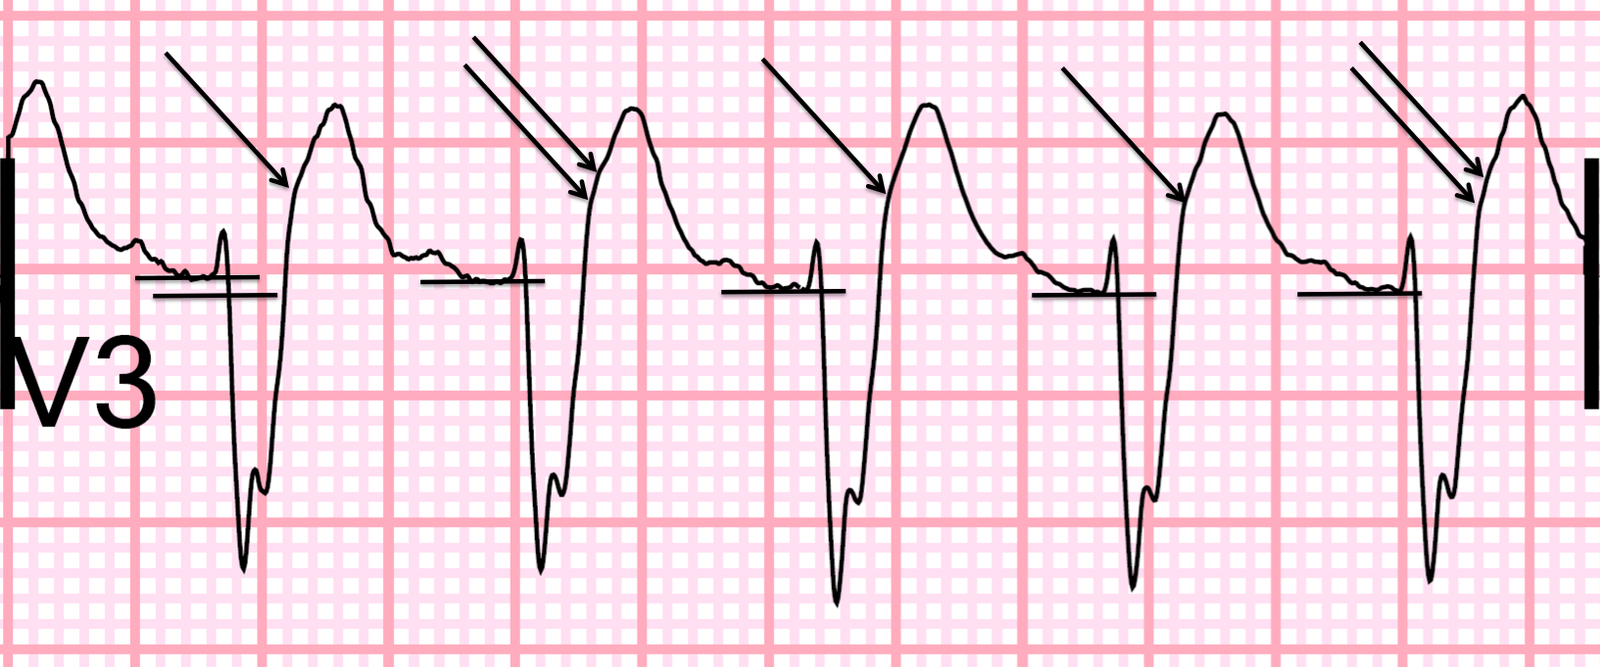
You can see that, no matter which complex you measure, the ST elevation at the J-point is at least 3.5 mm.  The S-wave is no more than 13 mm.
Thus, the ST/S ratio in V3 is greater than 0.25.
There is thus proportionally excessively discordant ST elevation.
Only one lead is required!

The cath lab was activated.

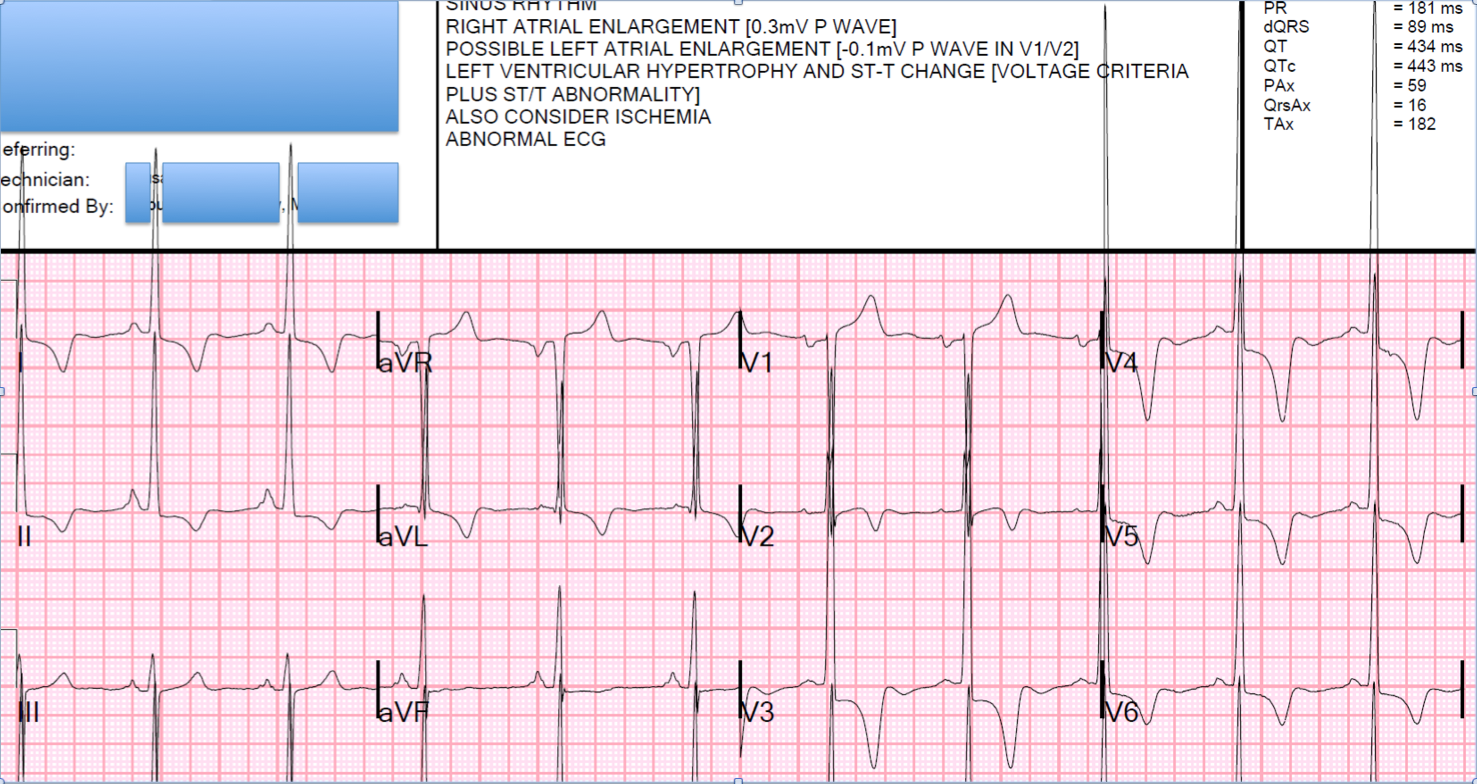
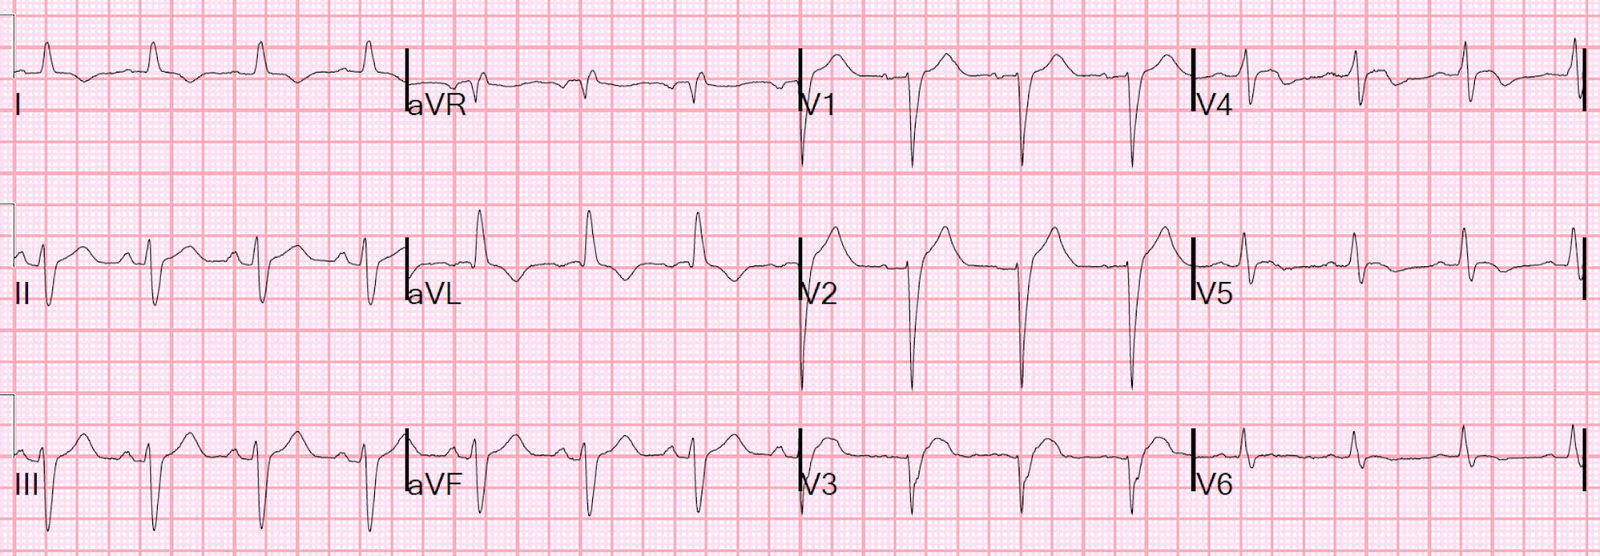
Another ECG was recorded, with reportedly ongoing chest pain:

Now the ST elevation is less.  The ratio is about 3/15 = 0.20.
0.20 is still very good for diagnosing coronary occlusion.
However, look at lead V4: there is 1.5/5.0 = 0.30 ratio (the QRS is so different from the first ECG that I suspect some lead placement changes)
This improving ECG makes it appear as if there is some reperfusion of the artery.

At angiogram, a 90% thrombotic lesion was found and stented.  I suspect that the artery had spontaneously reperfused prior to the angiogram.  That is why the ST segments were falling.

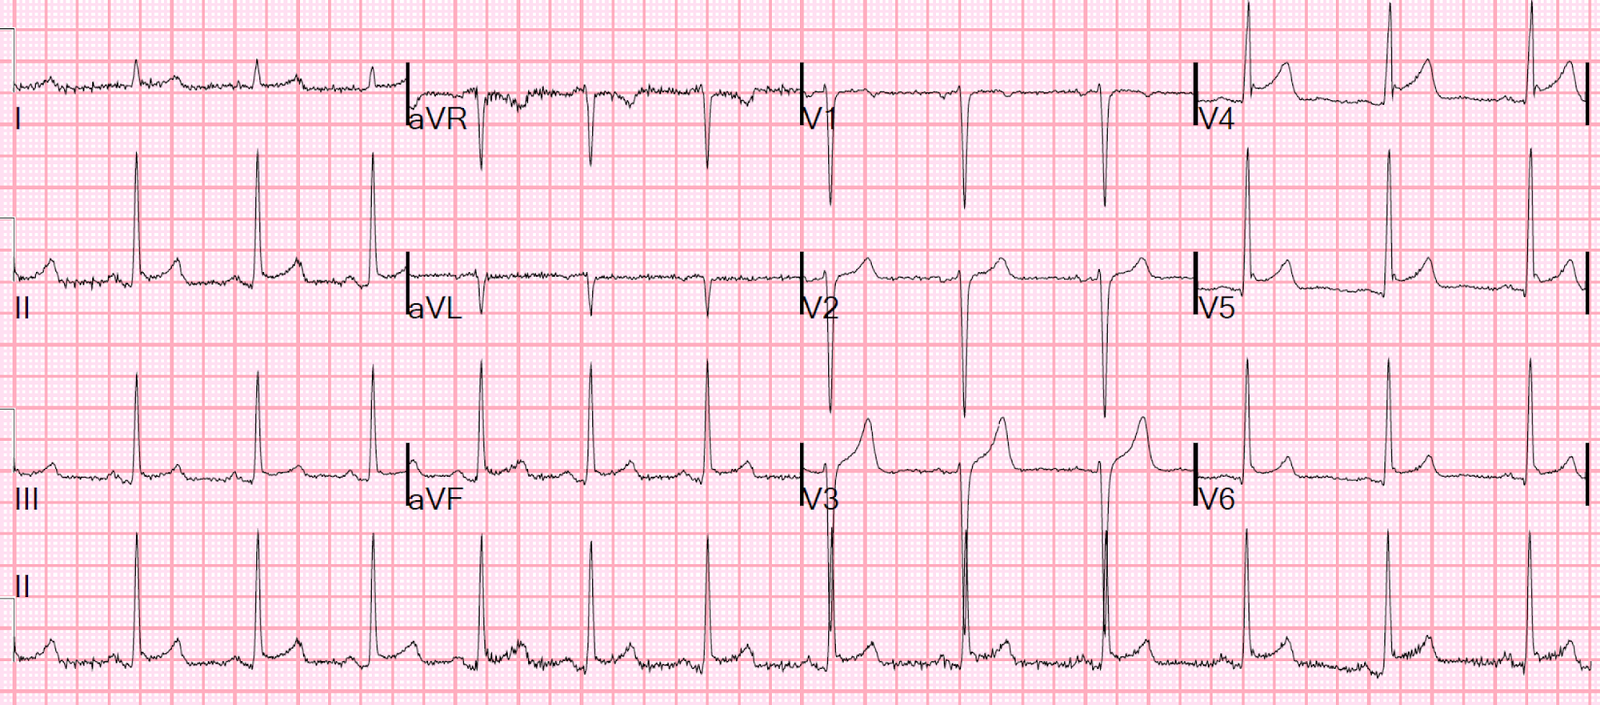
Here is the post-PCI ECG:

It is now much more atypical for LBBB and should be called a nonspecific intraventricular conduction delay.  QRS is 126 ms.
The disproportionally excessive discordant ST elevation is gone.

This is 2 days later:

LBBB is gone.  There is normal conduction and anterior reperfusion T-waves.

Learning Point:

In LBBB, measure the ST elevation at the J-point and the PQ junction.  In a patient with the right clinical scenario, if there is one lead with a ratio greater than 0.25, then there is occlusion until proven otherwise.

Previous Article

A Fascinating Demonstration of ST/S Ratio in LBBB and Resolving LAD Ischemia

Next Article

LVH with anterior ST Elevation. When is it anterior STEMI?

View Comments (12)
  1. Do you attach any importance to the notch in the upstroke of the s wave in V3 ? I always thought it was more important in V4 (Cabrerra's sign) but wonder if present in V3 is it also relevant.
    Jenny Moncur
    IC Paramedic, Australia

    1. There is no modern day data on this (with modern imaging or angiogram results). So its significance is really unknown.

  2. Cabrera's is one of the signs of a "fragmented QRS," and refers to a notch greater than 50 ms on the ascending limb of the S-wave in one of V3-V5 in V4 and V5. So this is a Cabrera's sign, but it is only a sign of past infarct, not acute infarct. And it's reliability is not established. Another is "Chapman's sign," (notch on the ascending limb of the R-wave in I, aVL, or V6)

  3. Jerry W. Jones, MD FACEP FAAEM

    Great case, Steve and an equally great reminder about using caution when "eyeballing" an ECG.

    As for the tiny q wave in aVL during a LBBB: anytime the initial 0.04 sec QRS vector is > +60 degrees in the frontal plane, you can still have a small q wave in aVL. Most ECG textbooks mention that a small q may still be seen in aVL during a complete LBBB (but of course NOT in leads I, V5 or V6). This is why.

  4. Newer paramedic question. Is the slight concordant ST segment depression and T wave inversion in leads V5 and V6 diagnostic in this case? These leads struck me as the most worrisome on my initial read of this ECG. I don't have as much experience in interpreting ECG's as most of the people who are commenting on this, so if anyone could offer thoughts, that would be appreciated.

  5. Emre Aslanger

    I suspect that tachycardia might be the dominant reason for disproportionate ST elevation and its improvement with time. Any thoughts for differentiation ?

    1. Steve Smith

      That is possible, but the angiogram and evolution of T-wave inversion support LAD occlusion as the etiology. It would be very unusual for tachycardia alone to result in a ratio > 0.25. It does indeed result in relative ST elevation, but rarely diagnostic ST elevation.

Leave a Comment

Your email address will not be published. Required fields are marked *