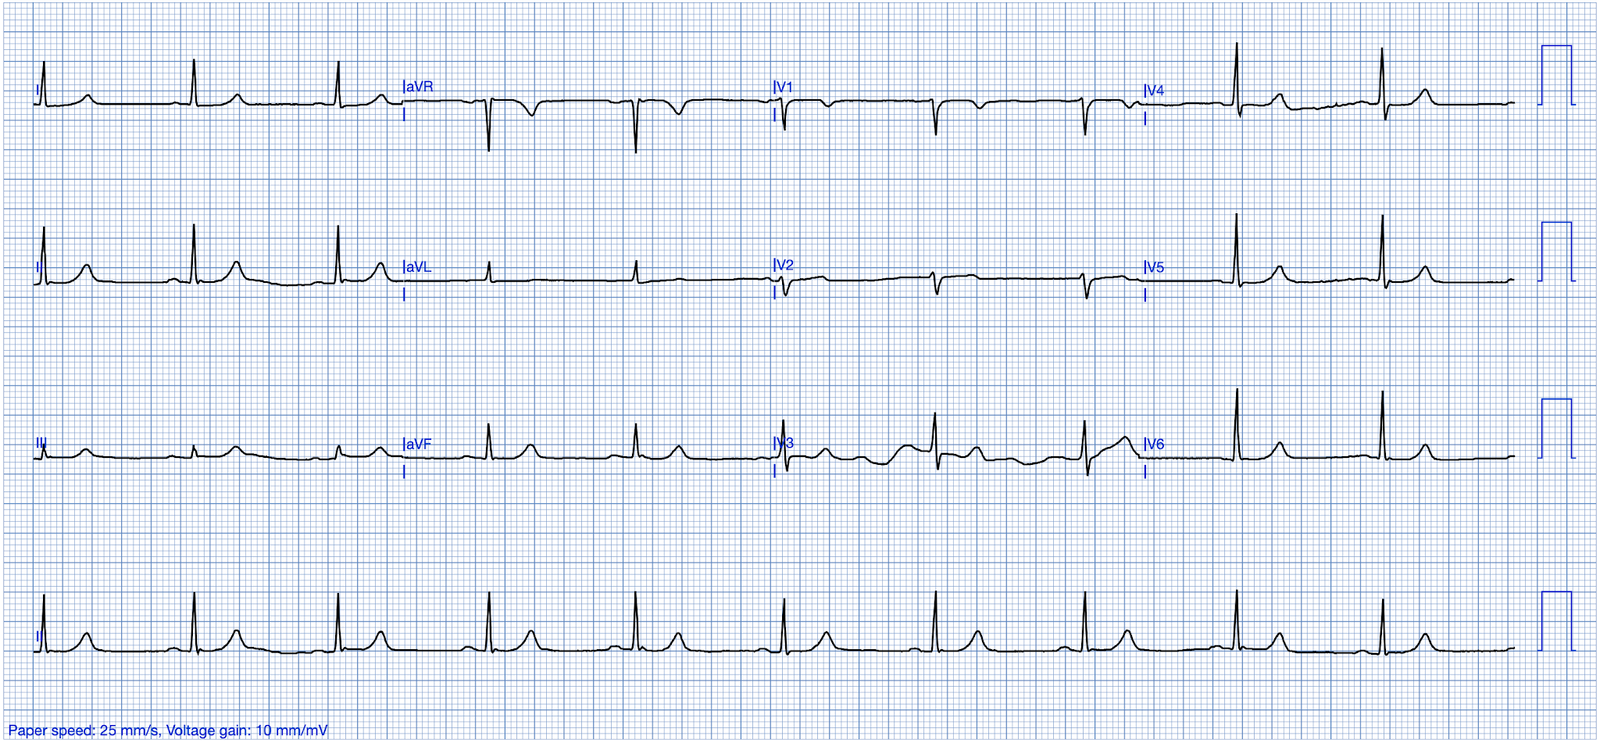
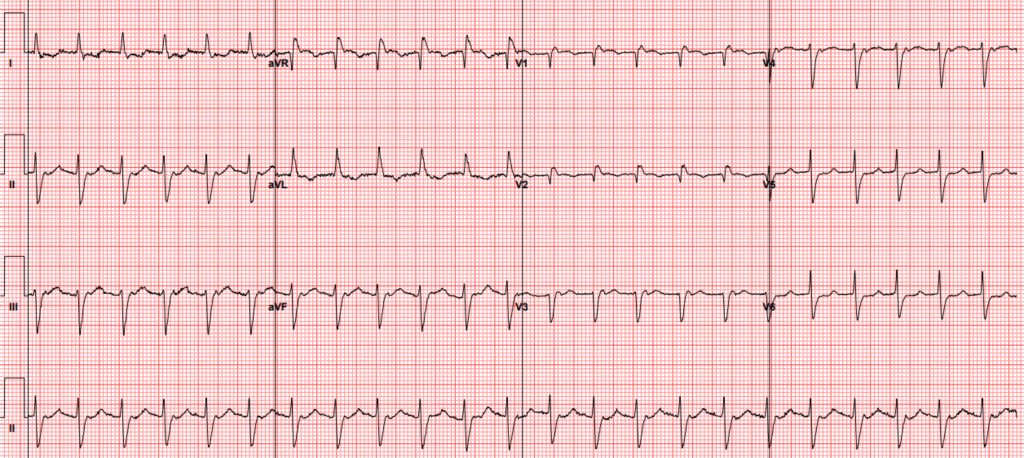
A woman in her late 70s presented with nausea, vomiting, and diarrhea. Her emergency department ECG is shown below:
ECG 1
What do you think?
This was interpreted as atrial flutter with 2:1 block. The patient received metoprolol 5 mg IV and converted to sinus rhythm.
ECG 2
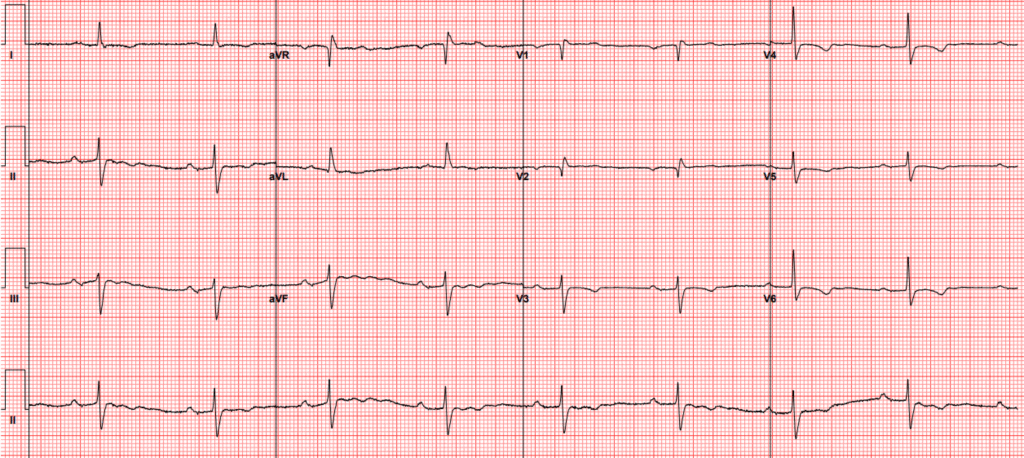
Do we still believe the diagnosis of atrial flutter? Remember that metoprolol has no ability to cardiovert atrial fibrillation or flutter. It helps those patients by slowing conduction through the AV node and preventing rapid ventricular rate, but it does nothing for the underlying arrhythmia.
It is possible that a person could spontaneously convert after receiving metoprolol, but it is more likely the rhythm was not atrial flutter in the first place. Other possibilities for regular, narrow complex tachycardia are the usual suspects — AVNRT, AVRT, and atrial tachycardia. When you are considering an SVT diagnosis, it is useful to compare the QRS complexes between sinus rhythm and SVT to inspect for any morphologic differences that could be concealing atrial activity.
In this case, V3 is very useful to inspect side by side. Do you see any differences?
Lead V3 side by side
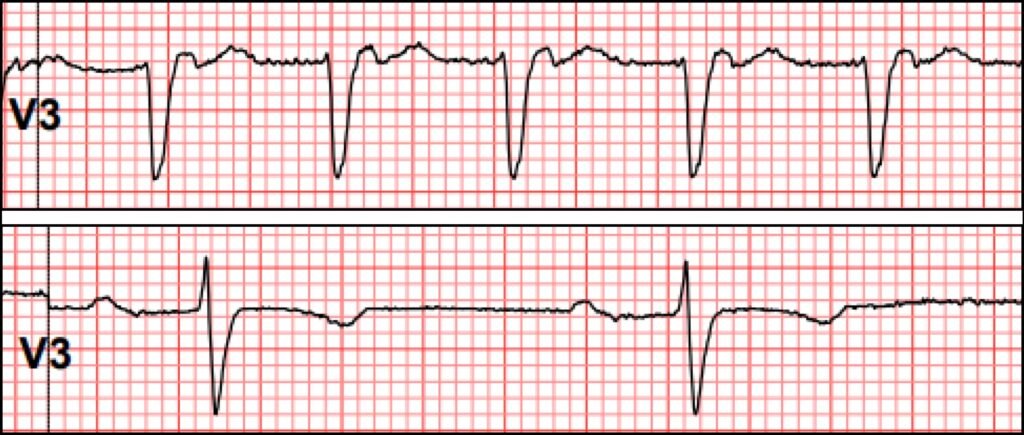
One difference you might notice is the loss of R wave during tachycardia. This may be due to differences in electrode positioning (for example if the electrode was positioned higher or more medial during tachycardia vs sinus). The other difference is the terminally positive wave at the end of the QRS.
V3 terminally positive deflection
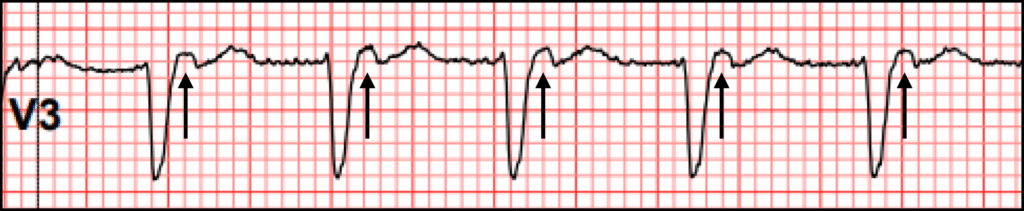
This difference cannot be explained by lead positioning, and the more likely explanation is that it reflects atrial activity. We can prove it is not 2:1 activity by using marching calipers to look for an additional P wave halfway in between those we have identified above.
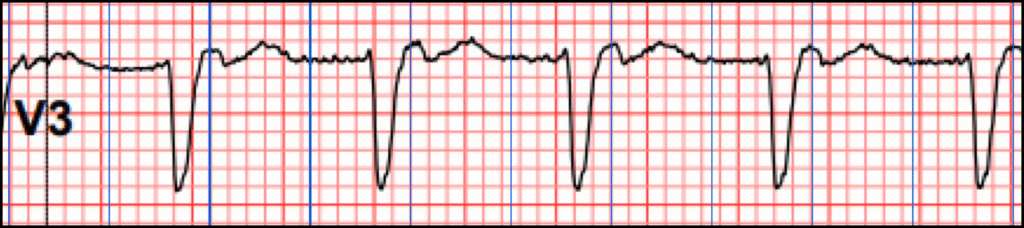
V3 with marching calipers
This finding is referred to as a “pseudo R’.” It is characteristically seen best in V1, but in this case we see it in V3. It is strongly suggestive of typical AVNRT.
What is typical AVNRT? It is a supraventricular tachyarrhythmia where the AV node contains a fast (regular) pathway, and a slow pathway. Most of the time in patients with dual AV nodes of this type, sinus beats arrive at the AV node and enter BOTH pathways. The fast pathway wins the race through the node, and depolarizes the ventricles via the His-Purkinje system (HPS). The slow pathway arrives a bit later when the HPS is refractory, and has no effect on the ECG.
Back to the case:
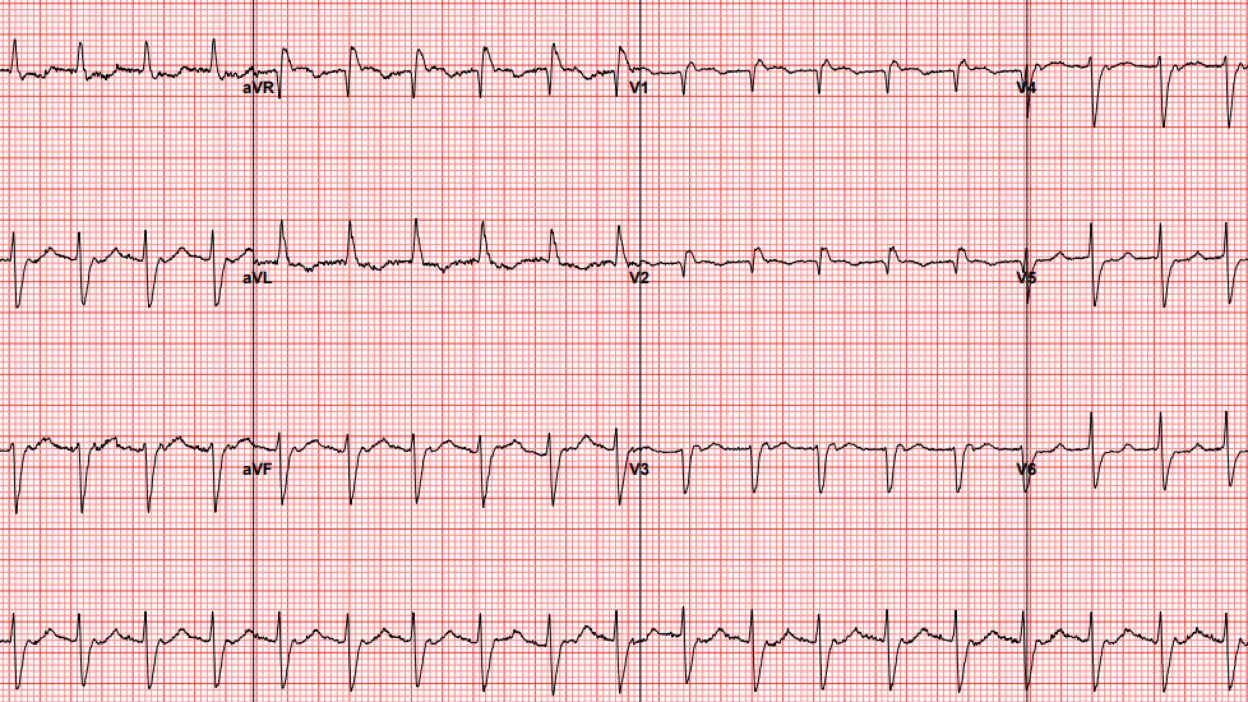
The patient was started on amiodarone and therapeutic anticoagulation, and discharged with outpatient follow up. Several days later, she presented with dizziness. ECG showed junctional bradycardia with heart rate in the 30s. Amiodarone was held and she was admitted.
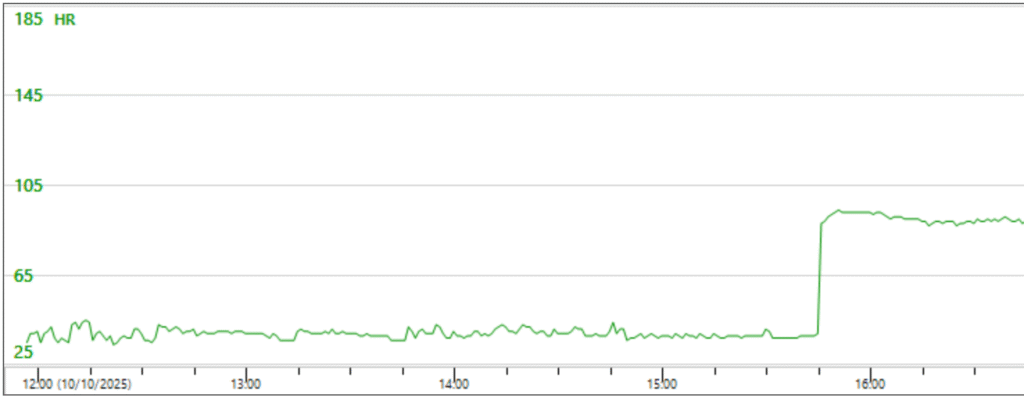
On review of her telemetry, her heart rate trend showed an abrupt change. The heart rate trend line is a very powerful tool to find interesting portions of telemetry, especially when there are abrupt rate changes.
Telemetry with abrupt rate change
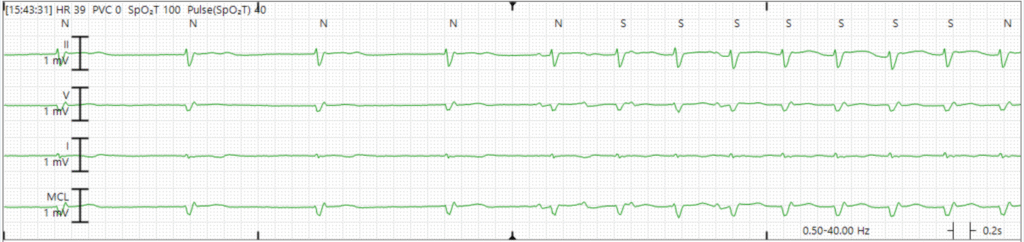
The rhythm at this change is shown below. Have a look and see if you can explain it to yourself before scrolling further.
Rhythm change
Here is my interpretation with a ladder diagram. Please note that this is just one educated guess. There are other possible reasonable interpretations.
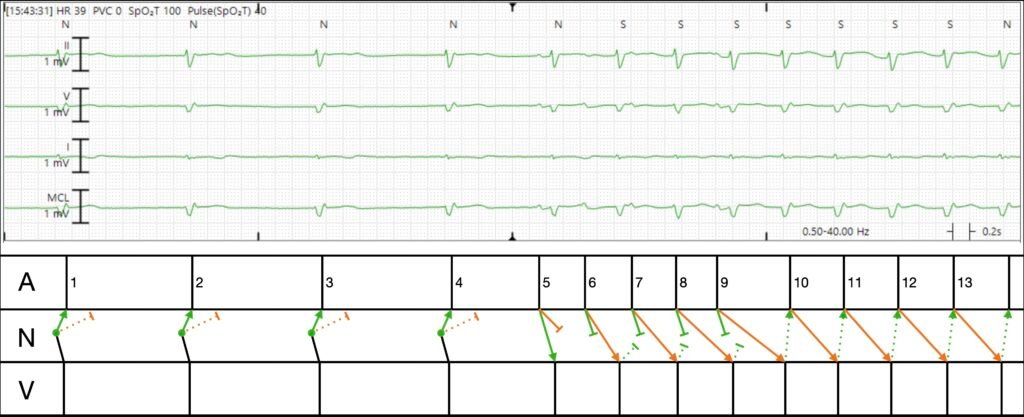
Explanation in words:
- The first four beats are junctional escape beats which conduct antegrade into the ventricle, and retrograde up the fast pathway (green). They also conduct up the slow pathway (orange), but since the fast pathway wins the race, the atrium is refractory and there is no evidence of slow pathway conduction on surface ECG. In the language of EP, we call this “concealed conduction.”
- All of a sudden, the atrium spits out a few beats, P waves 5, 6, 7, 8, and 9. Probably a burst of ectopic atrial tachycardia (i.e. a few consecutive PACs).
- P5 conducts rapidly down the fast pathway giving rise to a ventricular beat. It also conducts down the slow pathway but loses the race.
- P6 comes quickly, and as a result, the fast pathway (green) is refractory, hence it conducts to the ventricle via the slow pathway (orange) with long PR.
- P7-9 conduct similarly, but with decrement each beat. This is normal physiologic AV node behavior. The faster that impulses arrive, the slower it conducts.
- After P9, we don’t see any additional UPRIGHT P waves originating from the atrium. Instead, P9 conducts VERY slowly down the slow pathway (the PR is longer than the RR!). By the time it finally arrives at the bottom of the AV node and conducts to the ventricle, the fast pathway has recovered, and this initiates re-entry.
Since the total rate is less than 100, you cannot even call this atrioventricular nodal reentrant tachycardia. Instead, this is atrioventricular nodal reentrant arrhythmia.
This patient went for EP study, and was proven to have easily inducible AVNRT in lab, which was successfully ablated.
Learning points:
- Compare the QRS in sinus rhythm and SVT for any subtle differences which may reflect atrial activity, in particular the “pseudo R prime.”
- The heart rate trend line on telemetry is very helpful for learning arrhythmia mechanisms by studying onset and termination.
- Abrupt termination of a narrow complex with AV nodal blockers strongly favors node-dependent tachycardia, e.g. AVNRT or AVRT.
= = =
======================================
MY Comment, by KEN GRAUER, MD (12/26/2025):
Regular readers of My Comments in Dr. Smith’s ECG Blog know that I often cite this quote by Rosenbaum — “Every self-respecting arrhythmia has at least 3 possible interpretations.” Today’s case certainly qualifies as displaying several “self-respecting” ( = challenging) arrhythmias — for which I’ll offer another perspective to that provided above by Dr. Frick in his excellent discussion..
= = =
MY Thoughts on the Initial Rhythm:
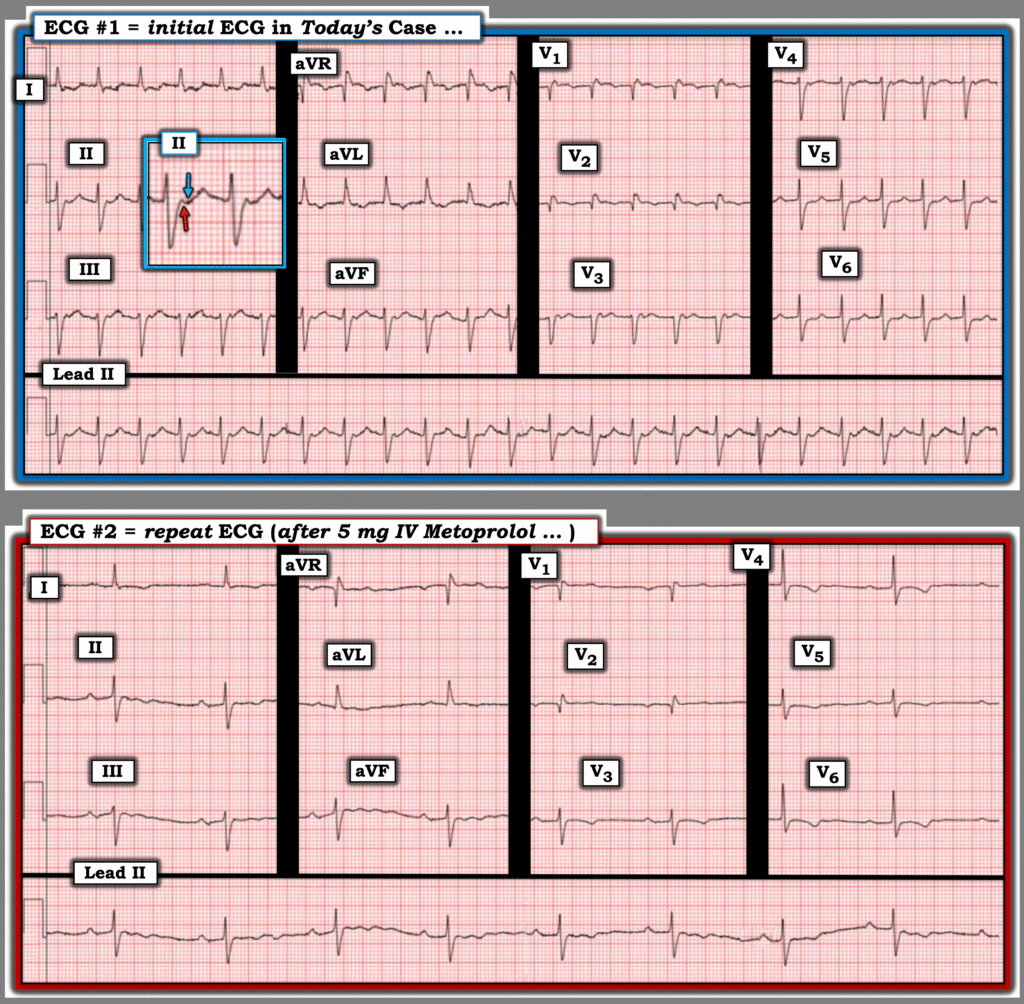
For clarity in Figure-1 — I’ve reproduced the initial ECG — with the repeat tracing below it (recorded after 5 mg IV Metoprolol successfully converted the rhythm to sinus).
- I interpreted ECG #1 as showing a regular SVT (SupraVentricular Tachycardia) rhythm at ~135/minute, but without clear sign of sinus P waves. This description should prompt the usual differential diagnosis of: i) Sinus tachycardia (highly unlikely in Figure-1, since the upright deflection in the middle of the R-R interval in lead II looks to be a T wave; It would be very unusual for there to be such a long PR interval in sinus tachycardia when the rate is this fast); — ii) AFlutter (which it is not — as per the above demonstration by Dr. Frick that none of the 12 leads demonstrate any sign of 2:1 AV conduction); — iii) ATach (Atrial Tachycardia) — which might be possible (albeit this would entail a very long PR interval); — or, iv) A reentry SVT (ie, either AVNRT or orthodromic AVRT — depending on whether the reentry circuit was contained within the AV Node, or extended beyond the AV Node with inclusion of an Accessory Pathway).
- I suspected the answer was iv) = a reentry SVT — with the KEY to further distinction between AVNRT vs orthodromic AVRT residing with whether retrograde atrial activity might be present, and if so — the nature of such atrial activity.
- KEY Point: In general — retrograde P waves are recognized by the presence of negative deflections in one or more of the inferior leads (II,III,aVF) that occur after the QRS complex. With AVNRT (in which the reentry circuit is entirely contained within the AV Node) — the RP’ interval ( = distance from the QRS until the retrograde P wave) tends to be very short, such that we either do not see retrograde negative deflections (because they are “concealed” within the QRS) or we see retrograde P waves occurring at the very end of the QRS (often distorting the S wave in lead II, III and/or aVF).
- In contrast — with orthodromic AVRT (in which the complete path of the reentry circuit will be greater because the circuit extends outside of the AV Node to include a portion of an AP) — there tends to be a longer RP’ interval, in which the negative retrograde deflection will usually be seen after the end of the QRS, within the ST segment. Exceptions exist! — but the above generalities with respect to the length of the RP’ interval often provide an insightful clue as to whether or not the patient is likely to have a “concealed” AP that participates in the retrograde limb of a reentry SVT rhythm.
So how do we know if the tiny deflections that we see during a fast SVT rhythm represent retrograde P waves?
- The best way to tell — is to scrutinize the QRS complex in the repeat ECG obtained after conversion to sinus rhythm, to see if the deflections we were questioning during the SVT are no longer seen. This is where the long lead II rhythm strips at the bottom of each tracing in Figure-1 are so helpful — because they provide us with multiple consecutive beats that reveal what was happening in lead II.
- As suggested in the magnified insert view in lead II of ECG #1 — I thought there was a biphasic retrograde P wave (RED arrow highlighting a small initial pointed upright deflection immediately after the QRS — followed by a BLUE arrow highlighting a wider negative deflection seen just before the T wave). To Emphasize: I was not at all certain about what I was seeing — as biphasic retrograde P waves are rare, and baseline artifact complicated my assessment.
- That said — I thought that if the positive RED arrow deflection after the QRS was not part of a retrograde P wave — then the RP’ interval of the BLUE arrow negative deflection would still be longer than what I would expect with AVNRT (in which the reentry circuit is entirely contained within the AV Node).
- To Also Emphasize! — None of what I describe above affects initial management of this patient, since regardless of whether the rhythm in ECG #1 turns out to be AVNRT or orthodromic AVRT — treatment with vagal maneuvers, adenosine, verapamil/diltiazem, and/or a ß-blocker should be equally appropriate and effective. But I think it insightful to get as close as possible to a definitive rhythm diagnosis that may assist with longterm management decisions.
- To Summarize: We know that biphasic retrograde P waves are rare, but when they occur, they are most often associated with participation of a concealed AP in the reentry circuit (Ching-Tai Tai et al — JACC 29(2): 394-402, 1997 ). And, even if the retrograde P wave in ECG #1 was the single negative BLUE arrow deflection in Figure-1 — the RP’ interval is longer than usual for AVNRT — which is why I suspected orthodromic AVRT in a patient with a concealed AP as the etiology of the SVT rhythm in ECG #1.
- P.S.: The rhythm in ECG #2 is now sinus — but the rate of this sinus rhythm after treatment with IV Metoprolol is slow ( = sinus bradycardia at ~55/minute). Not seeing any additional 12-lead post-conversion tracings on this patient in her late 70s — if this degree of bradycardia persisted at the time of her discharge from the hospital, one would have to wonder if the patient might not have a “Tachy-Brady” form of SSS (Sick Sinus Syndrome) — with her “tachy” component ( = the reentry SVT rhythm) exacerbated by rate-slowing medication ( = the IV ß-blocker).
= = =
Figure-1: Comparison between the initial ECG — and the repeat ECG recorded after conversion to sinus rhythm.
= = =
What Happened Next?
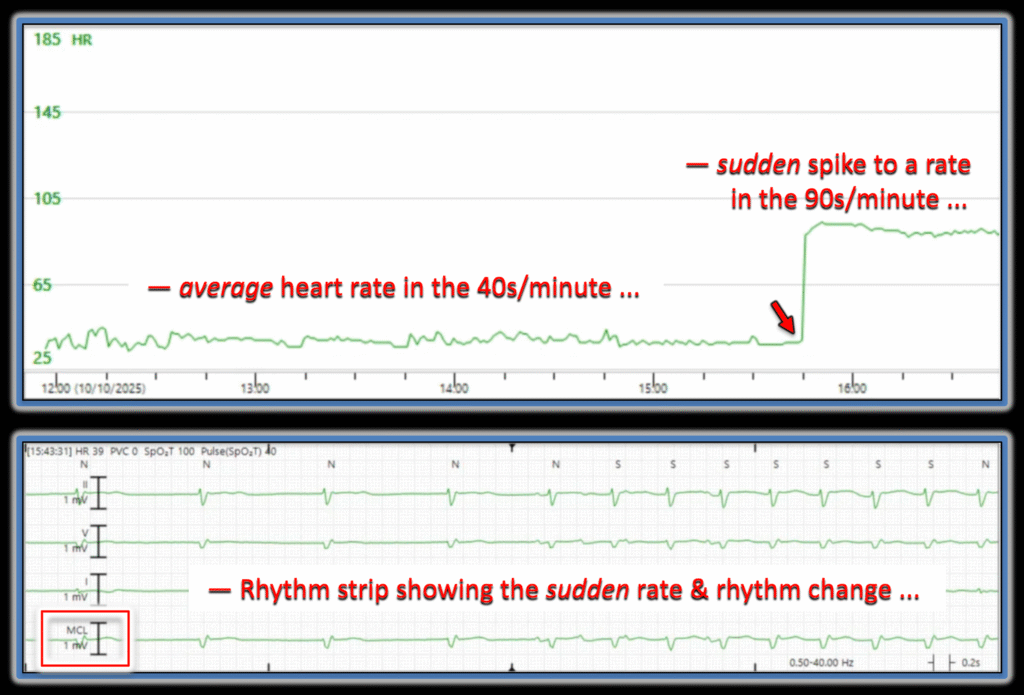
As per Dr. Frick’s above discussion — this 70+ year old woman was discharged from the hospital on Amiodarone, with plan for outpatient follow-up. Several days later, she returned to the hospital with dizziness and marked bradycardia — with the trend analysis and telemetry tracing shown in Figure-2 that I have reproduced from Dr. Frick’s presentation:
- As per Dr. Frick — Telemetry monitoring showed persistent bradycardia in the 40s lasting for hours — until a sudden “spike” in heart rate up to ~90/minute, with the fascinating rhythm strip recorded at the time of this sudden rate and rhythm change ( = the multi-lead rhythm strip shown below the trend analysis in Figure-2).
- KEY Point: Our suspicion of SSS is clearly increased by review of the trend analysis and rhythm strip shown in Figure-2. That said — SSS (and the need for permanent pacing) can only be diagnosed after “fixable” causes of alternating tachycardia-bradycardia have been ruled out (ie, Withdrawal of the Amiodarone that this patient had been placed on — as well as ruling out recent or ongoing ischemia-infarction, hypothyroidism, sleep apnea).
- For more on SSS — See My Comment in the January 22, 2020 post in Dr. Smith’s ECG Blog.
= = =
Figure-2: Trend analysis and telemetry tracing following readmission to the hospital of today’s patient.
= = =
Another Laddergram Possibility …
I’ll conclude my comments with another perspective on the rhythm strip shown at the bottom of Figure-2 — for which Dr. Frick provided his laddergram illustration in his above discussion.
- As per the Rosenbaum citation I started my comments with — more than a single laddergram explanation may be possible with complex arrhythmias, with final validation often possible only by EP study.
- I could be wrong — and Dr. Frick’s laddergram may more accurately predict the mechanism of this complex arrhythmia. But I thought it interesting to discuss another possibilty via my proposed laddergram that I show in Figure-3.
- NOTE: I put forth my laddergram theory that I show in Figure-3 before I learned the results of EP Study that confirmed AVNRT as the mechanism of this patient’s tachycardias.
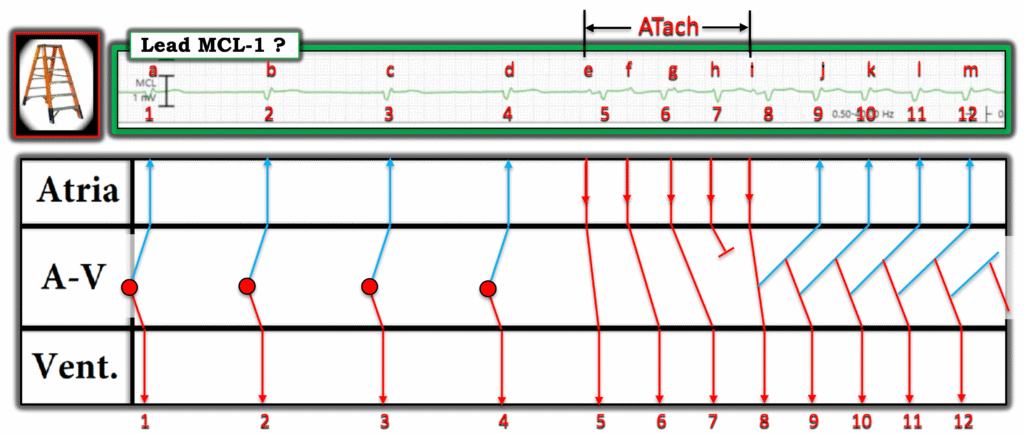
The rhythm in my Figure-3 laddergram begins with the bradycardia that we saw in the trend analysis from Figure-2. I suspect the “MCL” label represents a right-sided monitoring lead, such as MCL-1. I’ve numbered the beats — and have labeled P waves with small-case letters in this laddergram.
- Beats #1-thru-4 show a junctional escape rhythm (ie, a regular, narrow QRS rhythm without sinus P waves — at a rate in the low 40s).
- The terminal (pseudo-r’ ) upright deflections in the first 4 QRS complexes are almost certain to represent retrograde P waves (labeled a,b,c,d) — as retrograde P waves in lead V1 are typically positive, and these terminal positive deflections that we see in beats #1-thru-4 are missing from conducted beats #5 and 8.
- The light BLUE lines from these initial 4 beats schematically represent tranmission of the impulse over the AP (that I suspected was present from my discussion of Figure-1) — with this retrograde conduction arising from the junctional escape focus in the AV Nodal Tier.
- There then follows a 5-beat run of ATach (P waves labeled e,f,g,h,i ). As commonly occurs with runs of ATach — there is Wenckebach conduction with progressively increasing PR intervals until P wave “h” is non-conducted. The cycle begins again with beat #8 that is conducted with a normal PR interval by P wave “i”. This apparently primes conditions for initiation of the reentrant nodal rhythm at ~90/minute for the duration of the tracing (which as per Dr. Frick — is technically “too slow” to qualify as AVRT — given the absence of “Tachycardia”).
- The light BLUE lines (beginning with beat #8) — once again schematically represent active participation by the concealed AP in the reentry circuit.
BOTTOM Line: Regardless of whether my laddergram or Dr. Frick’s laddergram is “correct” — today’s patient manifests alternating brady-tachy rhythms suggestive of SSS (pending what happens after Amiodarone is withdrawn).
= = =
Figure-3: My proposed laddergram for the rhythm strip shown in Figure-2.
= = =
= = =