This is written and contributed by Jesse McLaren (@ECGCases), with comments and edits by Smith, and commentary by Ken Grauer (@EKGPress)
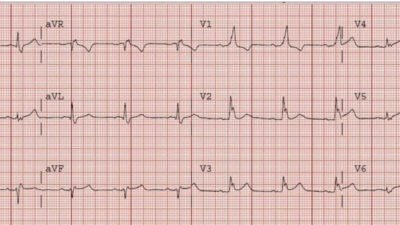
An 80 year-old female presented
with weakness and a fall, with normal vitals and no injuries. The ECG was
labeled ‘normal’ by the computer, later confirmed by the cardiologist. What do
you think?
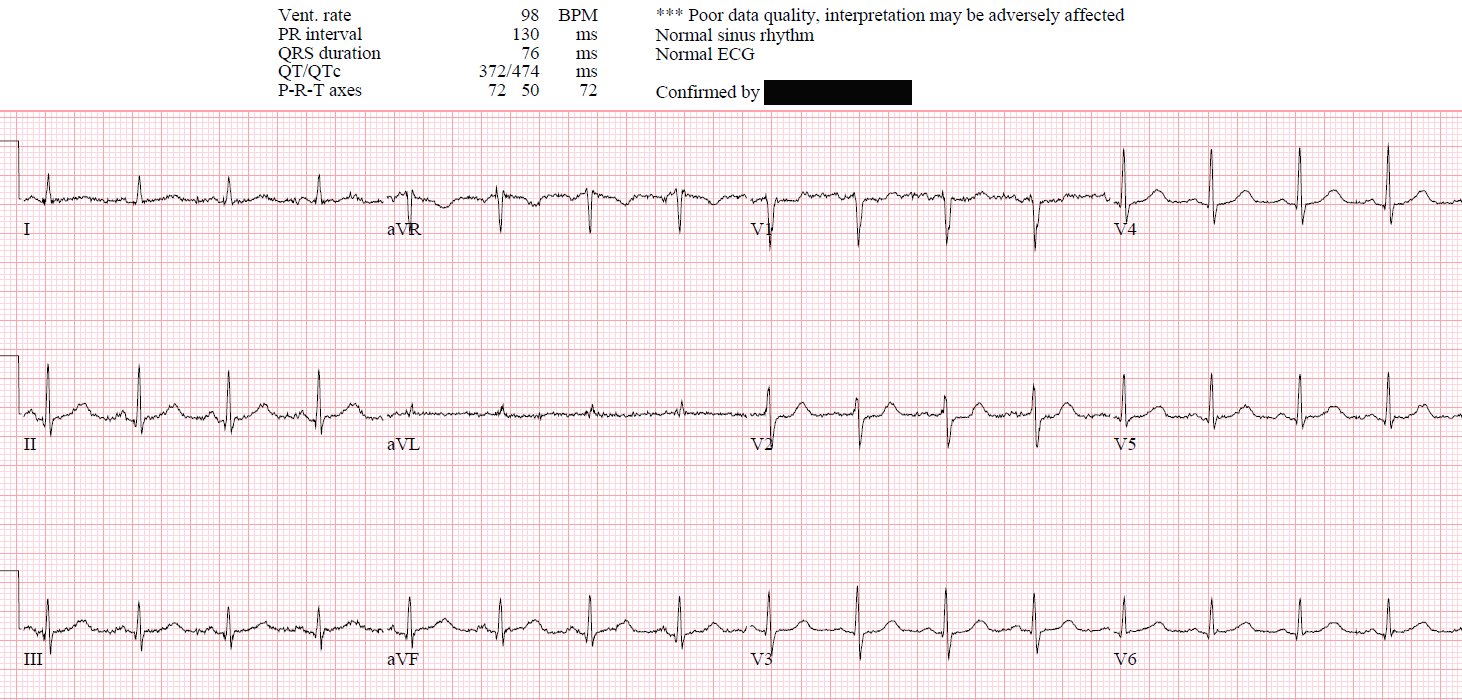
(Marqette 12SL algorithm)
There’s normal sinus rhythm, normal
conduction, normal axis, normal R wave progression, and normal voltages.
There’s usually a small amount of concave ST elevation in V2-3 but here there
is horizontal ST depression in V2 and possibly V1.
Smith: without any further information, my interpretation adds that there are inferior hyperacute T-waves and possibly also in V4-V6, and subtle reciprocal ST depression and T-wave inversion in aVL.
Any primary ST depression in
V1-4 (i.e. not secondary to abnormal conduction from RBBB, RVH, or WPW) is
posterior Occlusion MI until proven otherwise, and is often associated with
subtle findings in the inferior and/or lateral leads: “all patients with
posterior OMI had either (1) at least 1mm STDmaxV1-4 or (2) other subtle
findings of OMI in addition to any STDmaxV1-4 (even if <1mm).”[1] Although there is less than 1 mm STD in V2, there are indeed other subtle signs of OMI (in inferior and lateral leads).
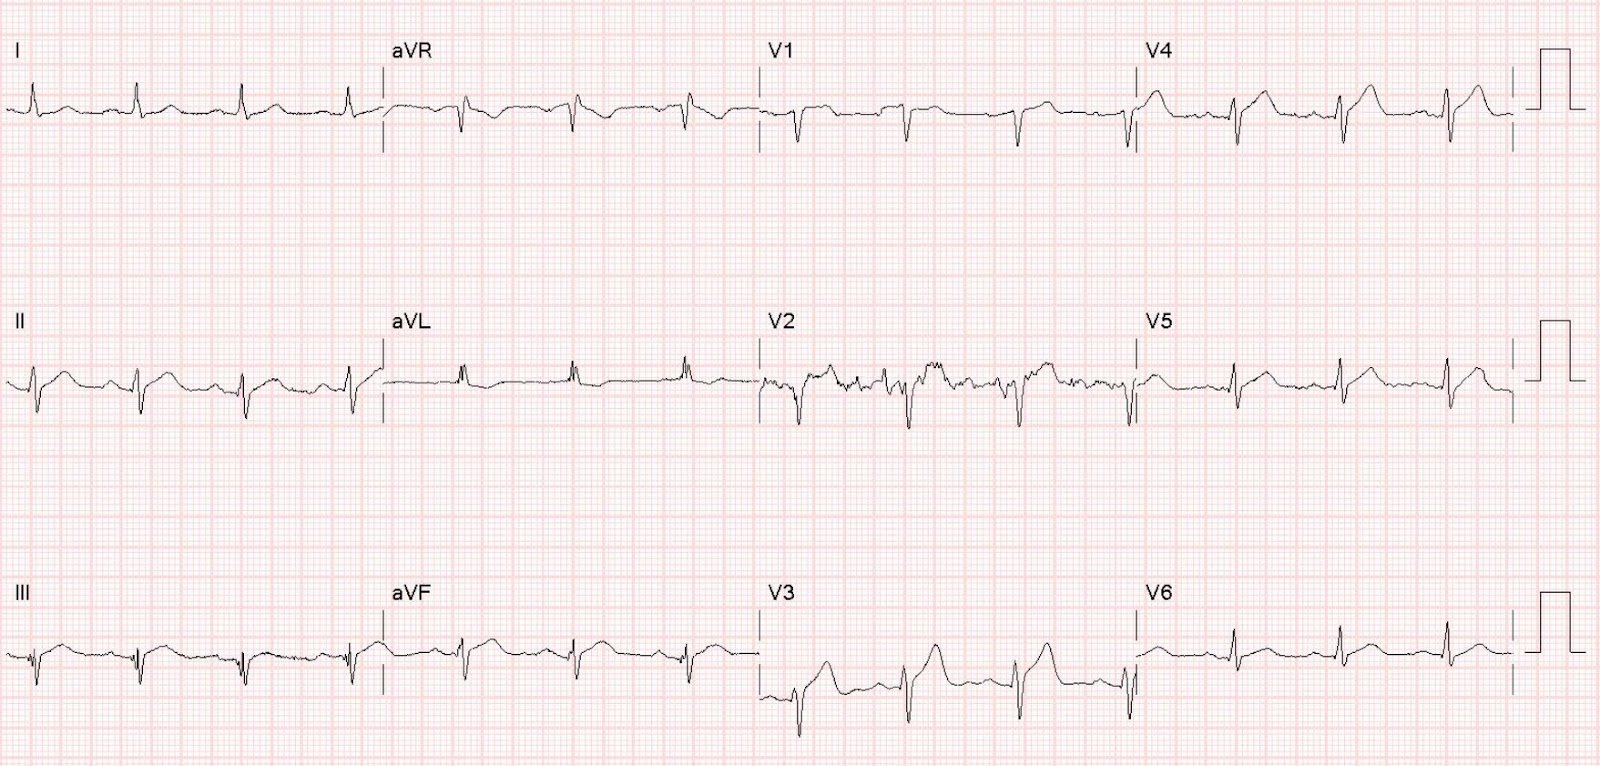
Compared with the old ECG
(below, which is truly normal), the ST depression in V1-2 is new, the T waves in
III/aVF are slightly larger and the reciprocal T wave in aVL is no longer
upright:

(Marqette 12SL algorithm)
The first opportunity to
diagnose this subtle posterior OMI was missed, likely because 1) the patient
presented with an anginal equivalent rather than chest pain, 2) the ECG was ‘STEMI
negative’, and 3) the computer interpretation was ‘normal’.
Smith: this proves my impression that the inferior T-waves on the first ECG are hyperacute. Let’s look at inferior leads + aVL side-by-side in both the new (left) and old (right):

And in leads V4-V6 (left is new, right is old):

Both of these comparisons
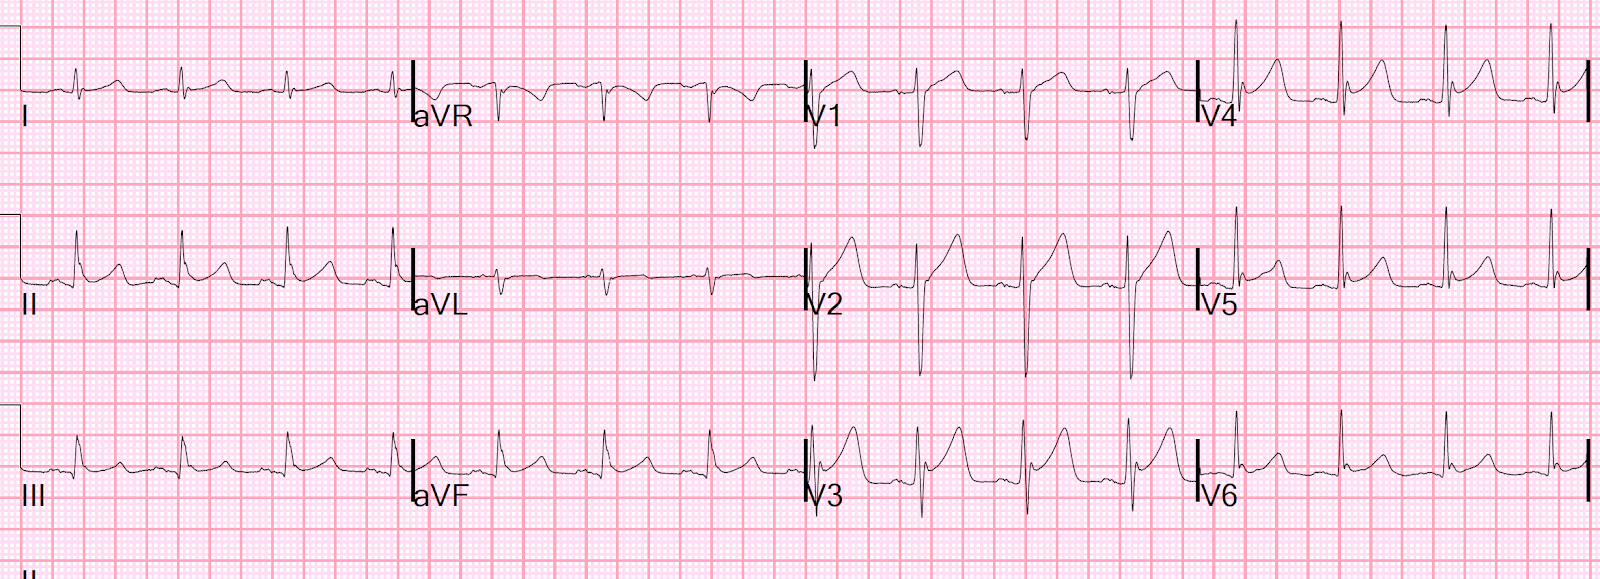
An hour later the troponin I
returned at 500 ng/L (normal <16 in females), raising the suspicion that the patient’s
weakness was an anginal equivalent. Not seeing any changes on the initial 12
lead ECG, the emergency physician got a 15 lead ECG (below, where V4-6 are actually V4R and V7-8):

There’s no posterior ST
elevation but the anterior ST depression has resolved between the first and
second ECG. While this ECG is negative for “posterior STEMI”, the resolution of
anterior ST depression (accompanied by the troponin elevation) confirms
posterior OMI with spontaneous reperfusion. The patient was given aspirin and a
repeat 12 lead ECG was done 2 hours later after the troponin rose to 1,300 ng/L:

(Marqette 12SL algorithm)
No recurrence of anterior ST
depression. The patient was referred to cardiology and admitted as an NSTEMI,
with antiplatelets/heparin and delayed angiography.
In the STEMI/NSTEMI dichotomy,
NSTEMI is supposed to mean non-occlusive myocardial infarction, but this patient
had transient Occlusion MI that was at risk for re-occlusion (like ‘transient
STEMI’). The second opportunity to make the diagnosis and expedite angiography
was missed because the ECG never met STEMI criteria and continued to be labeled
‘normal.’ But if this was truly a non-occlusive MI (NOMI) there should be no
signs of reperfusion.
Six hours later a repeat ECG
was done, with a repeat troponin downtrending at 1,000 ng/L.

(Marqette 12SL algorithm)
Anterior T waves are slightly taller
and the inferior T waves are returning to their normal small size. The troponin
continued to fall, and another ECG was repeated 24 hours later:

(Marqette 12SL algorithm)
Now
the anterior T waves are clearly taller, giving the appearance of hyperacute T
waves (including a ‘new tall T wave in V1’). But in the context of resolved
anterior ST depression these are posterior reperfusion T waves, a mirror image
of reperfusion T wave inversion, and what we have called “Wellen’s syndrome of the posterior wall.” (4) This adds more confirmation to the diagnosis
of transient OMI at risk for re-occlusion. But this third opportunity to make
the diagnosis was missed, with an ECG labeled and confirmed as ‘normal’. The patient had an echo showing basal
inferior wall hypokinesis, corresponding to the ECG changes. Two days later there
was another ECG:

(Marqette 12SL algorithm)
The posterior reperfusion T waves are
resolving, but now there’s a QS complex in III with inferior reperfusion T wave
inversion in III/aVF—also labeled and confirmed as ‘normal’.
Notice also that there is new T-wave inversion in III with upright T-wave in aVL, confirming inferior infarction. And notice that the T-waves in V4-V6 are now back down to normal size and “bulk.”
Delayed
angiogram found a 95% mid RCA occlusion that was stented. Even with the benefit
of hindsight the discharge diagnosis called the ECGs ‘normal’ and gave a
discharge diagnosis of NSTEMI, retrospectively missing a fourth opportunity to identify a transient OMI. Automated
interpretation (and apparently the confirmation) only looks at each ECG in
isolation, is limited to STEMI criteria, and doesn’t consider reperfusion. While
each ECG change in isolation is subtle, and some differences are accounted by
voltage differences, as a series they show a clear progression of posterior
OMI from occlusion (anterior ST depression) to reperfusion (normalization of ST
segments and tall T waves). Here is the series focused on leads V1-3:

A
number of small studies have suggested that ECGs labeled ‘normal’ by the
computer and confirmed by cardiologists are unlikely to have clinical
consequences. This case might appear to support this because the patient had atypical
symptoms and a small MI, and the delay to angiography had no impact. But this
was a near miss. Elderly patients commonly present with anginal equivalents,
which are associated with delayed presentation, undertreatment and double the
mortality rate even if they meet classic STEMI criteria.[2] This is compounded
by those who don’t meet STEMI criteria: posterior STEMI(-)OMI “had similar peak
troponin levels but significantly lower chance of receiving catheterization
within 90 minutes of presentation…because of the absence of STEMI criteria,
despite the fact that they could have been identified easily and immediately by
STDmaxV1-4, in addition to other subtle signs of OMI.”[1]
The
patient did not have a good outcome because
their ECG was labeled ‘normal’ but in
spite of it. It was only because their RCA spontaneously reperfused and did
not re-occlude prior to angiography that this patient avoided the fate of many
elderly patients who present with anginal equivalents and STEMI(-)OMI. But
others are not as fortunate, so we should learn from these near misses to better
identify signs of occlusion and reperfusion.
Take
home:
- Elderly patients have a higher rate of
angina equivalents, which are associated with delayed diagnosis, undertreatment
and higher mortality - Primary ST depression in V1-4 is
posterior OMI until proven otherwise, and may be associated with subtle
inferior and/or lateral changes - If the posterior leads from a 15 lead ECG
have no ST elevation, but the anterior leads show resolution of ST depression,
this can help confirm dynamic ischemic change - Subtle OMIs missed on the first ECG can
be identified on subsequent ECGs, including either progression of occlusive
findings or signs of resolution and reperfusion - Reperfusion T wave inversion (including
tall anterior T waves from posterior reperfusion) can be more obvious than the
initial signs of occlusion and can help confirm it - The STEMI/NSTEMI paradigm can miss the
entire progression from occlusion to reperfusion, and should be replaced with
OMI/NOMI - Never trust the automated interpretation,
including ‘normal’
References
- Meyers HP et al. Ischemic ST-segment
depression maximal in V1-V4 (versus V5-V6) of any amplitude is specific for
Occlusion Myocardial Infarction (versus nonocclusive ischemia). JAHA 2022 -
Grosmaitre P et al. Significance of
atypical symptoms for the diagnosis and management of myocardial infarction in
elderly patients admitted to emergency departments. Arch Cardiovasc Dis 2013 - Khan AR et al. Impact of total occluson of culprit artery in acute non-ST elevation myocardial infarction: a systemic review and meta-analysis. Eur Heart J 2017
- Driver BE, Shroff GR, Smith SW. Posterior reperfusion T-waves: Wellens’ syndrome of the posterior wall. Emerg Med J 2017;34(2):119–23. Available from: http://dx.doi.org/10.1136/emermed-2016-205852
![]()
===================================
MY Comment, by KEN GRAUER, MD (2/10/2022):
===================================
Superb post by Jesse McLaren — in which he traces the subtle but clearly-present evolution of acute Posterior OMI that was overlooked by health care providers. I’ll add a few thoughts to the progression figure drawn above by Dr. McLaren — which I reproduce in Figure-1.
- As per Dr. McLaren — this sequential look at anterior leads V1, V2 and V3 shows clear progression through the stages of acute occlusion — followed by normalization of ST-T wave changes — on the way toward development of those reperfusion T waves that confirm the diagnosis.
- As I’ve suggested on a number of occasions in Dr. Smith’s ECG Blog — I’ve found use of the Mirror Test to be extremely helpful in facilitating visualization of the ST-T wave changes characteristic of acute Posterior MI (See My Comment at the bottom of the page in the September 21, 2020 post).
- Doesn’t the Mirror Test faciliate appreciating the abnormal shape of the subtle shelf-like ST depression in lead V2 in the Occlusion tracing? (2nd Panel in Figure-1).
- Isn’t it easier to appreciate how the increased height and volume of the upright T waves in the 4th Panel in Figure-1 represent Reperfusion T waves?
- An additional Pearl to look for when considering the possibility of evolving posterior MI — is the relative height of anterior R waves (which in effect, reflect the mirror-image of evolving Q waves). Note how much taller the R wave is in lead V2 in the last 3 Panels in Figure-1.
- Finally — in addition to the voluminous reperfusion T wave in lead V2 of the 4th Panel — note how tall the T wave is in lead V1 of this Panel. You should never normally see a T wave this pronounced in lead V1.
Our THANKS again to Dr. McLaren for this superb presentation!
 |
| Figure-1: Clear progression in the stages of the acute posterior OMI in today’s case. |