|
This article discusses correction of the QT interval for rate. I’ve been working on this a long time, thought about submitting it to a journal, but decided it gets more readers on this blog. Specifically, we discuss the use of the “Half the QT” Rule of Thumb, a visual estimation method which declares the QT to be prolonged if the QT extends more than half the RR interval. We compare this method with the four most common QT correction formulas.
This is a detailed post, with interesting graphics produced and conceived by Ari B.Friedman, MD, Ph.D., now an EM resident at Beth Israel. The article is written by Dr. Smith and Dr. Friedman. Daniel Lee (HCMC 1st year resident) also did a bit of valuable editing.
Brief Summary of this post:
The QTc rule of thumb is this: If the QT interval is less than half the RR interval, then the corrected QT (QTc) is not prolonged.
We compare this rule to the 4 common formulas for correcting the QT. However, none of the formulas have proven to be definitively better than another and none are well correlated with outcomes or events!
1) At heart rates between 62 and 66 bpm, the rule of thumb is accurate. This makes sense, as at a heart rate of 60, the corrected QT is the same as the raw QT: a prolonged QT is around 500 ms, and at a rate of 60 bpm, the RR interval is 1000 ms (1 second).
2) At heart rates above 66 beats a minute, the rule of thumb is conservative; it overestimates the QT. In other words, if the QT is less than 1/2 the RR (QT non-prolonged) and the heart rate is above about 60
3) At heart rates below 60, far more caution is due. The rule of thumb is less
4) Computer algorithms are not accurate at QT measurement, especially if prolonged. Do not trust the computer if the QT looks at all prolonged. Measure it manually. 5) The “Half the QT” rule of thumb correction is linear: the QT is considered long if it is greater than 0.50 x the RR interval, a linear relationship. The QTc by this method = the raw QT divided by the RR interval and is long if the result is greater than 500 ms.
6) Use a different rule of thumb for bradycardia: Manually approximate both the QT and the RR interval. If the QT interval is less than 40% of the RR interval at 40 7) This last point may be generalized to all correction methods: it may be hazardous to correct the QT when the heart rate is below 60. Use correction primarily for heart rates above 60! Example ECG:
|
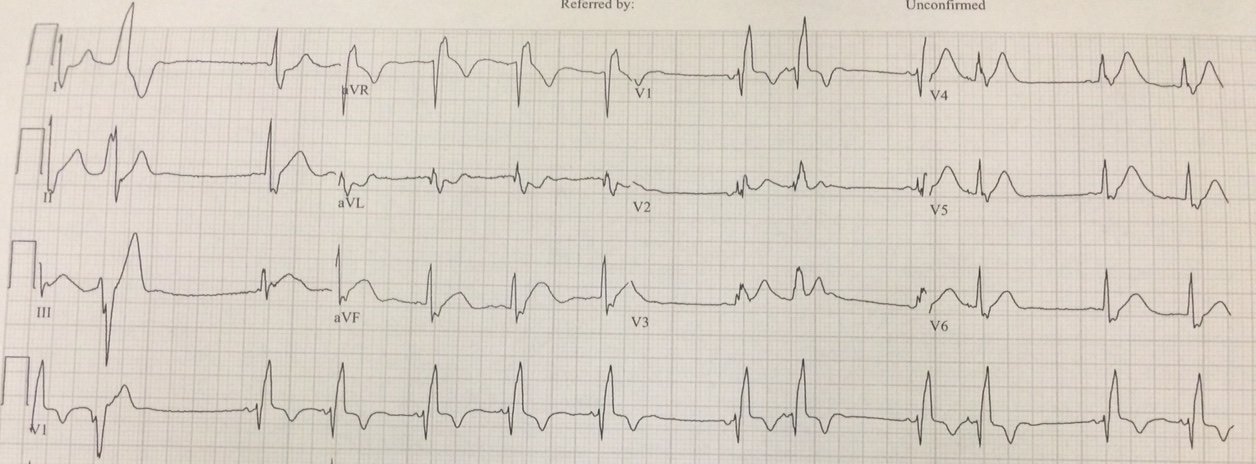
| The heart rate is 167; the RR interval is 0.36 ms
It is not easy to discern the end of the T-wave, as it is distorted by the P-wave. But the QT is definitely greater than half the RR interval. Thus, the rule of thumb says it is prolonged, but it overestimates the QT at high heart rates
How about by measurement? I (Smith) measure the QT at 320 ms The Bazett-corrected QTc is divided by square root of 0.36 which is 0.6 320 divided by 0.6 = 533 ms (dangerously prolonged) So is it really prolonged? How do we know? |
Answer: you must treat the patient’s underlying condition causing sinus tachycardia, and repeat the ECG at the lower heart rate.
Essential Reading:
Full text link:
AHA/ACCF/HRS Recommendations for the Standardization and Interpretation of the Electrocardiogram, Part IV: The ST Segment, T and U Waves, and the QT Interval (full text link).
—-The last sections of this article are on the QT interval and is essential reading :
Here are some pearls from this article before we get started:
1. The biggest issues with QT interval are:
a) Recognizing the onset of the QRS and end of the T-wave
b) Determining the appropriate leads to measure
c) Adjusting the QT for increases in QRS duration, gender, and heart rate
(For LBBB, Dodd and Smith propose using the T-peak to T-end interval, with a value > 85-100 ms being prolonged)
2. The longest QT of the 12 leads should be used. It is usually V2 or V3.
3. Do not measure the QT in any lead that is obscured, especially by a U-wave. Leads aVR and aVL are least likely to manifest U-waves.
4. It is essential to visually validate QT intervals reported by the computer algorithm, as it is frequently incorrect, especially when prolonged. See this review of computer interpreted ECGs.
5. Bazett and Fridericia corrections may be substantially in error, especially at high heart rates.
6. In particular, Bazett correction may produce falsely prolonged corrected QT at high heart rates
7. More recently introduced linear regression functions of the R-R interval are more accurate
8. Rate correction should not be used when RR interval has large variability, as in atrial fibrillation.
9. Prolonged QT is generally thought to be 450 ms for men, 460 ms for women.
10. Dangerously prolonged QT is 480, especially greater than 500 ms.
11. Abnormally short is less than 390 ms. They do not say which correction formula should be used when assessing these abnormally long or short QT intervals.
In that article, they do not say what is a dangerously short QT is (e.g. short QT syndrome, SQTS). However, according to these diagnostic criteria (JACC 2011; 57(7):802), it is a Bazett corrected QT of less than 330-370, depending on other diagnostic criteria, including 1) h/o cardiac arrest, 2) sudden syncope, 3) family hx of sudden unexplained arrest at age less than 40, 4) family hx of SQTS.
Some other points:
1. Different automated computer algorithms (different manufacturers) give different results
2. Automated algorithms often have their own proprietary methods of correction which they will not reveal.
3. Modern digital ECG
machines compute QT intervals using temporally aligned superimposed leads and choose the longest of the intervals,
meaning the computed QT will be longer than all but one single lead measurement. Values currently regarded as normal were
established at a time when older machines measured QT intervals via individual
leads, and these values likely do not correlate with modern computed QT
intervals.
·
Frederica’s
formula: QTc = QT / √3(RR) (QT divided by cube root of
RR interval)
·
Framingham
formula: QTc=QT+0.154*(1–RR)
·
Hodges
formula: QTc = QT + 1.75*(HR−60)
= QT + 105/RR − 105
Finally, a relatively new nomogram has been published and it may be the best way to determine, dichotomously, whether the QT is prolonged or not. Here it is:
 |
| If the combination of QT and Heart rate places your patient above the line, then the QT is prolonged. If the combination places the patient below the line, then it is not prolonged. Notice this nomogram, at heart rates under 60, does not result in the QTc being shorter than the QT! This again points out the danger in correcting at slow heart rates! The sensitivity and specificity of the QT nomogram were 96.9% (95%CI 93.9–99.9) and 98.7% (95%CI 96.8–100), respectively. For Bazett QTc = 440 ms, sensitivity and specificity were 98.5% (95%CI 96.3–100) and 66.7% (95%CI 58.6–74.7), respectively, whereas for Bazett QTc =500 ms they were 93.8% (95%CI 89.6–98.0) and 97.2% (95%CI 94.3–100), respectively. |
The rule-of-thumb
With that background in
mind, we can now turn to the commonly-used rule-of-thumb. The rule says that to estimate whether
the QT is prolonged, one must only determine whether the QT interval
occupies more than half the RR interval.
But does the
rule work, and under what circumstances should we worry that it gives us an
estimate that is too short or too long?
Ideally we would investigate by
comparing the rule-of-thumb to a gold standard formula or nomogram that was
carefully calibrated against a large database with mortality as the outcome.
Although the existing rules were not derived with
mortality outcomes, the Bazett correction was used to correlate long QTc with
outcomes in the studies cited above.
Instead, in this blog post
we will compare the rule-of-thumb to each of the four formulas, effectively
substituting usual care for the unattainable gold-standard of outcomes.
Comparing the rule-of-thumb to the formulas
To assess agreement between our rules, we examine QT intervals from 300 ms to 1000 ms, and RR intervals from 350 ms to 1500 ms. We are not using any human or patient data; we are only comparing the rule-of-thumb to various formulas, which may or may not be correspondingly validated by health data (the risk of sudden cardiac death, for instance).
Figure 1. Here we can compare the different formulas, using a cutoff of 480 ms
to determine when the QTc is prolonged. The formula named “Half” is the
rule-of-thumb that the QT is prolonged if the QT interval extends more
than half the RR interval.

Already, we see divergence between the rules. One can see here that the rule-of-thumb indicates a prolonged QTc for any QT of 300 ms or longer if the RR interval is less than 0.6 (HR greater than 100). This contrasts with the formulas, which can have a QTc within normal limits in such cases.
Importantly, compared with the formulas, at high heart rates (low RR), the half-the-RR rule of thumb tends to label too many QT’s as abnormal. At low heart rates (high RR), the rule of thumb tends to label too many as normal.
Here is another way of looking at it:
We can make the same graph, but with QT shown as a percentage of RR, and plotting either RR or HR on the x-axis.
Figure 2. Here we plot RR on the x-axis:

You can also see clearly that in all the other formulas: 1) There are many situations in which the QT is more than half the RR, yet the QTc is normal according to the formula. 2) Conversely, there are many situations in which the QT is less than half the RR, yet it is prolonged according to the formula.
Figure 3. Here we plot HR (instead of RR) on the x-axis:

Putting the percentage on the Y axis demonstrates the
impossibility of a perfect formula based on a percentage: if we move
that horizontal line up (by increasing the % of the RR that is
considered prolonged up from 50%), the test will be more sensitive for a prolonged QT (fewer false negatives) at the expense of more false positives (classifying more QT-RR pairs as prolonged when they are within normal limits according to the formulas). For normal heart rates, from 60-90, many QT intervals which are prolonged using the formulas are NOT prolonged by the rule of thumb.
Without knowing health outcomes, it is impossible to accurately weight the
misses vs. the over-calls; one cannot determine what the right
cutoff should be. A receiver operating
characteristic graph over all the different percentage cutoffs might
help more formally make those tradeoffs. Also, note that it is possible to derive a formula that indicates when each formula disagrees with the rule-of-thumb, but doing it graphically is more informative, so that is the approach taken here.
Rules-of-thumb (RoT) for when the rule-of-thumb is suspect
Figure 4. It does seem like there is an area where the rule-of-thumb seems
particularly good. Where’s the transition point?
To
examine where they agree and disagree, we’ll re-plot in three columns:
1. The
left column shows where the rule-of-thumb is prolonged.
2. The
middle column shows where each formula is prolonged.
3.
The right column shows the areas where they disagree.
We will plot the four formulas, with HR on the X-axis, and QT in percent of RR terms on the Y-axis. Click on the image to see it full size.

There’s
a narrow band of heart rates in which it’s impossible to go wrong. Above or
below that, agreement has its trouble spots.
Below 62 bpm, the rule-of-thumb failed to note prolonged QT as
indicated by all four formulas. This is in spite of the fact that a
long QT is most dangerous in bradycardia.
At a heart rate of 40 bpm or less, for instance, all 4 formulas all declare a
QT lasting just 40% of the RR to be prolonged. By contrast, above 66 bpm, the
rule-of-thumb was overly conservative. At 96 bpm, all four rules consider a QT
stretching 60% of the RR interval to be normal.
Conclusion
We might think about two reasons to be concerned with prolonged QT intervals in the ED. The first is to take appropriate measures to prevent the acute risk of progression to TdP; the second is to avoid discharging someone who could be identified as being at risk of sudden death.
As a screening tool at normal heart rates, there is good agreement between the major formulas and the rule of thumb. Since the rule-of-thumb is conservative at higher heart rates, and the risk of TdP is also lower at higher heart rates, a lack of QTc prolongation by the rule-of-thumb should be reassuring.
On the other hand, the rule-of-thumb in bradycardia is prone to false negatives and probably should not be used at these lower heart rates. Interestingly, Bazett’s formula, which is the most commonly used in online calculators and in EKG machines, is the least conservative at these low heart rates (i.e., it is the most likely formula to show QTc less than 480 at low heart rates, in spite of its reputation for undercorrection). Thus, a borderline QTc in the context of bradycardia may be less re-assuring than with other formulas.
Additionally, computer algorithms are not accurate (
When the QT appears to be long to the naked eye, it must be hand measured, regardless of what the computer measures.
Sensitivity/Specificity and the ROC curve
Another way to examine this issue is to approach it as though we had to choose our own percentage from scratch. Rather than starting with 50% (half the RR) as the rule-of-thumb, we will calculate agreement between the various rules and a whole spectrum of rules-of-thumb, each with a different cutoff.
Note that these measures depend on the population values, and since we have arbitrarily generated a population of values, this analysis is inherently problematic. Still, absent data on how prevalent RR and QT pairs are in the ED, it’s hard to do better.
Plotting the Receiver Operating Characteristic (ROC) curve compared to each formula as the gold standard, and labeling the cutoffs (i.e. 50 represents the half-the-QT rule-of-thumb), we see that half the QT was not an unreasonable choice compared to 40% or 60% of the QT. It performs particulary well when evaluated by the Bazett formula; unfortunately, by many measures (see literature above), the Bazett formula may be the least accurate in identifying QT risk.


Note that these measures depend on the population values, and since we have arbitrarily generated a population of values, this analysis is inherently problematic. Still, absent data on how prevalent RR and QT pairs are in the ED, it’s hard to do better.
How about the corrected QT interval in bundle branch block?
An article published by Dr. Ken Dodd and Dr. Stephen W. Smith published in the International Journal of Cardiology suggests that the T-peak-to-T-end (TpTe) interval is the best measure of a prolonged QT. They did not correct for rate in this article. It is likely that this applies to other intraventricular conduction delay and also to RBBB. An prolonged QT is longer than 85 ms – 100 ms in BBB.
Dodd KW et al. Among patients with left bundle branch block, T-wave peak to T-wave end time is prolonged in the presence of acute coronary occlusion. June 2016; 236:1-4
This article has a nice discussion of drugs that cause QT prolongation
Emergency department approach to QTc prolongation
See these cases for examples of computer mismeasurement of the QT interval:
Chest Pain and a Very Abnormal ECG
Syncope and Bradycardia
Long QT: Do not trust the computerized QT interval when the QT is long
See this case of Polymorphic VT from acquired long QT: