Dr. Smith's ECG Blog

Instructive ECGs in Emergency Medicine Clinical Content

Associate Editors:
— Pendell Meyers & Ken Grauer (2018)
— Jesse McLaren & Emre Aslanger (2022)
— Willy Frick (2024)

editors

Right Bundle Branch Block with ST Elevation in V1?

There is a wide QRS with a tall R-wave in aVR and V1 and wide S-wave in lateral leads, leading one to believe this is RBBB.  There is ST elevation in V1, and ST depression in V4-V6, suggestive of ischemia/MI.   What is the Diagnosis? –see Below


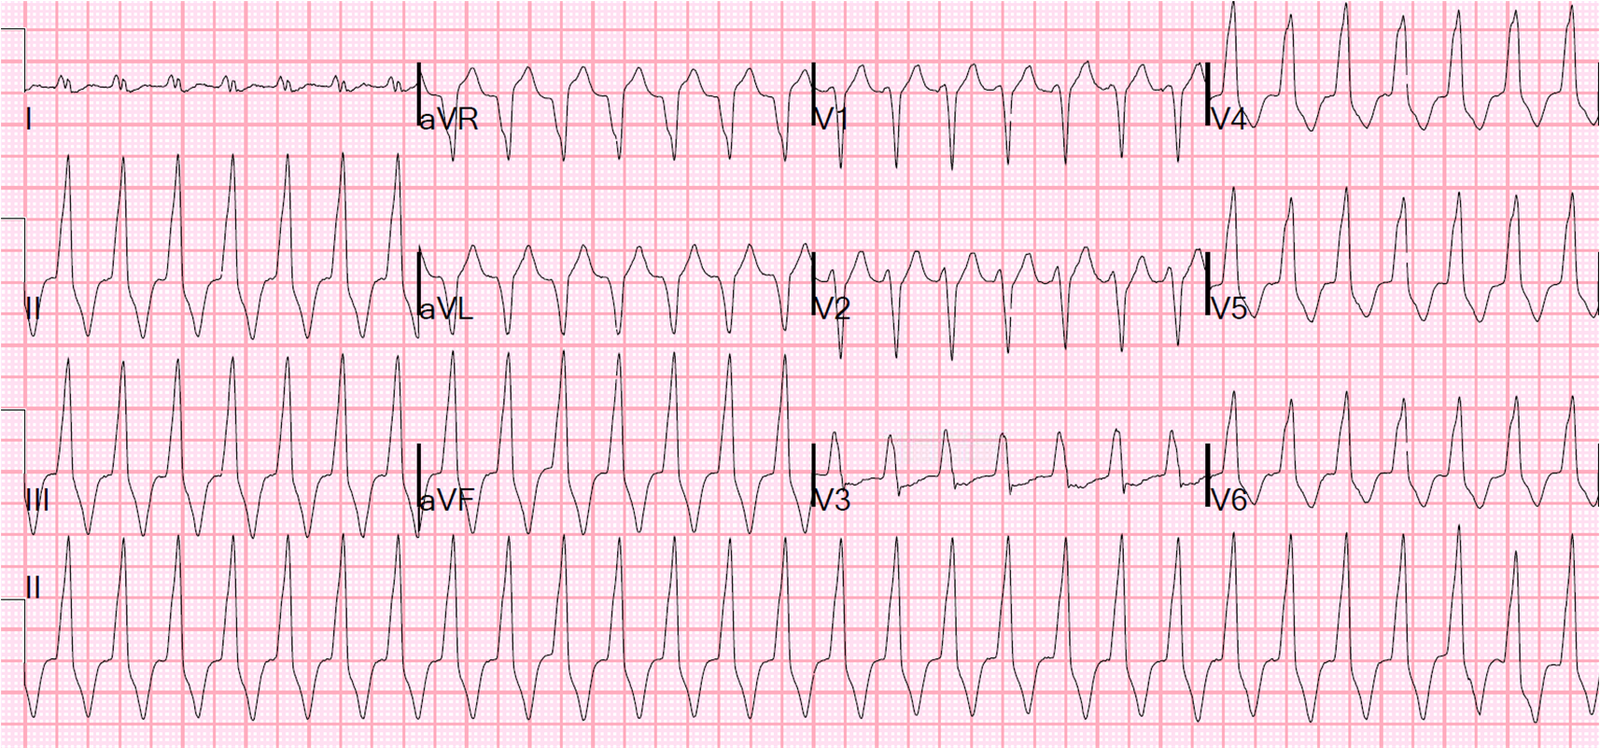
This is a classic pseudoinfarction pattern — hyperkalemia, with K of 6.9 due to DKA (pH 7.12, bicarb 6).  In this case the diagnosis was easy because the patient presented very ill with known Type I diabetes and with vomiting, not chest pain.

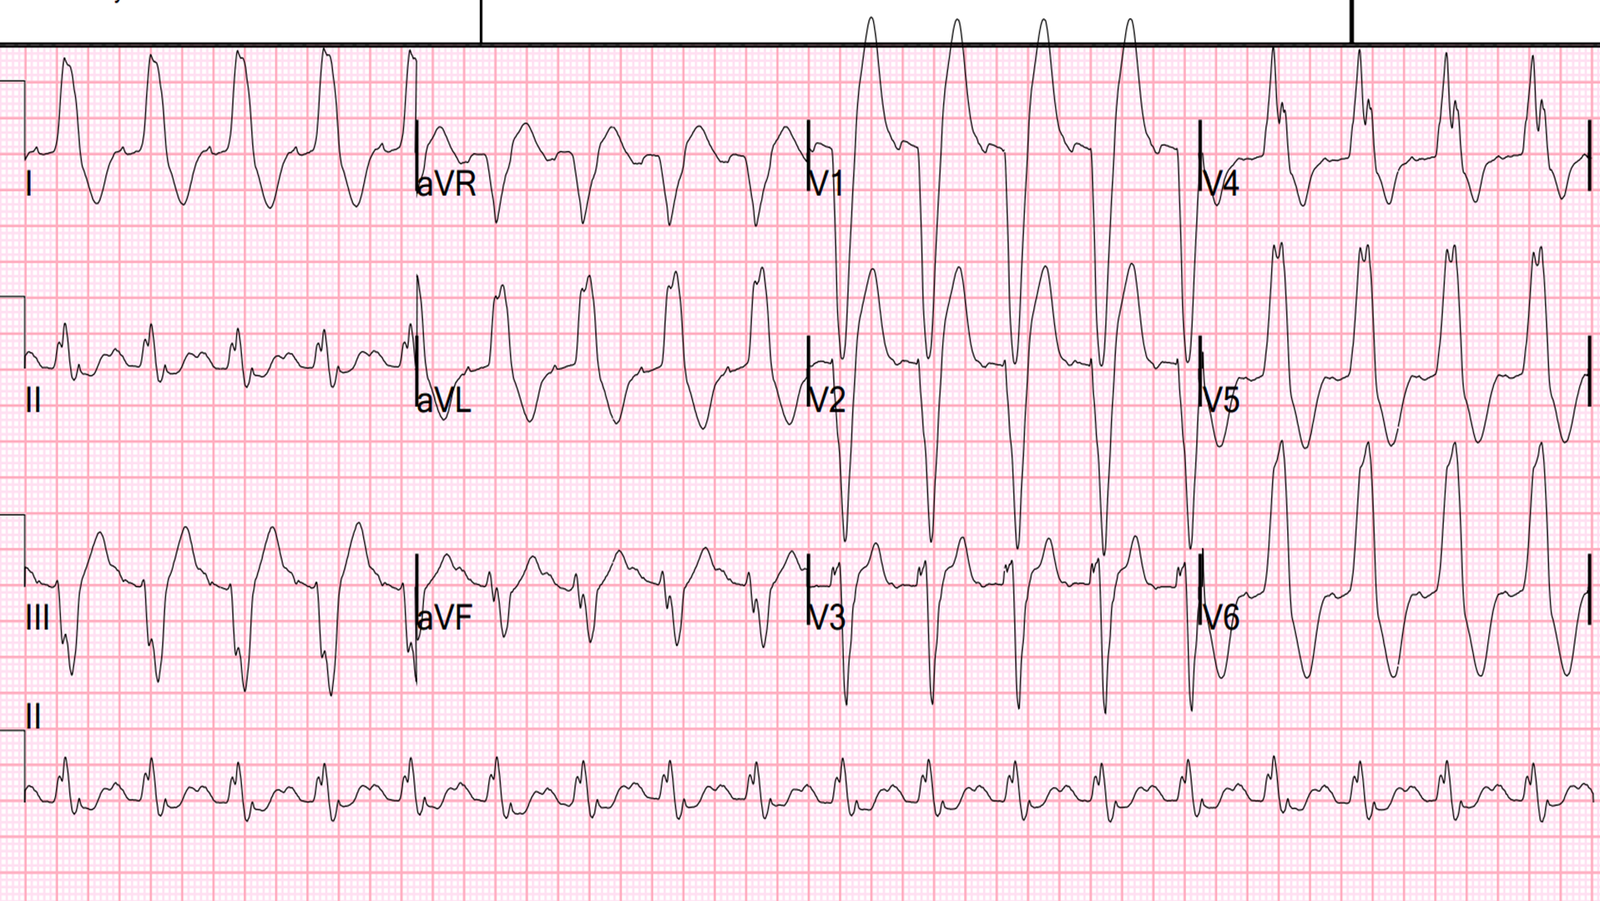
However, here are two from my files that presented with chest pain:

The peaked T-waves give it away, but the ST elevation in V1 and V2 is a little known pseudoinfarction pattern.  There was no MI here.
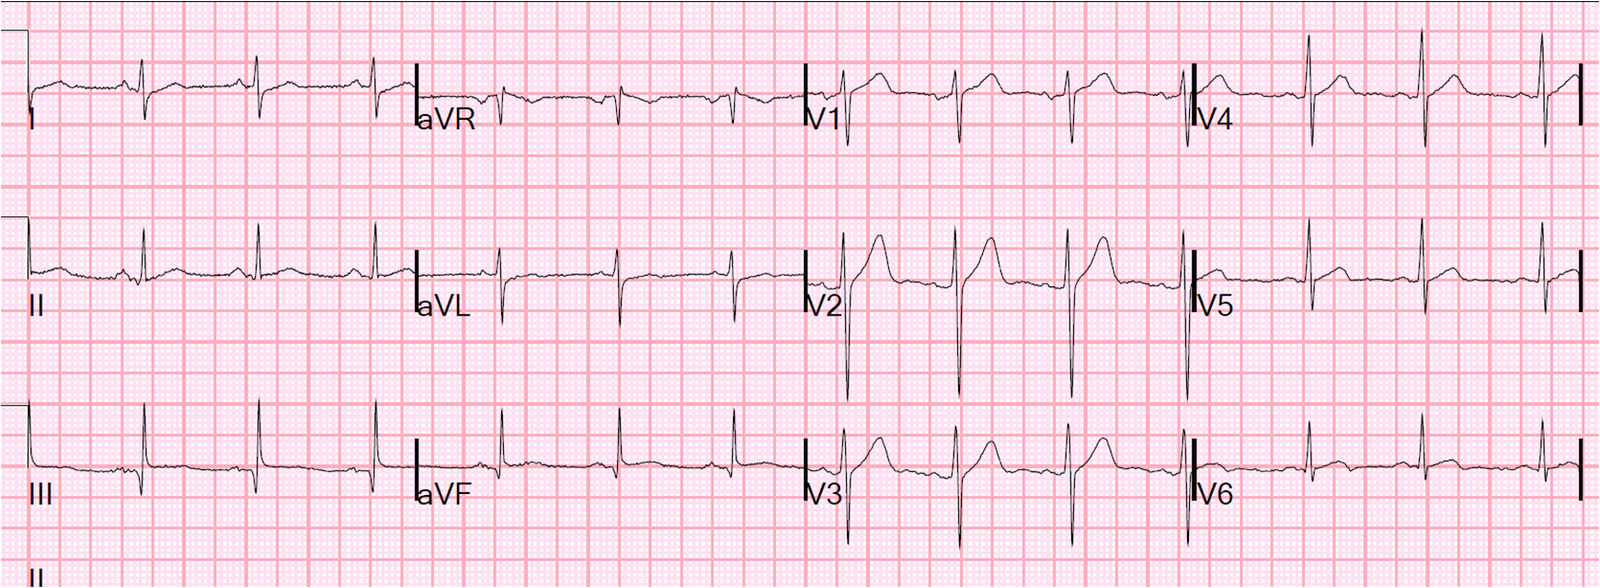
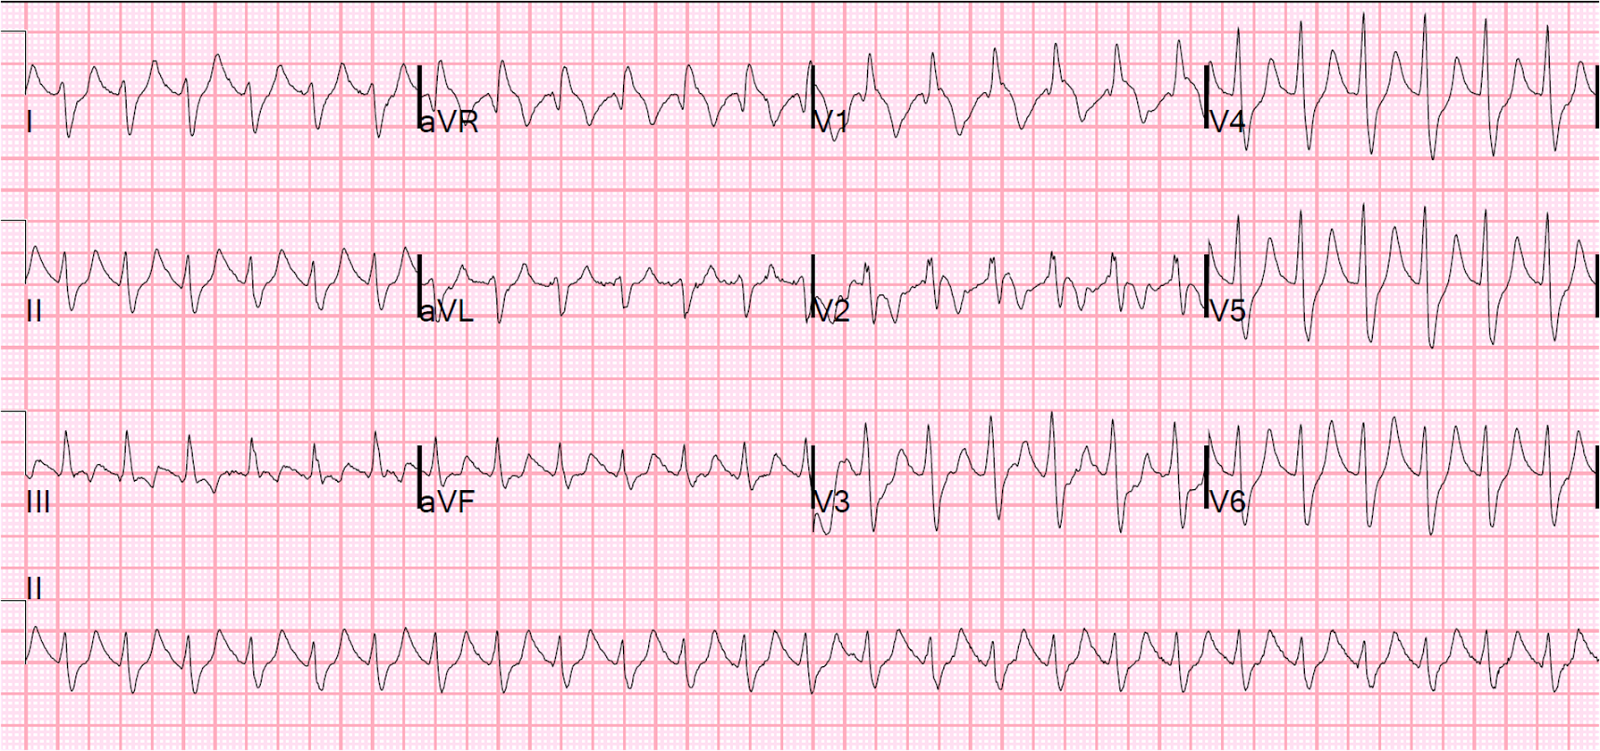
Thanks to K. Wang for this EKG.  Again, there was no MI, only hyperkalemia.

In all 3 of these cases, the findings disappeared with treatment of hyperkalemia, and the ECG normalized.

Previous Article

Heart rate of 230 beats per minute

Next Article

Regular Wide Complex Tachycardia. What is the Diagnosis?

View Comments (8)
    1. Well, it' embarrassing that I did not comment on that. It is sinus tach. The little bump just at the end of the large R-wave in V1 is a p-wave. The baseline ECG has an identical upright p-wave. Also, his rate gradually declined with therapy. Without that extra information, however, it would be a difficult diagnosis because it is hard to find a corresponding p-wave in lead II. On the other hand, I also can't find a pattern that would be fully consistent with flutter.

      Thanks for the great question.

      Steve Smith

  1. Dear Dr. Smith!

    I also wonder what the rhythm is. As you wrote gradual decline of the rate suggests sinus tachycardia.
    But as I looked carefully the ECG I found waves that are suspicious of being P waves.
    I marked them on this:

    http://kepfeltoltes.hu/130203/EKG_www.kepfeltoltes.hu_.png

    If they are P waves they do not seem to be linked to the QRS complexes, so I think there is AV dissociation, which is theoretically possible in supraventricular tachycardias that arise in the AV junction.
    And as far as I know there are nonparoxysmal junctional tachycardias in which the frequency gradually rise and decline.

    To have a much more complicated case there seem to be flutter waves in lead III…

    What is your opinion about this, Dr. Smith? Are they only artifacts?

    Thanks for your answer!

    1. Marton, you may be right, but the p-waves you have marked out are very irregular, so I don't think so. I see what you mean about lead III, but, again, I don't think so: they should be more evident in lead II. Cannot say for certain.

      thanks!

      Steve Smith

  2. Steve, On the FIRST eKG: How do you know that the RATE (or electrolyte derangement) didn't precipitate a RBBB? Not only is the QRS wide, but there is right axis deviation. Also when I march out the end of the QRS complex it to me doesn't look like ST elevation or depression in the precordial leads, but just the end of the complex. I agree the second 2 eKGS are pretty cool!

    1. El,
      Great question, which I had to think about for a moment: we know it's not RBBB because the r and S of rSR" in RBBB should both be narrow, and here they are both wide. So this is not just a rate-related RBBB + hyperK, but hyperK alone.
      Steve

Leave a Comment

Your email address will not be published. Required fields are marked *