Written by Jesse McLaren
Two patients
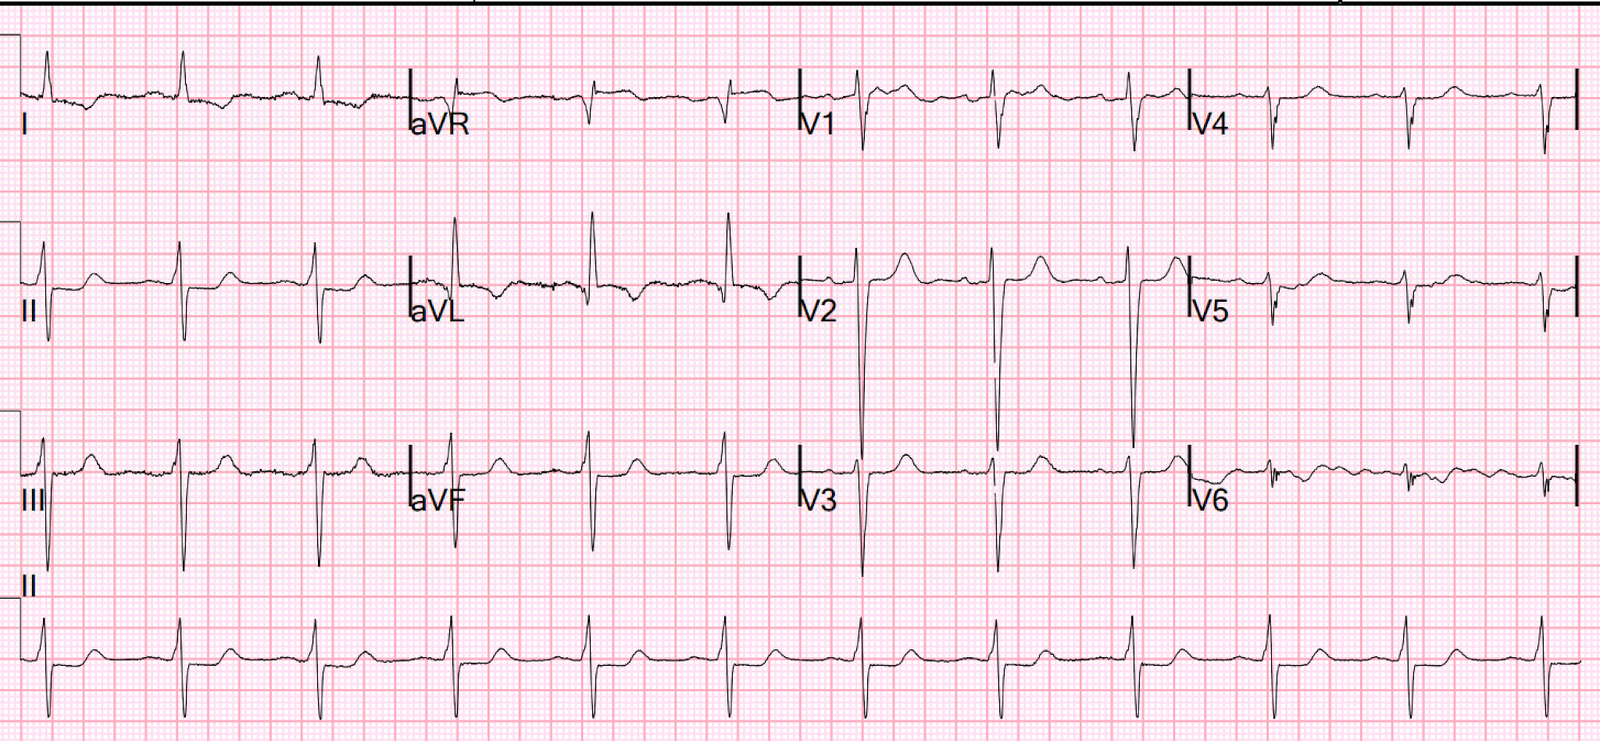
presented with acute chest pain, and below are the precordial leads V1-6 for
each. Patient 1 (ECG on the left) was a 45 year-old male, and patient 2 (ECG is
on the right) was a 70 year-old male. The limb leads have been removed because
there was no ST elevation in those leads, the QRS complexes have been
obscured because this is irrelevant to STEMI criteria, and red lines have been added to measure ST segment elevation.
Using the
current paradigm, can you tell which patient had an acute coronary occlusion? Using
T wave amplitude, can you tell which ECG has hyperacute T waves? What other parts
of the ECG would you like to see, and how will you use this to refine your
interpretation?
Patient 1 Patient 2
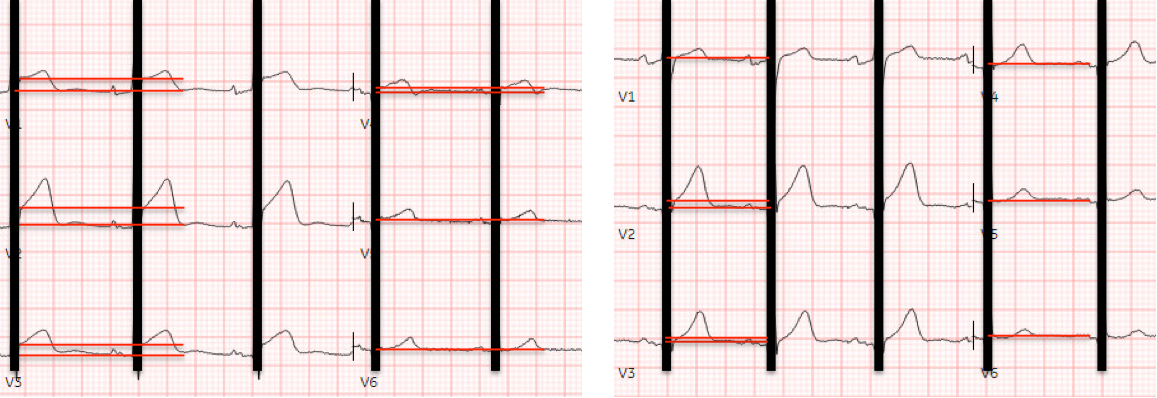
STEMI criteria
is based only ST elevation millimeter criteria measured in isolation from the QRS
and stratified by age/sex, so this is the only information provided above. Based
on age/sex, STEMI criteria for both patients is ST elevation in 2 contiguous
leads of 2mm in V2-3 and 1mm in all other leads.
You have all the
information you need to apply STEMI criteria: the ECG on the left is STEMI
positive and the ECG on the right in STEMI negative. So based on the current
paradigm, the cath lab should be activated for the patient on the left but not
the patient on the right. If you look at T wave amplitude in isolation, both
ECGs have similar sized T waves, so this doesn’t seem to help at
differentiating these ECGs.
STEMI vs OMI
Now let’s see the
rest of the ECG: can you tell which patient has an acute coronary occlusion,
and which ECG has hyperacute T waves?
Patient 1 (from top
ECG on the left): what do you think?

Now that we can
see the QRS we notice large voltages, spilling off the page in V4, with
proportional ST/T waves. Smith showed that LAD occlusion and normal variants
can have similar ST elevation and T wave amplitude, but what distinguishes them
is the QRS in V2, R wave in V4 and QT interval [1] – all of which are
reassuring here.
But STEMI
criteria ignore all this and look at ST segments in isolation. The initial
computer and final cardiology interpretation was a differential: “ST elevation,
consider early repolarization, pericarditis, or injury.” Based on STEMI
criteria and unhelpful computer interpretation, the patient was rushed to the
cath lab. But coronaries were normal, serial troponin was normal, CT chest was normal,
and the patient was discharged.
Patient 2 (from
top ECG on the right): what do you think?

Looking at the
QRS, we see small Q waves in V2-3 and loss of R wave in V3 – which excludes
normal variant. The QRS amplitude in V2 and R wave in V4 are much smaller than
the ECG above, which makes the anterior ST elevation more concerning. And relative
with the QRS in V2-3, the T waves are massive. This is enough to diagnose LAD
occlusion, but looking at the rest of the ECG we also see down/up ST segment in
III reciprocal to a hint of ST elevation in aVL – which localizes the occlusion
to the proximal LAD.
But the initial
computer interpretation was “normal ECG”,
which was signed off by a physician, so the patient stayed in the waiting room.
Fortunately their first troponin was elevated at 97ng/L (normal <26 in
males) so the patient was brought into a room for a repeat ECG:

Now there’s a
full Q wave in V2 but the T waves have deflated, suggesting some reperfusion at the time of the ECG. The cath lab was activated and
found a 100% LAD occlusion, with peak troponin I 8227 ng/L. This case was one of
the 4% of true positive Code STEMI with an initial ECG labeled ‘normal’ by
computer interpretation,[2] and there are dozens more such cases detailed here.
The discharge
ECG showed ongoing loss of R wave in V2, and anterolateral reperfusion T wave inversion:

STEMI computer interpretation vs OMI AI
Comparing the
two ECGs including the QRS, the ST elevation on the left is greater but this is proportional to
large voltages. The amplitude of T waves is similar, but relative to their
respective QRS the T waves on the left are normal and those on the right are
hyperacute. That’s why the key to assessing hyperacute T waves is
proportionality relative to the QRS.[3]
Patient 2 Patient 2

The STEMI
paradigm, and the computer interpretations based on it, only look at ST
segments and measure it in isolation from the QRS. Not surprisingly, this leads
to high rates of false positives and false negatives. ECG signs of OMI –
including looking at the ECG in totality and assessing ST segments and T waves
based on proportionality – are much more accurate [4] and have been taught to
AI.[5]
I sent the first
ECGs from each patient to the Queen of Hearts:
Patient 1 Patient 2

So the Queen was
highly confident that the ‘STEMI positive’ ECG was Not OMI, and highly
confident that the ‘normal’ ECG was OMI. This could have prevented an unnecessary
cath lab activation for the first patient with normal coronaries, and
accelerated cath lab activation for the second patient with an LAD occlusion.
YOU TOO CAN HAVE THE PM Cardio AI BOT!! (THE PM CARDIO OMI AI APP)
If you want this bot to help you make the early diagnosis of OMI and save your patient and his/her myocardium, you can sign up to get an early beta version of the bot here.
Here you will sign up for the Queen of Hearts on the Telegram app:
https://share-eu1.hsforms.com/18cAH0ZK0RoiVG3RjC5dYdwfyfsg
Or, you can get the PM Cardio app with Queen of Hearts function through this QR code.
When you register on the app, you need to say you are from a supported country in the EU. You will get 5 free reports. After that, it is $30 per month.

Take away
1.
STEMI
criteria only look at ST segments and measure them in isolation from the QRS, which
leads to high rates of false positives and false negatives
2.
ECG signs of OMI include looking at the ECG in totality (including acute Q waves, loss of R waves,
reciprocal ST depression, subtle ST elevation, and hyperacute T waves), and with assessing ST/T relative to QRS
3.
Conventional
computer interpretations are unreliable (including those labeled ‘normal’), but
expert-trained AI is much more accurate
References
1.
Driver
et al. A new 4-variable formula to differentiate normal variant ST segment
elevation in V2-V4 (early repolarization) from subtle left anterior descending
coronary occlusion – adding QRS amplitude of V2 improves the model. J
Electrocardiol 2017
2.
McLaren,
Meyers, Smith and Chartier. Emergency department Code STEMI patients with
initial electrocardiogram labeled ‘normal’ by computer interpretation: a 7-year
retrospective review. Acad Emerg Med 2023
3.
Smith,
Meyers. Hyperacute T waves can be a useful sign of occlusion myocardial
infarction if appropriately defined. Ann Emerg Med 2023
4.
Meyers,
Bracey et al. Accuracy of OMI ECG findings versus STEMI criteria for diagnosis
of acute coronary occlusion myocardial infarction. IJC Heart and Vasc 2021
5. Herman,
Meyers, Smith et al. International evaluation of an artificial
intelligence-powered electrocardiogram model detecting acute coronary occlusion
myocardial infarction. Eur Heart J Dig Health 2023
![]()
===================================
MY Comment, by KEN GRAUER, MD (1/17/2024):
===================================
Today’s post by Dr. McLaren once again emphasizes the importance of “proportionality” — for assessing the clinical significance of ST-T wave appearance in a patient who presents with CP (Chest Pain).
- While fully agreeing with the KEY concept conveyed by Dr. McLaren (namely, that literal usage of the still all-too-commonly-accepted “STEMI Paradigm” results in far too many erroneous diagnoses) — I’ll suggest an additional perspective on how I consider these ideas.
My perspective employs recollection of one or more of the following short phrases that may serve as “ECG Mantras” ( = clinical reminders) of these KEY principles. These phrases include:
- “Are there 1 or 2 of the 12 leads that give you the answer”
- “Shape more important than amount.”
- “Neighboring leads? — and the rest of the ECG!”
- “Can you explain all the findings?”
The CHALLENGE:
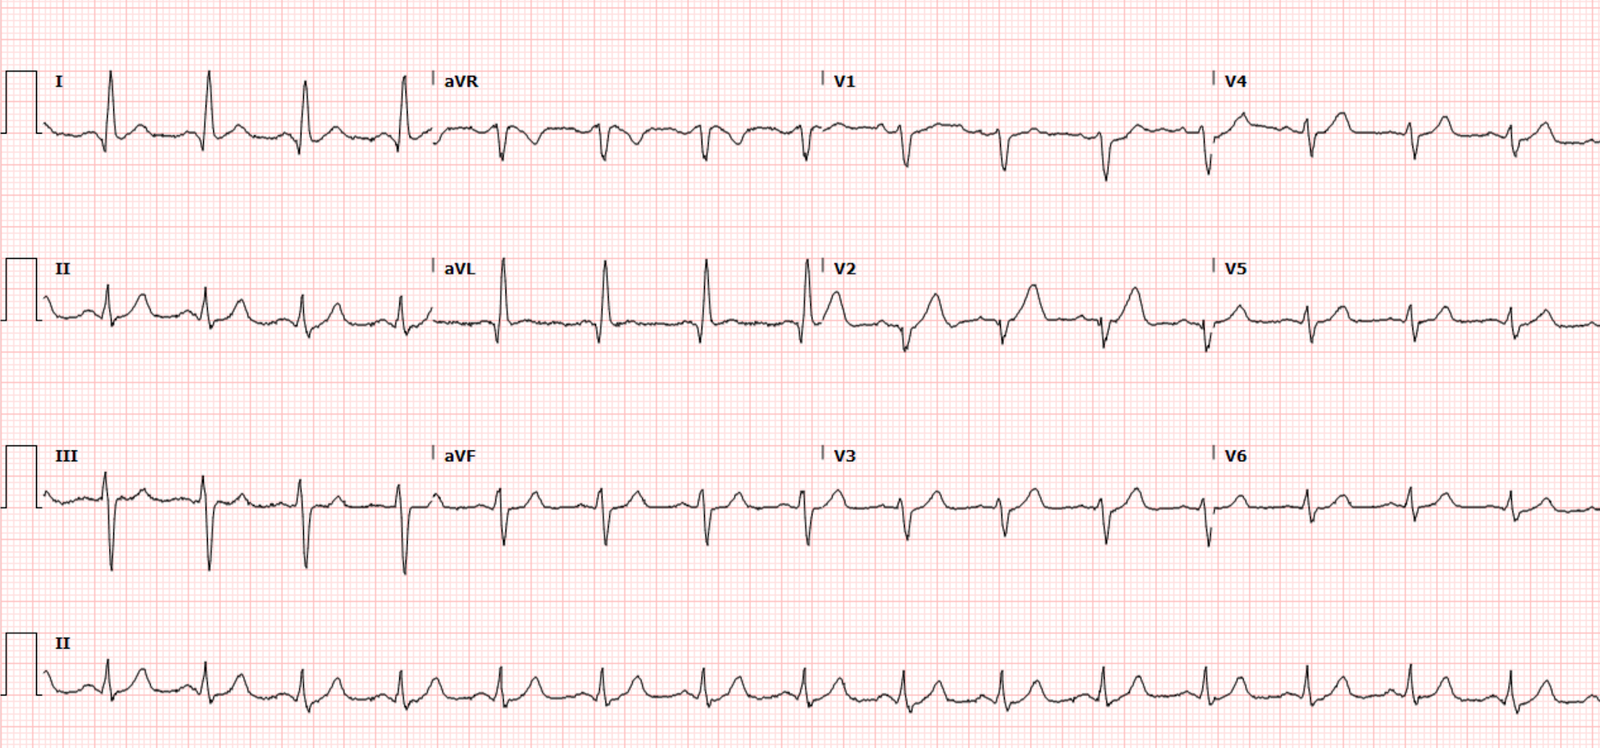
I’ll expand on these ECG Mantras momentarily — but FIRST — Take another LOOK at the 2 initial ECGs in today’s case, that for clarity — I have put together in Figure-1:
- HOW might one or more of the above ECG Mantras apply to the 2 ECGs in Figure-1?
 |
| Figure 1 – I’ve labeled the initial ECGs on Patient-1 and Patient-2. |
==================================
Application of the above ECG Mantras: Given the presentation of new-onset CP for both patients in today’s Blog post — time-efficiency for determining the need for prompt cath is essential for optimal outcome.
==================================
Are there 1 or 2 Leads that give you the answer?
- “Armed” with the knowledge that Patient-2 was a 70yo man with new CP — it literally took me less than 5 seconds to know that prompt cath was indicated. My “eye” immediately focused on the 2 leads within the RED rectangle in ECG #2. As per Dr. McLaren — the hyperacute T waves in leads V2 and V3 are massive ( = equal or exceeding the height of the R wave in the same lead — with T waves “fatter”-at-their-peak and wider-at-their-base than expected given QRS amplitudes in V2,V3).
- So, as soon as I saw the ST-T waves in leads V2,V3 of ECG #2 — I knew that prompt cath with PCI for this acute OMI was needed. Assessment of ECG findings in other leads supported my assessment — but these 2 leads were all that I needed for “the Answer”.
- With regard to Patient-1 — Assessment of the QRST complex within the RED rectangle once again immediately suggested the answer to me. This is because QRS amplitude in lead V4 is huge — in association with a relatively short QTc — J-point notching (the BLUE arrow in this lead) — and the very characteristic ST segment “face” of a repolarization variant, with benign-looking terminal T wave inversion (See My Comment at the bottom of the page in the May 19, 2022 post in Dr. Smith’s ECG Blog).
Shape More Important than Amount!
This ECG Mantra regarding the shape of ST-T wave deflections — incorporates the concept of “proportionality” (since a “normal” ST-T wave shape is dependent on relative size with respect to the QRS complex in the lead being looked at). In addition — small ST-T wave deflections of an abnormal shape may prove to be more important than a certain amount of ST segment deviation.
- To Emphasize — that while I completely agree with Dr. McLaren that ECG #1 is almost certain to represent a repolarization variant and not an OMI — my “eye” could not help but notice the abnormal shape of the straightened ST segment takeoff in leads V1,V2,V3 (straightened RED lines in these leads). Normally, there should be gentle upsloping (rather than straightening) of ST segments in these anterior leads. So while I strongly favored the conclusion of “not an OMI” in this 45yo man who most probably has LVH and a repolarization variant — I felt the shape of the elevated and abnormally straightened ST segments in 3 consecutive anterior leads merited additional information before I could be 100% convinced that ECG #1 did not represent a superimposed acute change.
- Another example on the role of shape is also evident in ECG #2 — in the form of T-QRS-D (Terminal QRS Distortion) — if not in lead V2 (where the truncated s wave almost reaches the baseline) — then in lead V4 (See My Comment and illustration of T-QRS-D in the November 14, 2019 post of Dr. Smith’s ECG Blog).
Neighboring Leads? — and the Rest of the ECG!
- I’ve highlighted above how one look at lead V4 in ECG #1 — strongly suggested probable LVH and a repolarization variant (and not an OMI). I next apply the concept that the more leads showing similar findings in the same anatomic area — the greater the likelihood that your impression is accurate. Thus, my impression of probable LVH in a patient with a repolarization variant is strengthened by the J-point notching in neighboring leads (BLUE arrows not only in lead V4 — but also in leads V5,V6 of ECG #1) — as well as by the very tall R waves in leads V5,V6.
- In ECG #2 — I’ve highlighted how one look at the 2 leads within the RED rectangle in ECG #2 was enough to convince me of the need for prompt cath. The suggestion of T-QRS-D in neighboring lead V4 provides further support (BLUE arrow showing failure of the s wave in V4 to descend to the baseline).
- In this context — loss of r wave from lead V1, with resultant small-but-significant q waves in not only leads V2,V3 — but also in neighboring leads V4,V5,V6 is significant (ie, Septal q waves may normally be seen in leads V4,V5,V6 — but they should not be seen as far anterior as leads V2,V3 — and the Q wave in lead V2 should not be larger than the q wave in leads V5,V6).
- As per Dr. McLaren — the Rest of ECG #2 is consistent with an LAD OMI, in that there is a subtle hyperacute (if not slightly elevated) ST segment in lead aVL — as well as subtle reciprocal changes in inferior leads III (depressed ST segment shape with down-up terminal T wave) and aVF (flattened ST segment).
Can you Explain all the Findings?
While our 1st priority in assessing the patient with new CP is to determine if prompt cath is needed — if we see no indication of OMI, but the ECG is not “normal” — I like to look for a reason WHY the ECG is not normal (ie, Could the patient’s CP be the result of a tachyarrhythmia or pulmonary embolism?).
- For example, in today’s case — Cardiac cath performed on Patient-1 was normal, and acute OMI was ruled out. But ECG #1 is not “normal”. Instead — there is significant increase in voltage for a 45yo man — with tall initial R waves in leads V1,V2 (7 mm in lead V1 and 15 mm already by lead V2!). These ECG findings could be consistent with HCM (Hypertrophic CardioMyopathy) — which could be responsible for this patient’s CP. [Presumably — significant HCM if present, would have been seen on cath — but the point is that the BEST way to feel totally comfortable with your interpretation — is when you can explain all abnormal findings].
===========================
Today’s “Take-Home“
Among the lessons to be learned from today’s case are a number of KEY concepts that aren’t found in textbooks. These include:
- Applying proportionality in your assessment (Failure to account for such proportionality is one of the major reasons for failure of the STEMI paradigm).
- Appreciation of shape rather than a certain millimeter amount of ST segment deviation.
- Looking for 1 or 2 leads that can instantly give you the answer — and then looking at neighboring leads to further support your answer.
- Trying to understand abnormal ECG findings, even if you don’t think it’s an OMI.