Case submitted by Anonymous, written by Pendell Meyers
A man in his 50s with history only smoking presented to the ED with chest pressure for the past 2 hours. His vitals were within normal limits except BP 163/109.
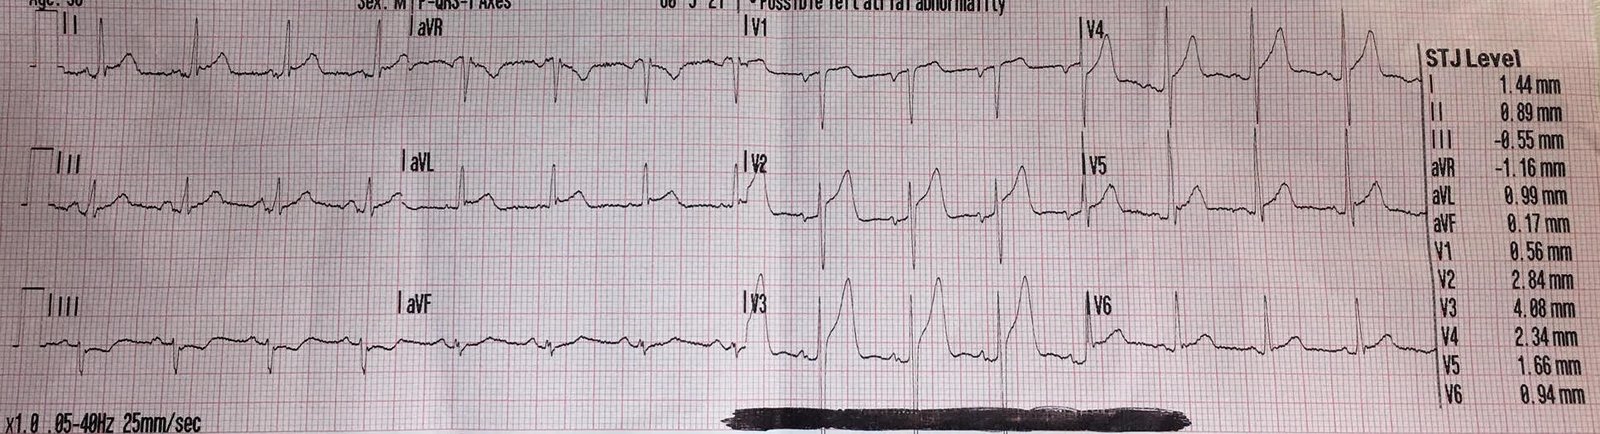
No prior ECG was available. Here is his triage ECG:
 |
| What do you think? This is probably obvious to regular readers of this blog, but it is NOT obvious to most emergency providers and cardiologists. |
Findings include:
– Sinus rhythm
– Normal QRS complex
– Hyperacute T waves in leads II, III, and aVF
– reciprocal STD and T wave inversion in aVL
– STD in V2-V4 (max in V3)
– Likely hyperacute T waves in V5 and V6 as well
Interpretation: diagnostic for inferoposterolateral STEMI(-) OMI. There is always a small possibility of takotsubo or myocarditis, but this ECG is OMI until proven otherwise.
In our most important upcoming study, we are about to show that ECG experts are superior to simple STEMI criteria. We found that at least one of 7 key ECG findings were documented in the vast majority of cases where the expert outperformed the STEMI criteria. This case has at least three of these findings: hyperacute T waves, STE/hyperacute T waves in inferior leads with any STD/TWI in aVL, and STD max in V2-V4.
The triage ECG was brought back to the ED physician immediately for review. The ED physician recognized this pattern and called a “heart alert” (this allows immediate cath consult via phone consultation and review of the ECG between EM and Cardiology).
Aspirin and heparin were given. Cardiology came immediately to evaluate the patient.
The cardiology team was not convinced of ACS and required that the patient be negative for Covid before further consideration of emergent cath would be entertained (reasoning unclear). So the swab was sent as rapidly as possible.
The first contemporary troponin T resulted undetectable, less than 0.01 ng/mL.
The second troponin T resulted elevated at 0.13 ng/mL (around 6pm, roughly 3 hours after arrival).
The rapid Covid swab returned negative, but by this time the patient was already admitted to cardiology who had no plans for emergent cath despite rising troponin (reasoning unclear).
 |
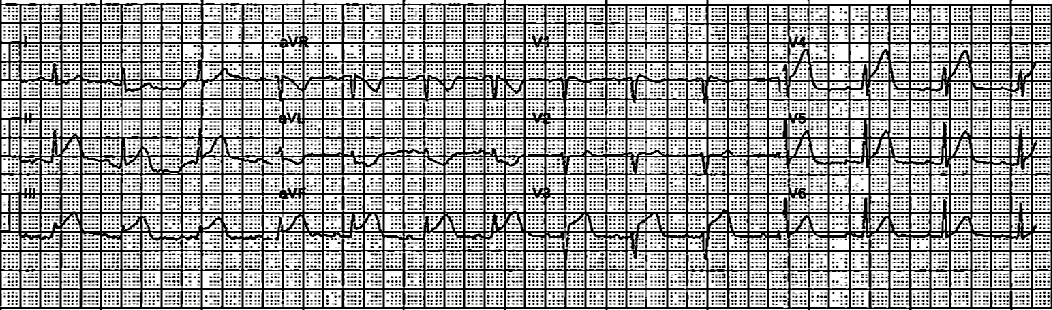
| This ECG was done just before the patient went upstairs to the cardiology floor. It shows continued active OMI of the inferior, posterior, and lateral walls. |
Troponin at 9pm resulted at 4.74 ng/mL. This is a very high troponin T, roughly equivalent to a troponin I of 40-50 ng/mL.
The plan was for cath in the morning.
The troponin had already started falling by 6am, resulting at 3.20 ng/mL.
The delayed angiogram showed total thrombotic occlusion (100%, TIMI 0 flow) of the First Obtuse Marginal (OM1). So it was OMI of the OM1. There was also scattered other chronic lesions including 70% circumflex and 75% RCA. Ejection fraction was estimated at 40%, and echo showed hypokinesis of the inferobasal and lateral walls.
 |
| Before intervention, showing OM1 occlusion. |
 |
| Annotated showing where the occlusion is. |
 |
| After intervention, showing now patent OM1. |
Here is his ECG the next day:
 |
| There are new Q-waves in inferior leads. It is not clear whether the T waves in the precordial leads are large enough to be considered posterior reperfusion T waves, and if this is a completed MI as suspected then reperfusion T-waves would not really be expected (they may invert but with very low voltage). |
Learning Points:
This case is an obvious example of how expert ECG interpreters can recognize OMI far earlier than the current management of the STEMI paradigm.
ST depression maximal in V1-V4 in the setting of a normal QRS should be concerning for posterior OMI until proven otherwise.

===================================
MY Comment by KEN GRAUER, MD (9/13/2020):
===================================
Today’s case provides an example of an acute OMI that should not have been overlooked by the Cardiology team.
- Among the goals of our ECG Blog — is to provide constructive feedback in the hope of improving the care of acute coronary syndromes. One of the KEYS for doing this — is to enhance awareness of which ECG findings emergency providers should look for when a patient with new-onset cardiac symptoms does not manifest readily identifiable millimeter-criteria that satisfy the definition of an acute STEMI.
- Drs. Smith and Meyers continue their laudatory work on dispelling the fallacy of dependence on millimeter-based STEMI criteria — which results in overlooking an estimated 25-30% of acute coronary occlusions (SEE our September 3, 2020 post for Dr. Meyers’ concise 17-minute presentation of the OMI Manifesto).
- In the hope of facilitating recall of Which ECG Findings To Look For — when STEMI-criteria ST elevation are not evident — I’ve adapted from the research and teachings of Drs. Smith and Meyers the features I list in Figure-1.
 |
| Figure-1: ECG findings to look for when your patient with new-onset cardiac symptoms does not manifest STEMI-criteria ST elevation on ECG. For more on this subject — SEE our September 3, 2020 post with Dr. Meyers OMI Manifesto Talk. For my clarifying Figure illustrating T-QRS-D (2nd bullet) — See My Comment in our November 14, 2019 post. |
Let’s take another look at 2 of the 3 tracings from today’s case (Figure-2). For clarity — I’ve put the initial ECG ( = ECG #1) together with the ECG done the following day after PCI ( = ECG #3).
 |
| Figure-2: Comparison between the initial ECG and the ECG done the next day after PCI. I’ve added a magnified mirror-image view of leads V2 and V3 to the right of each tracing (See text). |
Dr. Meyers has highlighted the abnormal ECG findings in ECG #1 (above). I’d like to add the following thoughts to his excellent discussion:
- The term, “hyperacute T waves” — is interpreted differently by different observers. As I indicate in the 1st bullet of my Figure-1 — I favor defining “hyperacute” T waves as being disproportionately tall and/or fatter-at-their-peak or wider-at-their-base than should be expected given R wave and S wave amplitude in whatever lead you are looking at.
PEARL #1: To facilitate recognition of hyperacute T waves — I favor the concept I’ve named, “Patterns-of-Leads”. By this I mean that IF there is an ongoing acute coronary syndrome, and you identify an ST-T wave abnormality in one lead — the chances are excellent that one or more neighboring leads will also manifest a similar ST-T wave abnormality.
- For example — Isn’t the peak of the T wave in lead aVF fatter-than-you-would-normally-expect it to be? Compared to the 9 mm tall R wave in this lead — Isn’t the 5 mm tall T wave disproportionately taller-than-it-should-be? I’d add that the base of the T wave in lead aVF is also wider than I’d expect. Given the history ( = chest “pressure” of 2 hours duration that brought today’s patient to the ED!) — the T wave in lead aVF has to be considered a “hyperacute” T wave until you prove otherwise.
- Using the principle of Patterns-of-Leads — I agree with Dr. Meyers that the other 2 inferior leads ( = leads IIand III) show similar hyperacute T waves.
- Elsewhere on this tracing (as per Dr. Meyers) — lateral chest leads V5 and V6 also show similar hyperacute changes. By way of comparison — a much more normal T wave appearance is seen in leads V5 and V6 of ECG #3 done the next day.
Dr. Meyers also highlights the reciprocal ST-T depression seen in lead aVL. We have commented often in Dr. Smith’s Blog how helpful the finding of a reciprocal relationship for ST-T wave appearance between leads III and aVL is for recognizing acute OMI.
- Beyond-the-Core (and admittedly subtle): The reciprocal relationship between leads III and aVL is subtle in the initial ECG from today’s case. This is because of 2 factors: i) The amplitude of the QRS complex and T wave in lead aVL of ECG #1 is tiny; and, ii) The T wave in lead aVL may normally be negative in cases in which the QRS is predominantly negative (as it is in ECG #1). That said — even though the amplitude of the QRS and ST-T wave in lead aVL of ECG #1 is tiny — the relative width of this negative T wave is wider-than-I-would-have-expected, and this wider shape of the inverted T wave in aVL is a miniaturized mirror-image match of the disproportionate T wave dimensions in lead III.
PEARL #2: The purpose of the 5th bullet in my Figure-1 — is that the finding of maximal ST segment depression in leads V2-to-V4 is highly suggestive of acute posterior involvement (since anterior leads V2,V3,V4 provide a mirror-image view of the LV posterior wall). As a visual aid to facilitate recognition of the distinct ST-T wave depression shape that is characteristic of acute posterior MI — I favor what I call, the “Mirror Test” (See My Comment in the February 16, 2019 post of Dr. Smith’s ECG Blog).
- Note in the magnified mirror-image view of leads V2 and V3 (to the right of ECG #1) — that the taller-than-expected anterior R waves in leads V2 and V3 of ECG #1 in the mirror-image view “become” Q waves. Note also that the straightened, downsloping depressed ST segment in lead V2 — and, the straightened, upsloping depressed ST segment in lead V3 — in the mirror-image view “become” readily apparent as acute infarction-like ST elevation with terminal T inversion. KEY: With a little bit of practice — use of the Mirror Test should facilitate near-instant recognition of even subtle changes of acute posterior MI.
PEARL #3: In the 3rd bullet in Figure-1 — I’ve underlined that, “the more leads with suspicious findings — the greater the concern for an acute ongoing event”. As soon as I’ve identified which of the 12 leads manifest clearly abnormal ST-T wave findings — I reapply the “Patterns-of-Leads” principle, by GOING BACK and taking another look at the remaining leads, to see if they might also show subtle abnormalities that I may not have initially identified.
- Leads in ECG #1 that I have already identified (above) as clearly manifesting abnormal ST-T waves in this patient with new-onset symptoms include — leads II,III,aVF — lead aVL — leads V2,V3 — and leads V5,V6.
- Among the remaining leads in ECG #1 — I believe subtle-but-real ST-T wave abnormalities are also present in leads I, V1 and V4. Lead I — shows slight J-point ST depression and ST segment straightening. Regarding lead V1 — in the context of clear indication of acute posterior MI (given the appearance of leads V2 and V3) — the T wave in V1 looks broader and more deeply inverted than I’d normally expect (subtle). And, Lead V4 is definitely abnormal — as it shows ST depression and an overly fat-and-peaked T wave, similar to the ST-T wave appearance in lead V3.
- BOTTOM Line Regarding ECG #1: No less than 11 of 12 leads manifest what I consider abnormal (and potentially acute) ST-T wave changes in this patient with new-onset symptoms.
Putting It All Together: As per Dr. Meyers — the abnormal findings in ECG #1 are “probably obvious to regular readers of this blog”. They should be obvious to all providers charged with rendering emergency care.
- The BEST ways to facilitate recognizing these acute changes in ECG #1 are: i) To look at all 12 leads for the ECG findings listed in Figure-1 in all of your patients with new symptoms who do not manifest obvious STEMI criteria; and, ii) To actively seek out follow-up (whenever at all possible) on the patients you see — and, to learn from that follow-up!
To anyone questioning the detail of my above commentary — I suggest making a lead-by-lead comparison in Figure-2 of QRS and ST-T wave appearance for each of the 12 leads between ECG #1 and ECG #3.
- It should be noted that there has been some change in QRS morphology for both limb leads (due to slight frontal plane axis shift) and chest leads (perhaps due to slight change in precordial lead placement). Despite this — I believe that for the most part, the changes in ST-T wave morphology that we see between ECG #1 and ECG #3 are real.
- Note that each of the leads with hyperacute T wave changes that we identified for ECG #1 — no longer look “hyperacute” in ECG #3.
- As per Dr. Meyers — the Q in lead III of ECG #3 is now much deeper (almost equal in amplitude to the small R wave in this lead).
- Perhaps the shallow T inversion in lead III of ECG #3 — and the now upright T wave in lead aVL — both reflect some reperfusion. Similarly, the ST depression in leads V2-V4 that was seen in ECG #1 — is no longer present in ECG #3. As suggested by the magnified mirror-image view of leads V2 and V3 (to the right of ECG #3) — the now upright T waves in leads V1-thru-V4 may also represent reperfusion.
Our THANKS to Dr. Meyers for presenting this case. LOTS of lessons to be learned!