A 50-something male with no past history had onset of chest pain followed by arrest. After multiple shocks, he was resuscitated.
He went into VF again, and was again resuscitated and loaded with amiodarone 300 mg.
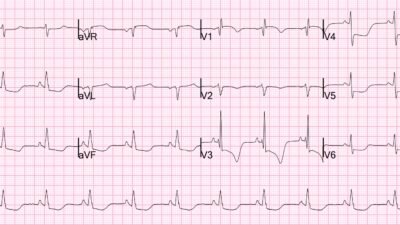
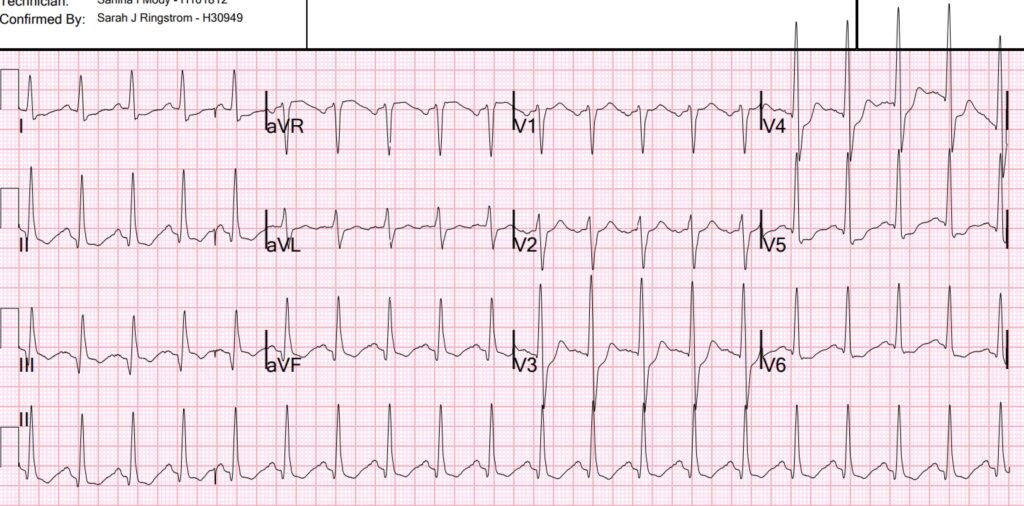
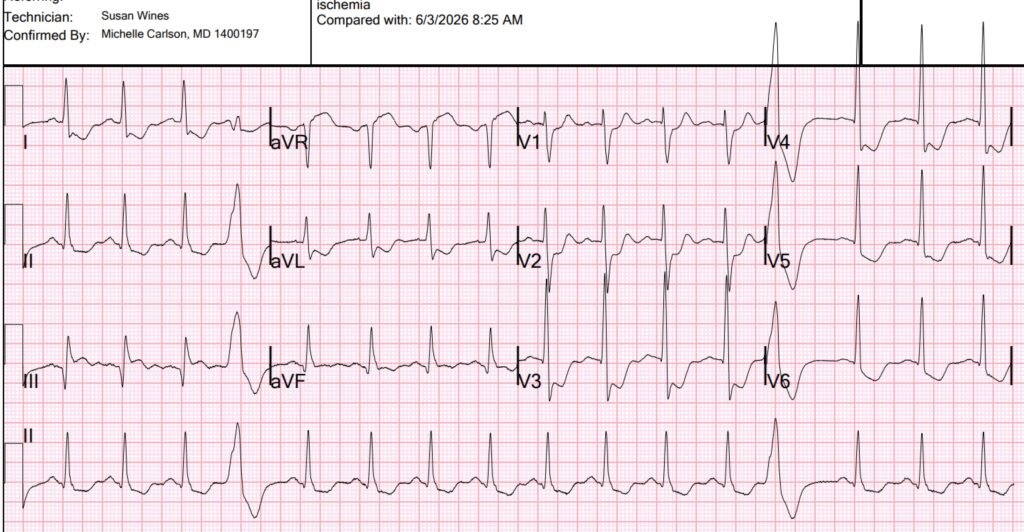
Here is the initial 12-lead:
What do you think?
There is sinus tach (probable) with a wide complex QRS that does not fit either bundle branch block (BBB), and is therefore an “intraventricular conduction delay” or IVCD. There is ST depression in I, II, aVL, aVF and precordial leads V2-V6. It is not certain whether this is maximal in V1-V4, or in V5-6, but probably V4. There is STE in aVR, reciprocal to STD in apical leads.
There is slight ST Elevation in lead III. When there is diffuse subendocardial ischemia (SEI), the ST depression is maximal in leads II and V5, and there should also be some ST Depression in lead III. ST Elevation in lead III suggests “Aslanger Pattern,” an OMI pattern of STE in one lead only (lead III). Aslanger and others, including me, described this in this paper in 2020: A new electrocardiographic pattern indicating inferior myocardial infarction.
The prespecified pattern was defined in this way:
(1) any STE in lead III but not in other inferior leads,
(2) STD in any of leads V4 to V6 (but not in V2) with a positive or terminally positive T-wave,
(3) ST in lead V1 higher than ST in V2 (Fig. 1).
Our case here does have STD in V2, but I don’t think that matters; the exclusion of STD in V2 is in order to not confuse inferior-posterior OMI with inferior + SEI. What does matter is that there is isolated STE in lead III and probably diffuse SEI.
It was not described in the setting of IVCD or BBB, but I believe it still applies.
What is the meaning of Aslanger pattern? It means that there is SEI from 3 vessel disease PLUS inferior OMI, usually from the circumflex.
This explains the pattern:
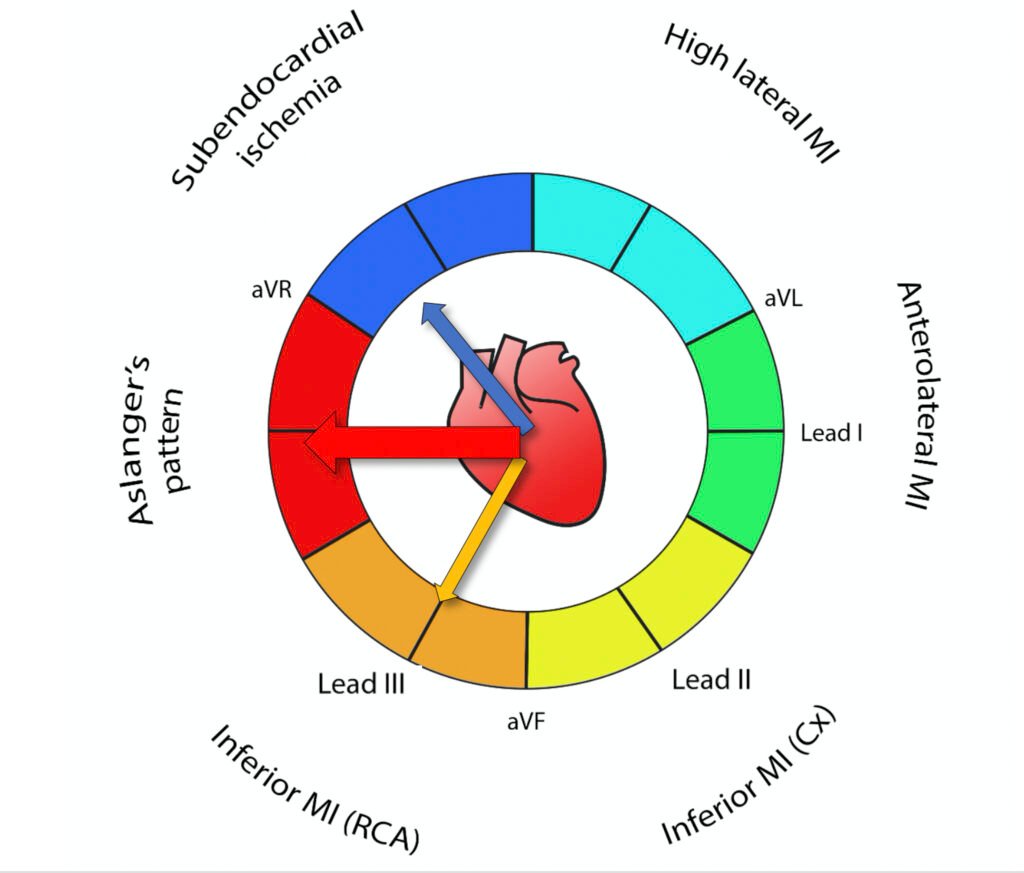
Vector 1: Normally, in SEI, the ST depression vector is towards lead II (which also results in STD in III and aVF. The ST Elevation vector is towards aVR.
Vector 2: Normally, in inferior OMI, the ST Elevation vector is towards lead III (which also results in STE in II, aVF).
If there is BOTH inferior OMI AND SEI, we add the two vectors, and the STE vector is directly to the right. This means that there will only be STE in leads III and aVR, with STD in II and aVF, even though there is inferior OMI.
The Queen of Hearts interpretation is here:
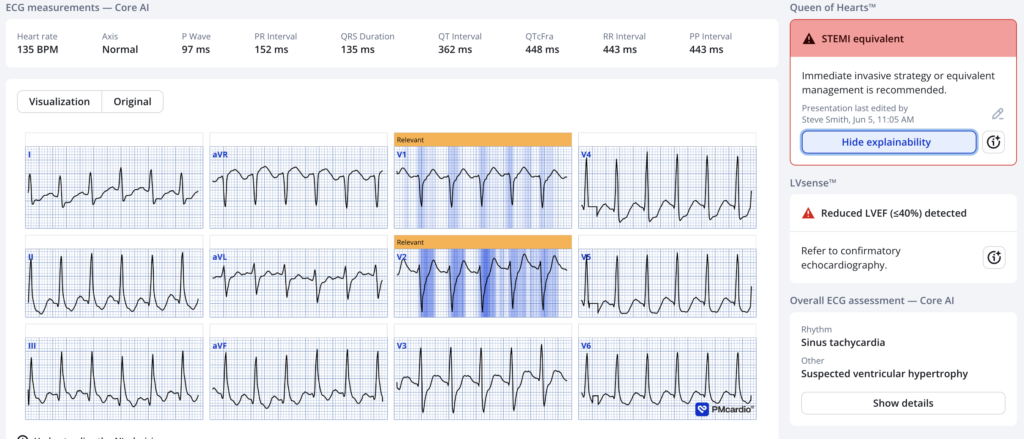
The Queen seems to think this is posterior OMI.
The cath lab was activated.
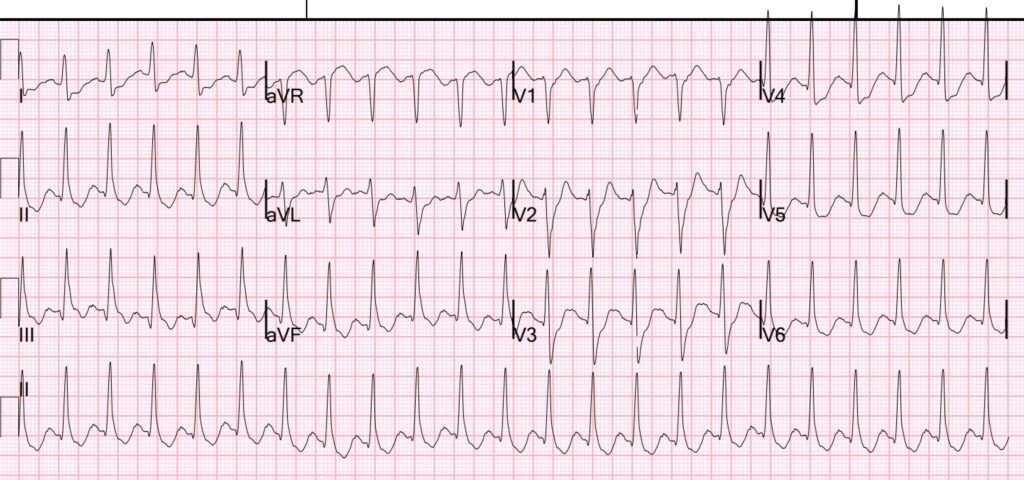
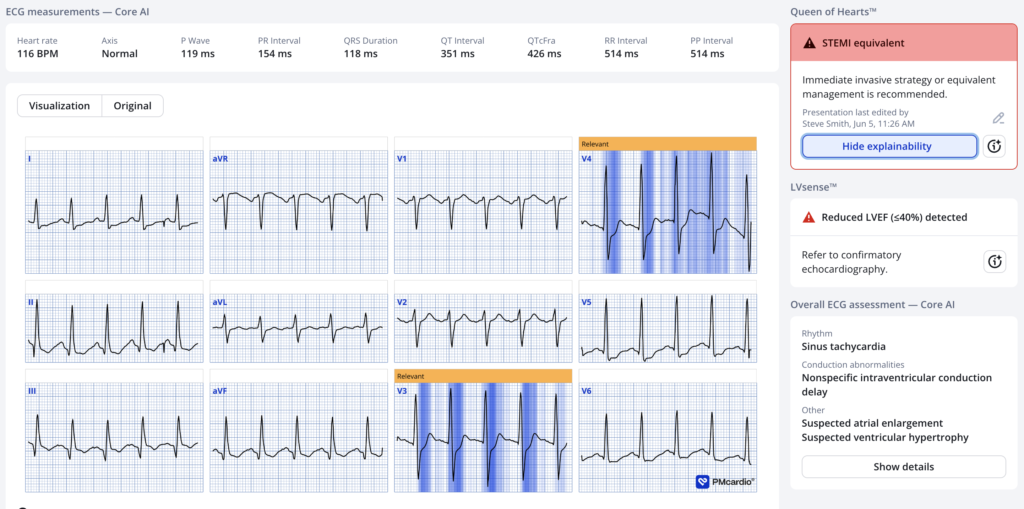
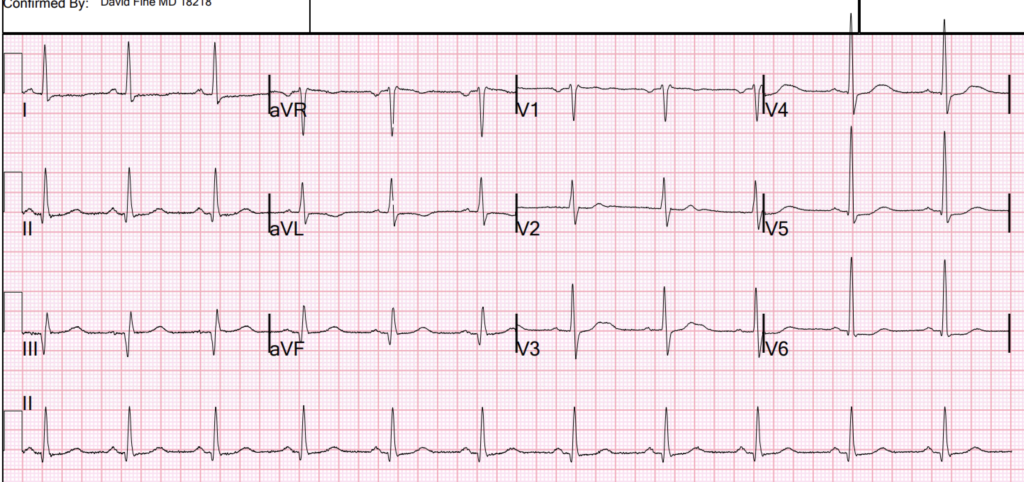
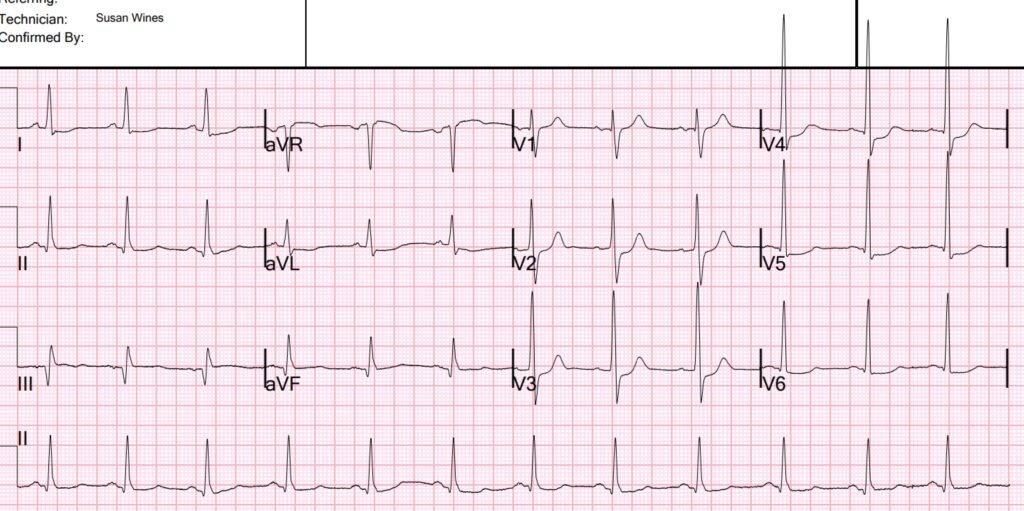
Another ECG was recorded while waiting:
This one looks more like a pure posterior OMI, and the Queen agrees:
He was put on heparin and aspirin, without a P2Y12 inhibitor. At some point he was quite hypertensive and put on IV titratable vasodilators. I believe nitroprusside.
Angiogram:
RCA: RCA is a large caliber vessel with tubular 50% stenosis in the mid-segment and occlusion in the distal segment. Faint bridging antegrade collaterals, conus > LA > rPAV collaterals, and well developed L > R collaterals to a large distal RCA system strongly suggest a chronic total occlusion. A medium rPDA, large rPLA1 and medium rPLA2 are seen to fill via collaterals
LMCA: Left main is a medium caliber vessel with mild plaque in the distal segment
LCx: Circumflex is a medium caliber vessel with 80-90% ostial stenosis and occlusion in the mid-segment. OM1 is a small-medium caliber vessel with 70% ostial stenosis. Two small-medium caliber OM branches are noted to fill retrograde via L > L collaterals.
LAD: LAD is a medium-large caliber vessel that extends to the apex and has moderate to severe calcification in the proximal and mid-vessel. There are tandem 60% and 90% stenoses in the proximal vessel. D1 is a large caliber, branching vessel with diffuse mild-moderate plaque. There is a diffuse 50% stenosis in the mLAD beyond the D1 bifurcation and the mid-LAD may follow an intramyocardial course.
Summary: 3 vessel disease with circumflex occlusion. In the Aslanger study, this is what most such patients’ angiograms showed.
No intervention was done. Patient was set up for bypass surgery (CABG).
It is unclear to me why no intervention was done on the occludede circumflex. But it seems that, often, when it is determined that CABG is necessary, it is not preceded by PCI. I don’t understand enough about it to know why. And the subsequent events show that there was unstable plaque that resulted in further infarction.
Echo:
The estimated left ventricular ejection fraction is visually estimated at 5-10%. Left ventricular enlargement. Regional wall motion abnormality-apex, anterior, anterolateral, and inferolateral akinesis (Dense inferior wall motion abnormality)
After Echo, and 13 hours after ROSC, this ECG was recorded:
This shows substantial inferior infarction (deep wide Q-wave in II, III, aVF), but resolution of ischemia. (No active ischemia).
Trops:
First hs trop I: 1,029 ng/L, rose to > 60,000 by 9 hours. At 35 hours, it was back down to 9,144.
He went for MRI on day 3, about 44 hours after presentation:
Function on MR: Moderately decreased left ventricular systolic function with a calculated ejection fraction of 31%. Regional wall motion abnormality–mid to apical anterior, mid anteroseptal, apical septal, and apical inferior hypokinesis. Regional wall motion abnormality–basal inferolateral hypokinesis.
–Normal right ventricular systolic function with a calculation ejection
fraction of 58%.
–No significant valvular abnormalities were visualized.
Post-contrast findings-
First pass perfusion imaging reveals nearly transmural septal, inferior,
and inferolateral decreased perfusion. After administration of gadolinium
in the dose of 40 mL, early images obtained with a TI of 400 msec reveal
the same findings, suggesting resting ischemia in the septal, inferior,
and inferolateral segments.
Delayed enhancement sequences obtained at 10 mins after gadolinium
administration reveal no abnormal enhancement.
IMPRESSION:
1. Findings are suggestive of resting ischemia in the LAD and RCA
territories. There is no evidence for delayed enhancement, suggesting
viability in all coronary territories.
2.Moderately decreased left ventricular systolic function, calculated
ejection fraction 31%.
Case continued:
The patient returned to his room, and then had onset of chest pain again with flash pulmonary edema. He had an ECG recorded:
This clearly shows inferior OMI, plus either SEI or posterior. In other words, Aslanger’s versus Inferior-Posterior. Cath lab was not activated.
He received SL NTG which improved his pain. Around that time, he was also being switched from nipride to clevidipine and he had acute cardiogenic flash pulmonary edema with SBP going up to 160s and HR going up to 130 (sinus) with associated SOB and hypoxia. He was started on BiPAP and received lasix as well as bolus of NTG along with initiation of NTG drip (with his ongoing clevedipine drip) which improved his clinical status. POCUS showed EF in the ~25% range with no signs of acute MR.
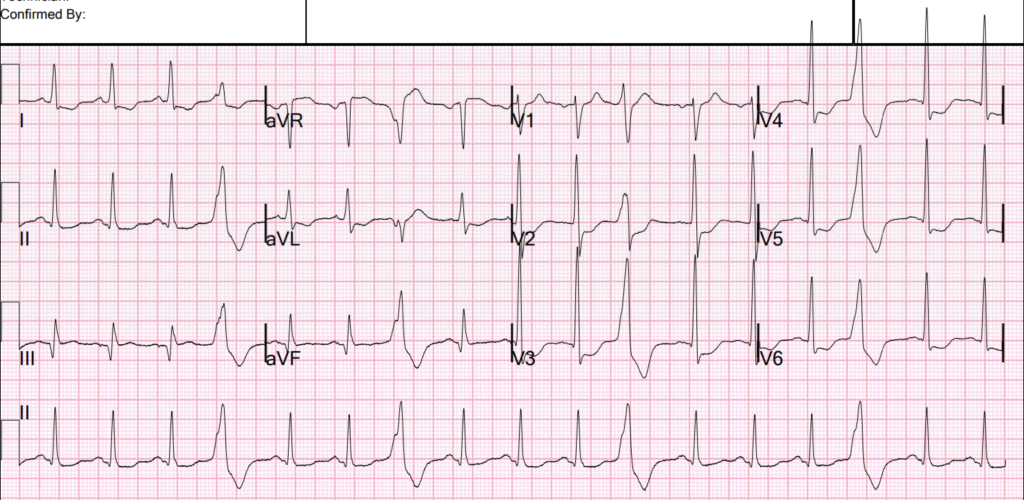
4 hours later, this was his ECG:
Much better but still consistent with posterior OMI vs. continued SEI, and inferior infarction.
Guidelines would say that this unstable patient with ischemia and pulmonary edema needs emergent revascularization.
The troponins after the episode that followed the MRI (recurrent chest pain and pulmonary edema), rose to 9805, then 11,668, then falling to 10,740.
Then, overnight, the patient had more flash pulmonary edema, with chest tightness. Another ECG was recorded:
Ischemia is again worse.
After this episode, the troponin rose again to 21,654 ng/L.
They decided to go ahead with CABG. 3 vessel bypass was done several days later.
The patient did reasonably well.
= = =
==================================
MY Comment, by KEN GRAUER, MD (6/19/2026):
A key lesson from today’s case — is the need to learn from decisions that did not work out as we would have wanted. No matter how well intentioned we may be — the future is not predictable. That said — the subtlety of a less obvious Aslanger Pattern is important to appreciate, because we once again see the unfortunate consequences of failing to act on what serial ECGs are telling us.
- Today’s case reminded me of our May 22, 2026 post — in which the challenge of distinguishing between DSI (Diffuse Subendocardial Ischemia) — vs an Aslanger Pattern (in which there is both DSI + evidence of ongoing acute infero-postero MI) is KEY to expediting not only prompt cath, but also to implementation of timely PCI intervention (See My Comment at the bottom of the page in this May 22, 2026 post).
- In today’s case — we can retrospectively establish that PCI should have been done days before CABG was finally undertaken (witness multiple ischemic-induced episodes of flash pulmonary edema with Troponin rise to over 20,000 — all of which occurred after cardiac cath demonstrated severe multi-vessel disease with acute occlusion — but before CABG was finally scheduled).
= = =
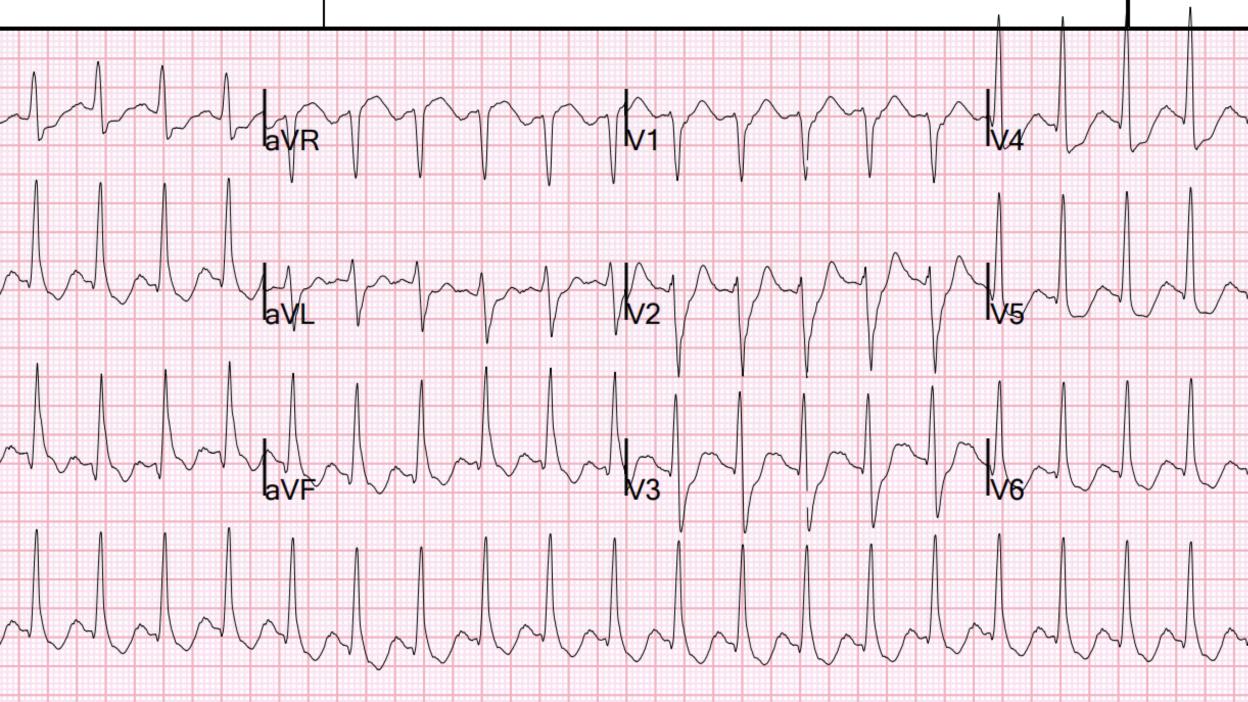
A definite Aslanger Pattern:
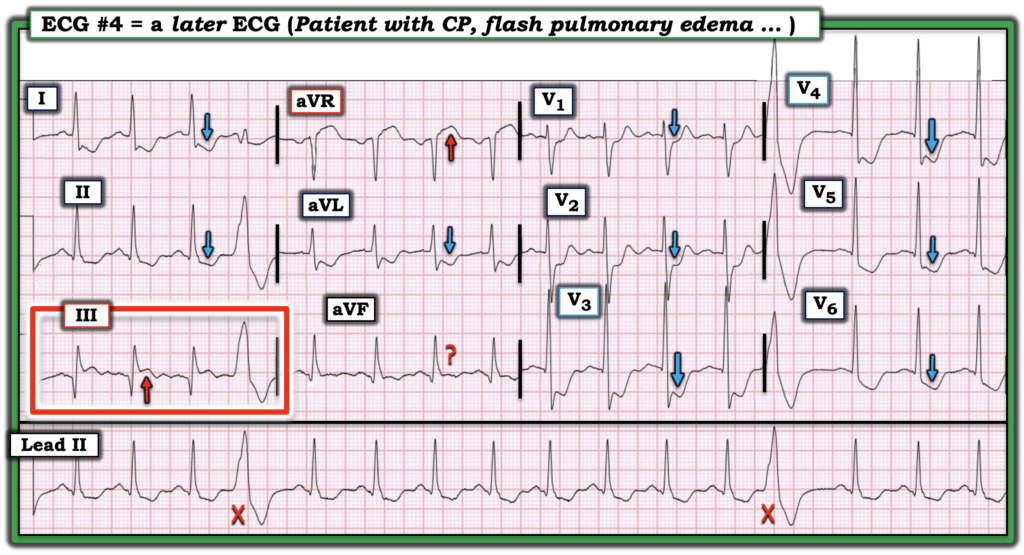
The 4th ECG in today’s case illustrates the picture of Aslanger‘s Pattern that we need to engrain in our brain (See ECG #4 below — in Figure-1).
- There is underlying DSI (Diffuse Subendocardial Ischemia — alternatively called SEI = SubEndocardial Ischemia) — as recognized by ST depression in multiple leads (BLUE arrows in Figure-1) in association with ST elevation in lead aVR (RED arrow in this lead).
- As explained above by Dr. Smith — the associated presence of acute inferior OMI is signaled by ST elevation in lead III (within the RED rectangle in Figure-1) — but without ST elevation in the other 2 inferior leads.
- While true that the ST segment in lead aVF is coved and not consistently depressed for the 4 beats seen in this lead — the ST segment in aVF is not elevated in the obvious manner that lead III is.
- As often occurs, the ECG in Figure-1 not only suggests inferior OMI — but also posterior OMI by the finding of maximal ST depression in leads V3 and V4.
- Also consistent with acute OMI in this tracing are the 2 PVCs (the “X’s” in Figure-1).
- “Take-Home” Point — In a patient with symptoms, ST elevation in lead III (but not in leads II and aVF) that occurs in association with ECG evidence of DSI — suggests at least a component of Aslanger’s Pattern ==> acute inferior OMI in addition to DSI, with probable need for prompt cath.
= = =
Figure-1: The 4th ECG shown above in Dr. Smith’s discussion — obtained during the course of today’s case at a time when chest pain recurred in association with an episode of flash pulmonary edema.
= = =
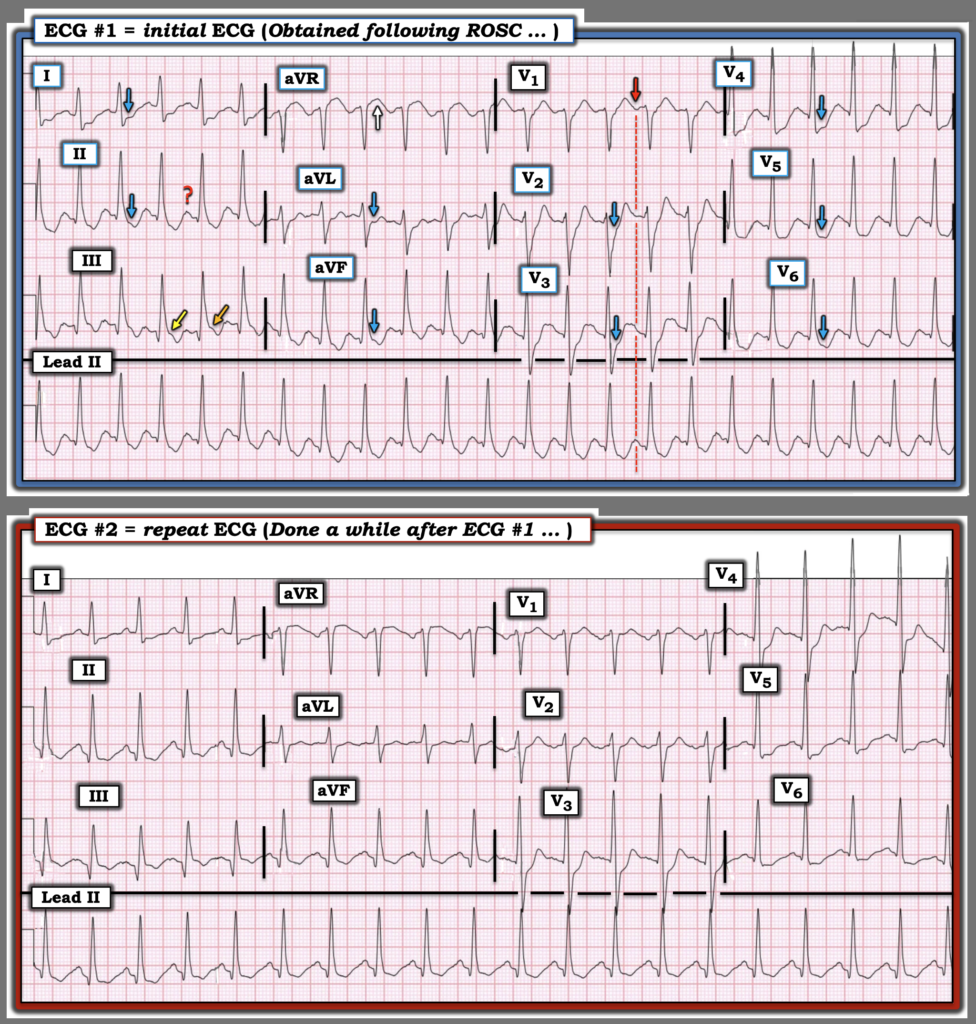
Interesting Features in ECGs #1 and #2:
Dr. Smith recognized the early presence of Aslanger’s Pattern in today’s initial ECG ( = ECG #1 in Figure-2 below). I didn’t appreciate this until later in my review for several reasons:
- ECG #1 is the initial ECG obtained following ROSC (Return Of Spontaneous Circulation) in this patient requiring multiple shocks before regaining a pulse. As we frequently caution in Dr. Smith’s ECG Blog — when diffuse ST depression is seen in the initial ECG obtained following ROSC from cardiac arrest — It is usually best to repeat the ECG after waiting ~15 minutes — to see if the diffuse ST-T wave abnormalities are resolving (as they might if the ST depression was simply the result of transient “no flow” from the cardiac arrest — and not due to acute infarction).
- Whereas immediate management of this patient would seemingly not be altered regardless of whether or not an Aslanger Pattern was present in this initial post-resuscitation ECG — I was not yet 100% certain of the rhythm. I therefore interpreted ECG #1 as a regular SVT at the rapid rate of ~135/minute, with an upright deflection before each QRS in lead II that probably was a sinus P wave — but which might possibly simply reflect the terminal portion of an upright T wave (the RED ? in lead II of ECG #1).
- The suggestion of a distinct upright P wave in leads I and aVL of ECG #1 favored sinus tachycardia as the etiology of the rhythm.
- PEARL #1: In my experience — the finding of the subtle negative deflection before each QRS in lead V1 (RED arrow in this lead) in association with the narrow-complex tachycardia that we see in ECG #1 — very often will turn out to be a reflection of sinus P waves (the dotted RED line highlighting simultaneous occurrence of these P wave deflections in leads II and V1).
- So I thought, “While not 100% certain that the rhythm in ECG #1 is sinus tach — it probably is, and since the patient is clearly better off (having regained ROSC) — anticipated improvement in this patient’s clinical condition over the next few minutes will almost certainly result in at least some rate slowing, which is likely to lead to a much clearer distinction in lead II between T wave and sinus P waves).
- Reduction of the heart rate to ~115/minute in ECG #2 quickly confirmed with 100% certainty that the rhythm is sinus tachycardia.
The final reason I did not appreciate the Aslanger-like Pattern in ECG #1 — is the wavering ST segment baseline in lead III. For example — the ORANGE arrow suggests there is at least some ST elevation in lead III of ECG #1 — whereas the YELLOW arrow does not.
- And, since initial management measures were unlikely to change over the next few minutes regardless of whether or not an Aslanger-like Pattern was present — I felt no need to commit to diagnosing an OMI on this early post-resuscitation tracing.
= = =
PEARL #2: The comparison in Figure-2 between ECGs #1 and #2 provides an excellent illustration of how challenging it can sometimes be to distinguish between DSI vs an Aslanger Pattern vs the presence of both DSI and an acute OMI (= Aslanger’s Pattern).
- I assessed the relative amount of ST depression in the lateral chest leads of ECG #1 as comparable to the amount of ST depression in leads V2,V3,V4. As a result — I interpreted ECG #1 as DSI without clear indication of an acute OMI.
- In contrast, in ECG #2 — I thought both DSI and acute infero–postero OMI were likely to be present because: i) ST depression seems maximal in leads V3,V4 (therefore suggestive of posterior OMI); — and, ii) The ST segment is coved and appears at least slightly elevated in lead III — with the J-point of the ST segment in this lead III clearly located higher than it is in the other 2 inferior leads (therefore suggestive of an Aslanger-like Pattern indicative of acute inferior OMI).
= = =
Figure-2: Comparison between the first 2 ECGs in today’s case.
= = =
= = =