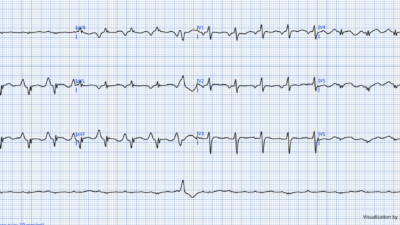
This was sent to me by a former resident:
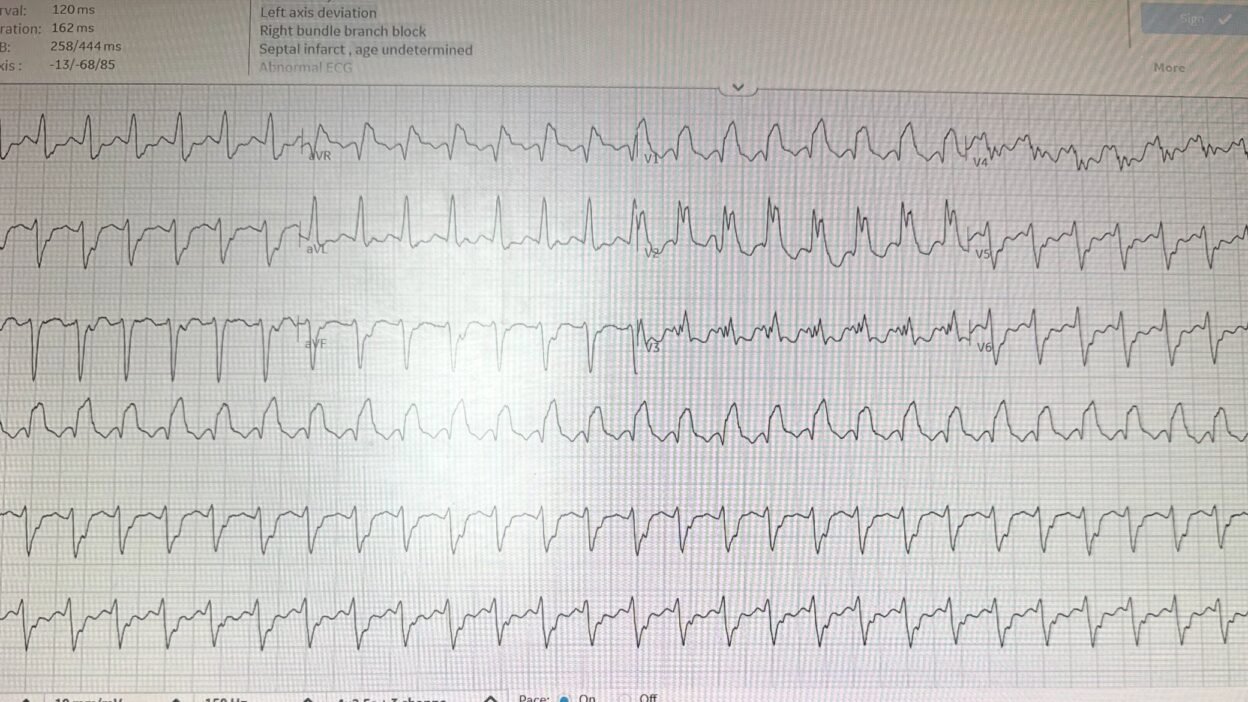
A 38 year old with history of hypertension and obesity only presented with dizziness, abdominal bloating, and leg cramping for one week. At triage, he was hypotensive and tachycardic, so an ECG was recorded:
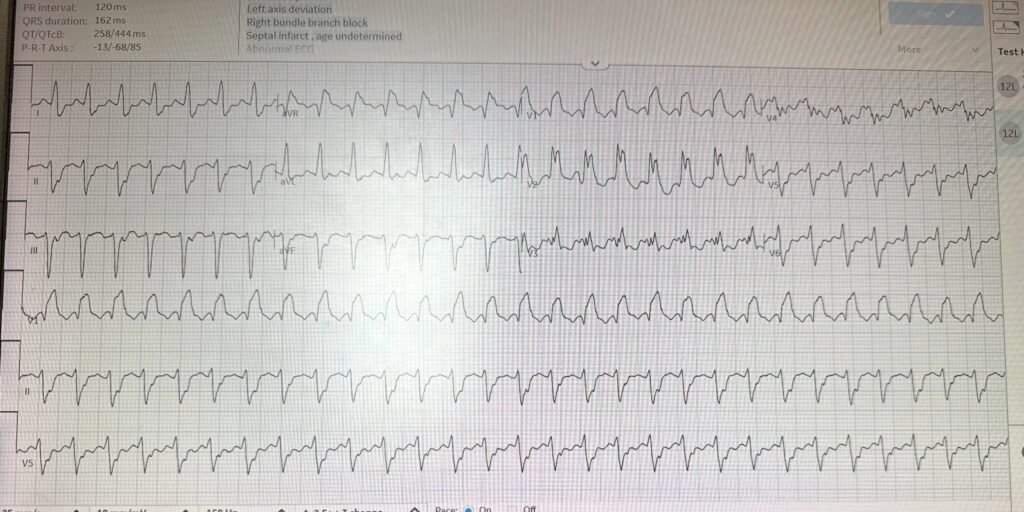
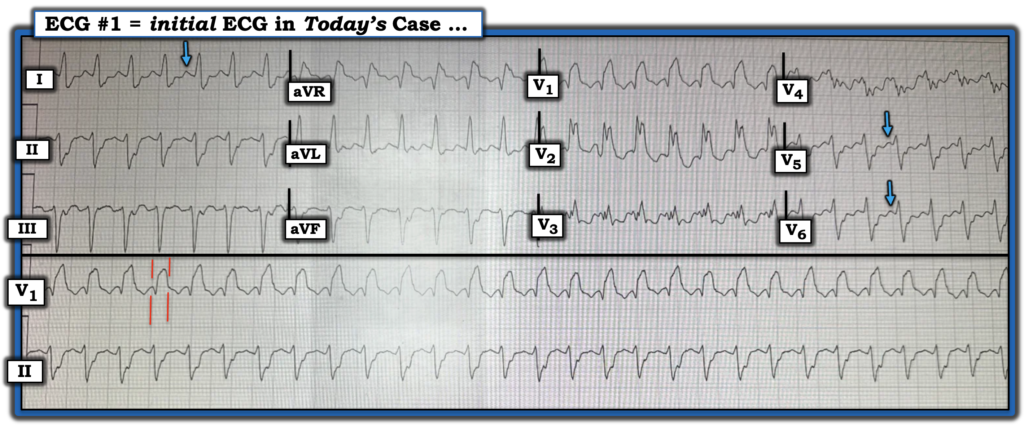
Regular wide complex tachycardia at a rate of 174, with RBBB and LAFB morphology.
Leads II and V1 have what could be P-waves before each QRS, so I was not certain of whether this was sinus tach with RBBB and LAFB, or SVT with aberrancy, or ventricular tachycardia (VT).
What do you think?
= = =
= = =
Smith: Against VT is this: Possible presence of P-waves before each QRS? RS duration in multiple leads < 100ms (=~80ms or even less).
Finally: when there is RBBB + LAFB morphology, a tachydysrhythmia might well be “posterior fascicular VT”; because it initiates in the posterior fascicle, it has RBBB + LAFB morphology. Such VT usually is associated with good LV function, so one expects good EF.
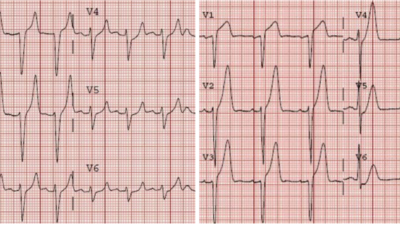
Features of VT include wide Q-wave in aVR, with duration >40 ms; R’>R in V2, absence of small r-wave at initiation of QRS in V1.
Diagnostic finding! In addition, thanks for Ken Grauer’s keen eye (see his full explanation with yellow arrows below): there appear to be retrograde P-waves in lead II. Thus, it is a tachydysrhythmia, but we still don’t know if it is SVT with aberrancy or VT. Ken explains below why it must be VT.
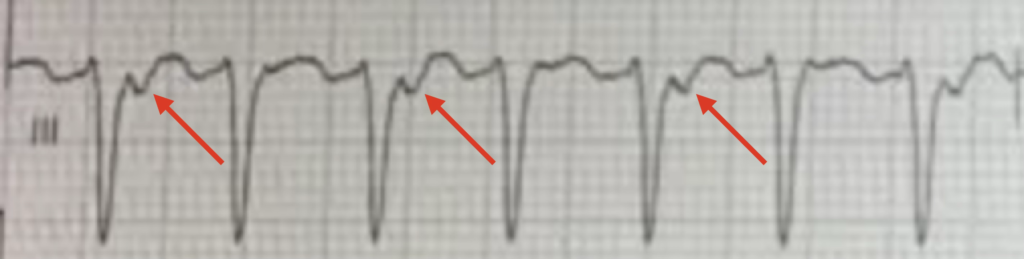
Frick: On my review, I think there is 2:1 ventriculoatrial conduction, which is also diagnostic for VT (more ventricular than atrial beats). In lead III especially, you can see an alternating pattern. This could be pure electrical alternans, but I think it is more likely 2:1 VA conduction. This is shown below.
Aside: If you had not seen this diagnostic finding, and still thought that sinus tach was possible, the you could pay close attention to the heart rate variability (if rate changes from minute to minute, it very well may be sinus), and assess volume by ultrasound. If volume is low or euvolemic, and there are no B-lines, try giving fluids and see what happens to the heart rate. I don’t know if those were attempted.
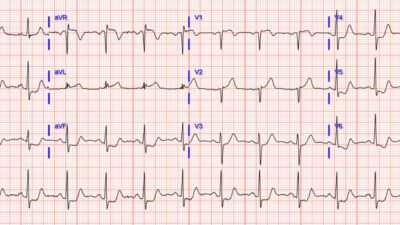
The providers thought it was SVT and tried adenosine without success. They then thought it might be ventricular tachycardia, and so performed electrical cardioversion with 360 J 3x, and there was conversion on the 3rd try. Here is the post cardioversion ECG:
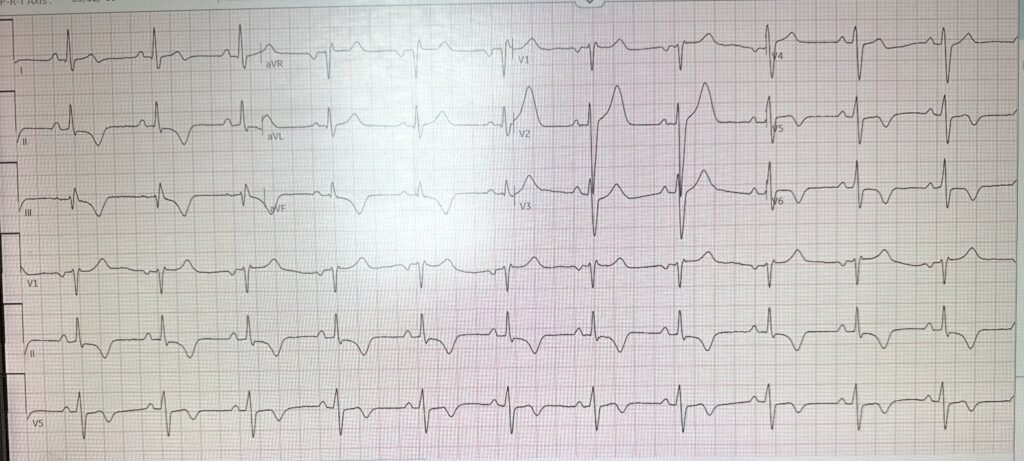
Apparently, the rhythm converted, which rules out sinus tach. SVT or VT, including fascicular VT, are all still possible.
EF at bedside ultrasound after cardioversion was moderately decreased.
I do not see good evidence for ACS on this ECG. Here is the Queen’s opinion:
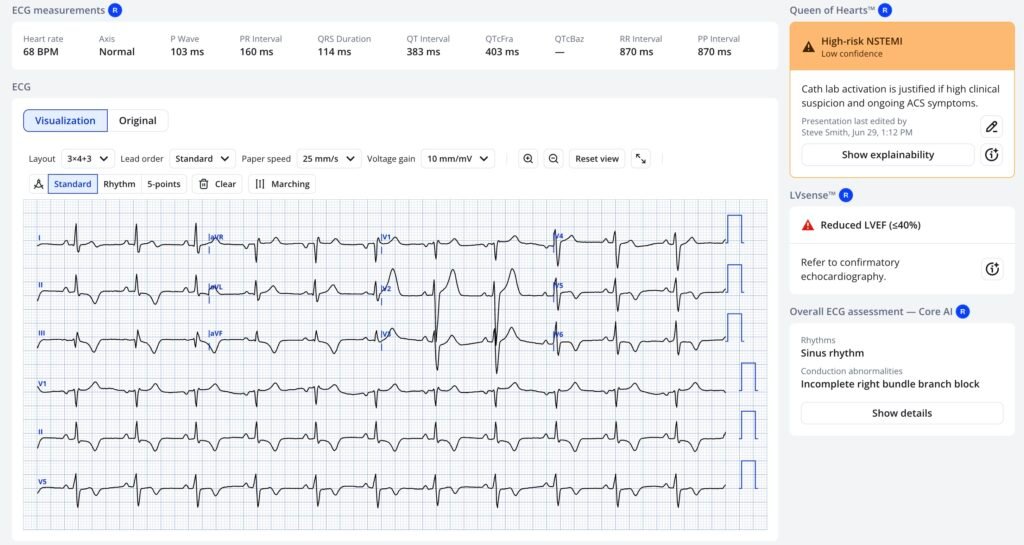
Notice PMCardio also states that the EF is <40%, which was confirmed by bedside ultrasound.
My response to the Queen’s interpretation: “She thinks it is a reperfused OMI. Probably because of inferior and lateral T wave inversions. It is possible. I doubt it.” In other words, I did not think this was a case of Acute MI or OMI.
Frick: The T wave inversions are likely due “memory T waves.” In short, when a patient with abnormal depolarization (e.g. LBBB, ventricular pacing, or in this case VT) has improvement in conduction (e.g. resolution of LBBB, stopping pacing, or cardioverting VT), the heart still “remembers” the abnormality and retains abnormal repolarization for a period of time (minutes to weeks).
The patient was taken for angiogram and coronaries were clean.
Electrophysiology thinks this is posterior fascicular VT and will do an ablation soon. The EF is now 45%.
My final comment to the sender: “Fascicular VT makes sense. EF then might be low due to tachycardia-induced cardiomyopathy, as the patient was probably in this rhythm for a sustained period.” All it takes is one week at this heart rate to develop tachycardia induced cardiomyopathy.
If the diagnosis of posterior fascicular VT had been definitively made, then verapamil is very effective. I would NOT give verapamil in this case because the EF was not normal. Two reasons: 1) this makes the probability of more standard VT more likely and 2) verapamil has a profound effect on contractility and so could lead to shock. Electricity is the best treatment here.
See this great post by Pendell: Idiopathic Ventricular Tachycardias for the EM Physician
= = =
==================================
MY Comment, by KEN GRAUER, MD (7/4/2026):
Distinction between VT vs some form of SVT with either rate-related aberrant conduction or preexisting bundle branch block — poses an eternal problem for emergency care providers. The challenge put forth by today’s case provides us with one more example of how difficult acute decision-making can be in this life-threatening situation.
- I’ve reviewed “My Take” on distinction between VT vs some form of SVT with either rate-related aberrant conduction or preexisting bundle branch block on many occasions in My Comments at the bottom of the pages in Dr. Smith’s ECG Blog.
- For readers with an interest in some practice cases — I suggest taking a look at My Comment in the May 5, 2020 post — the June 23, 2023 post — and/or the March 9, 2026 post.
- Additional practice examples can be found in the August 13, 2020 post — the June 25, 2020 post — the April 23, 2019 post — and the April 15, 2020 post, to name just a few.
= = =
Today’s CASE:
Today’s initial ECG makes for a worthy addition to the above list of problematic tracings — as I found myself wavering back-and-forth between VT vs an SVT with either rate-related aberrant conduction or preexisting bundle branch block. I ended up opting for “the default” (ie, When in doubt — assume VT until proven otherwise) — but I was in no way certain.
- And then I saw the one clue that all-but-confirmed the diagnosis.
= = =
Take another LOOK in Figure-1 below, at today’s initial ECG. As per Dr. Smith’s above discussion — ECG #1 manifests the following:
- A regular WCT (Wide-Complex Tachycardia) at a rate of ~175/minute, without clear sign of sinus P waves (ie, There is no clearly upright P wave with fixed PR interval in lead II).
- Looking for P waves in other leads is problematic because of the fast rate that results in what looks like the terminal upright portion of the T wave mimicking what otherwise might be thought to represent P waves in other leads (ie, a sinus P wave in lead I should not be taller than the sinus P wave in lead II — and if the rhythm is sinus, we should not see larger P waves in leads V5,V6 than in lead II — as highlighted by BLUE arrows in Figure-1).
- The QRS appears to be very wide (ie, 0.16 second — as suggested by the parallel RED lines in Figure-1) — which favors VT.
- But QRS morphology is potentially consistent with RBBB (Right Bundle Branch Block) + LAHB (Left Anterior HemiBlock) — which together with the marked fragmentation (ie, notching) of the QRS in multiple leads could represent as yet undiagnosed underlying heart disease in today’s 38-year old patient.
- BOTTOM Line: I found myself unable to decide with any degree of certainty between VT vs some form of SVT. I knew statistics always favor VT as the most common cause of a regular WCT rhythm without clear sign of sinus P waves (with need to treat the patient accordingly until we can prove otherwise). But — I couldn’t rule out aberrant conduction or a previously present bifascicular block with a supraventricular etiology of today’s tachycardia.
- If we could find a previous ECG for comparison, we might be able too arrive at a more definitive diagnosis — but no prior tracing was available.
- Are we suspicious enough of VT in Figure-1 to apply synchronized cardioversion as our initial intervention?
- If we could find a previous ECG for comparison, we might be able too arrive at a more definitive diagnosis — but no prior tracing was available.
= = =
Figure-1: I’ve reproduced today’s initial ECG.
= = =
— And then I saw the definitive clue …
- HINT: Looking closely at Figure-1 — although clear indication of sinus P waves is not seen, perhaps there is other evidence of atrial activity on this tracing? Do YOU see it?
= = =
= = =
Answer:
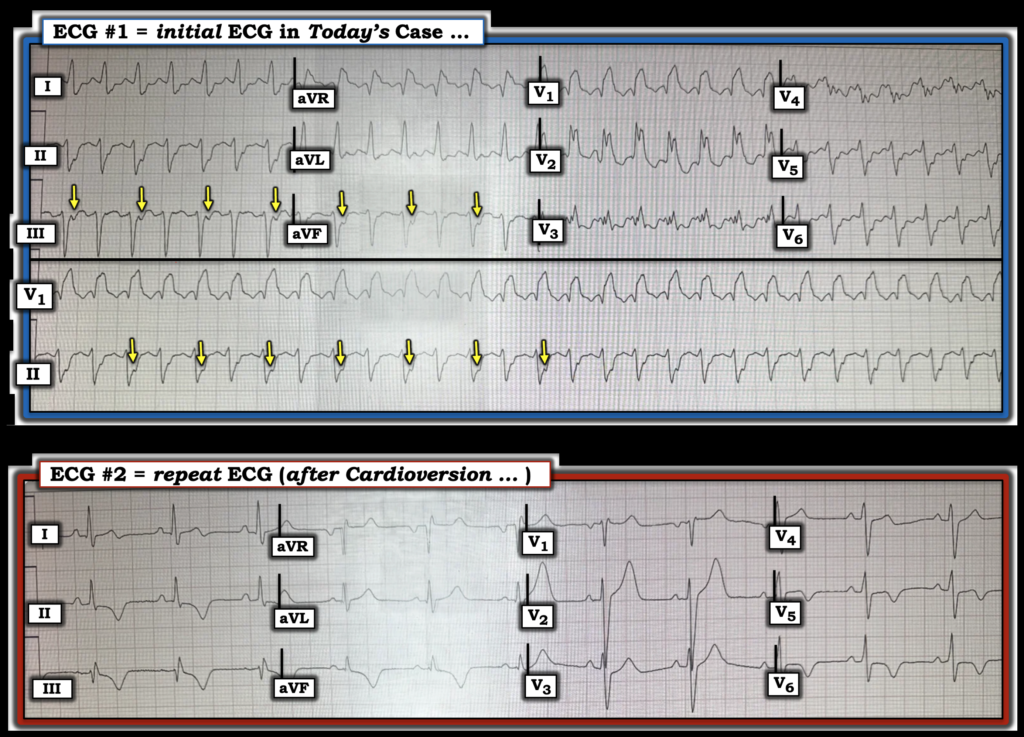
I believe there are retrograde P waves in today’s initial ECG (YELLOW arrows in Figure-2). But unlike the 1:1 VA conduction that is most commonly seen when retrograde P waves are present — we only see retrograde P waves every-other-beat!
- Retrograde P waves are recognized by the presence of a consistent small negative deflection appearing after the QRS in one or more of the inferior leads. In Figure-2 — this is best seen in lead III, but it is also seen in leads II and aVF as a consistent deepening of the terminal part of every-other QRS complex (YELLOW arrows in lead aVF and the long lead II).
= = =
Figure-2: YELLOW arrows highlight retrograde P waves in the initial ECG. The bottom tracing in this Figure shows the repeat ECG after electrical cardioversion.
= = =
NOTE: Before proceeding with discussion of the clue of alternate beat retrograde conduction — it’s important to emphasize that providers in today’s case correctly managed this patient by their cautious trial of medical therapy (Adenosine was used) — but when this was not successful, they quickly reversed course with electrical cardioversion that converted the WCT to sinus rhythm, as shown in the repeat ECG at the bottom of Figure-2.
- Note significant narrowing of the QRS in ECG #2 — with this QRS in sinus rhythm looking nothing like the QRS during the WCT. In addition — there is no longer any fragmentation in ECG #2, providing further support that the WCT was indeed sustained VT.
- Note diffuse T wave inversion in this repeat ECG recorded after successful cardioversion. Instead of ischemia — I suspected this diffuse T wave inversion most likely represents a “memory” effect (that is commonly observed for hours up to a few days following a sustained tachyarrhythmia).
- PEARL: Cardiac catheterization would not necessarily be needed to prove a “memory” effect if T wave inversion resolves in timely fashion, Troponins are negative, normal LV function resumes and the patient returns to his pre-arrhythmia asymptomatic state.
- It turns out that cardiac cath was done on this patient — and as noted in Dr. Smith’s discussion above, the cath was negative for coronary disease. Final proof that this patient’s reduced EF (Ejection Fraction) was indeed the result prolonged episode(s) of sustained VT would then be forthcoming IF in the days-to-weeks following ablation, the EF returned to normal.
- NOTE: Any sustained tachyarrhythmia may result in a depressed EF — with the time for onset of this tachycardia-induced cardiomyopathy being as short as 3 days! (Huizar et al — JACC 73(18):2328-2344, 2019 ).
= = =
Significance of Intermittent Retrograde Conduction
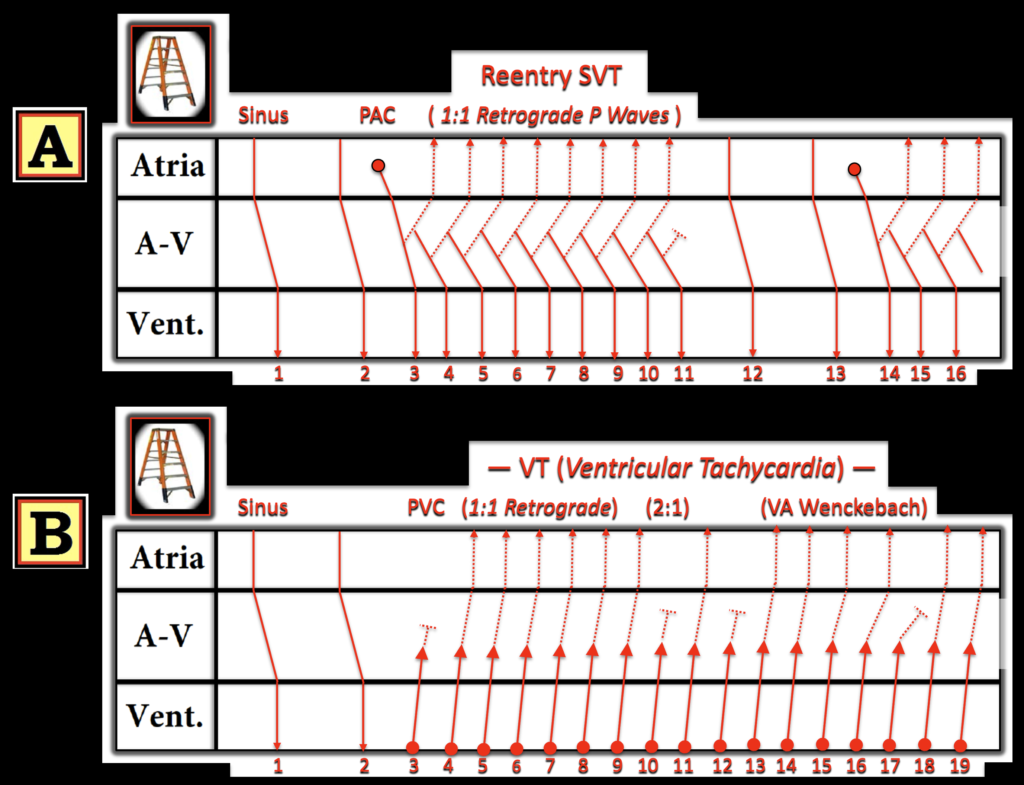
In Figure-3 — I’ve drawn theoretical laddergrams to illustrate why the presence of intermittent retrograde conduction that does not disturb the regularity of a WCT rhythm is virtually diagnostic of VT (Roig et al — Circulation 153(15), 2026 — and — Pilecky et al — Eur Heart J 7:1-2, 2023).
- Panel A (Top laddergram in Figure-3) — A PAC (beat #3) is seen after 2 normal sinus beats. If the timing is “just right” — this PAC may initiate a reentry SVT rhythm (usually either AVNRT or AVRT). But because reentry SVT rhythms are dependent on continued retrograde conduction (dotted lines during the SVT run from beat #3-thru-11) — the reentry SVT will abruptly end if for any reason retrograde conduction fails (as it does here in this theoretical laddergram after beat #11).
- Panel B (Bottom laddergram in Figure-3) — Following 2 sinus beats, a run of VT begins with beat #3. I’ve drawn in some different possibilities for different VA conduction ratios. It should be apparent in Panel B that regardless if 1:1 VA conduction persists (as it does from beats #4-to-9) — or is intermittent with a 2:1 VA conduction ratio (as it is from beats #9-to-12) — or manifests retrograde Wenckebach conduction with progressive RP’ prolongation until retrograde conduction fails (as occurs from beats #13-to-17) — the regularity of the VT rhythm is unaffected! This proves that ventricular activation is independent of atrial activity — thereby essentially confirming VT by eliminating the possibility of a reentry SVT that is dependent on persistence of retrograde conduction with a reentry circuit.
= ==
Figure-3: Theoretical laddergrams illustrating the expected effect of intermittent retrograde conduction on a reentry SVT vs the effect on VT.
= = =
Final Thoughts on Today’s CASE:
Intermittent block of retrograde conduction (be this by retrograde Wenckebach or other intermittent VA conduction phenomenon) is not a common occurrence. But it does occur (as in today’s case) — and you can detect it if looked for.
- As seen in Figure-2 — the fact that the WCT rhythm maintains a regular ventricular rate despite a failure to conduct retrograde with every beat proves that the WCT rhythm is sustained VT (with the rare exception of a wide junctional tachycardia that conducts retrograde).
- Clinically, in today’s case — this subtle informative clue was not needed to determine an optimal management plan because the patient’s unstable hemodynamic status dictated the need for electrical cardioversion regardless of whether today’s initial rhythm was VT or an SVT.
= = =
== = =
= = =