A 60-something had sudden chest pain and called 911 after about 2 1/2 hours.
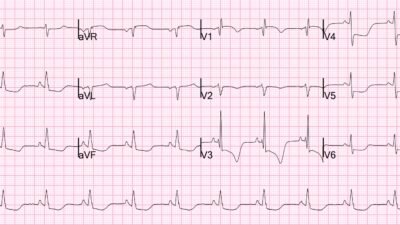
Medics recorded this ECG:
What do you think?
There are hyperacute inferior T-waves and reciprocal T-wave inversion in aVL, all but diagnostic. But then there is also the associated posterior OMI: STD in leads V2-V5, maximal in leads V3-4.
Prehospital ECG is subtle but diagnostic of OMI.
The PMcardio Queen of Hearts AI ECG Model was not used, but this is what she would have shown:
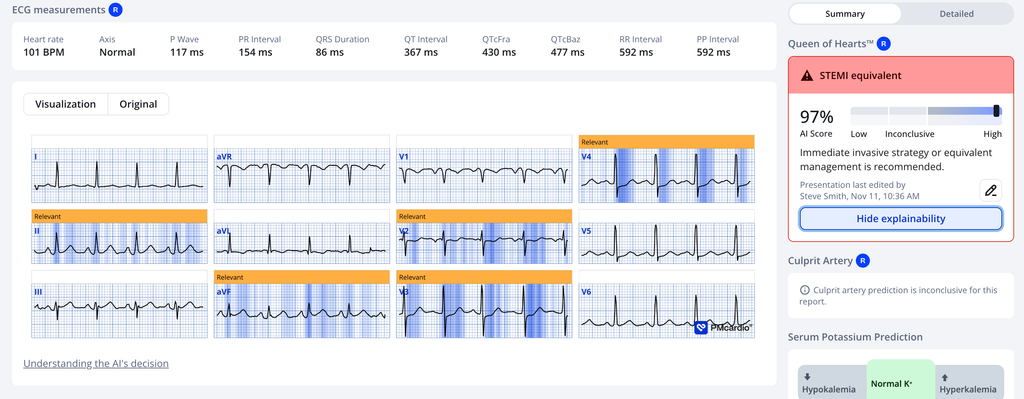
The Queen gets it.
Medics did not see the inferior posterior OMI. They transported to a non-urgent bed in the ED.
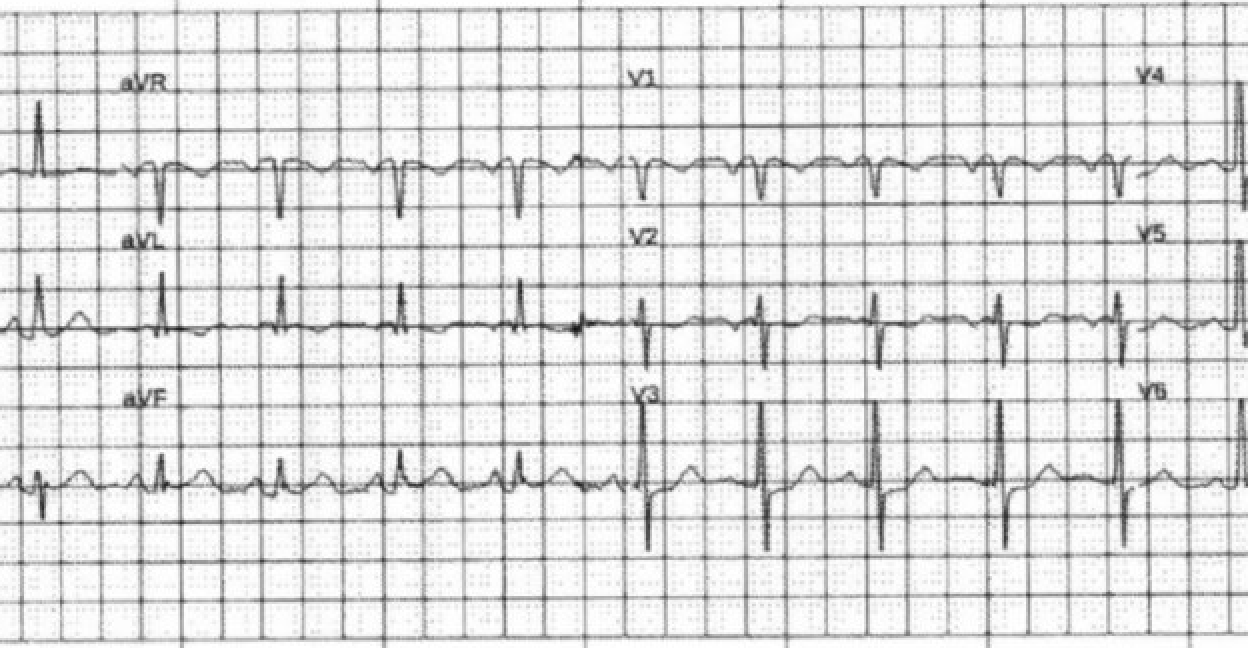
In the ED, this ECG was recorded 35 minutes after the prehospital ECG:
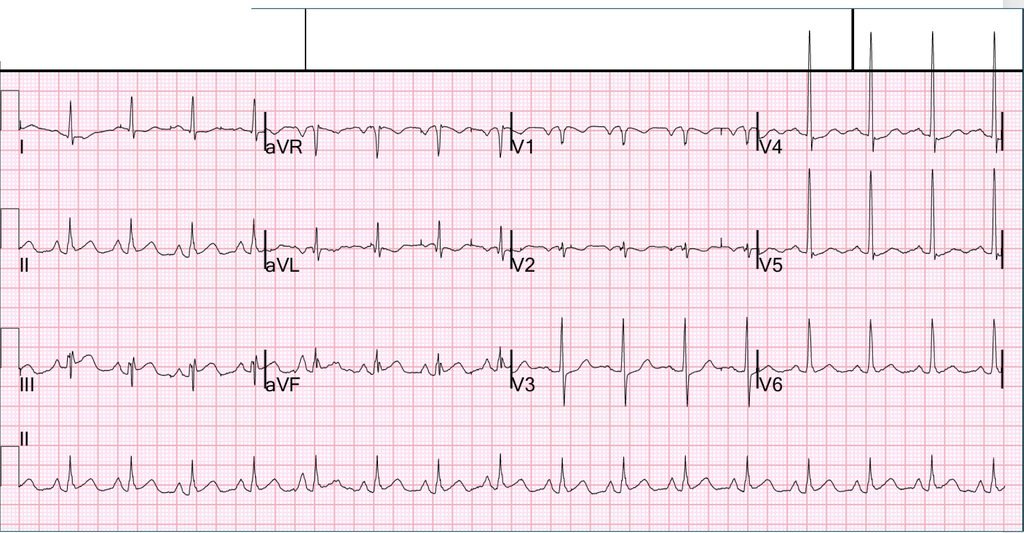
What do you think? This was interpreted by the interventionalist, even after the angiogram, as “Nonspecific ST-T abnormalities”
This ED ECG is even more diagnostic! The providers used the Queen of Hearts and found this:
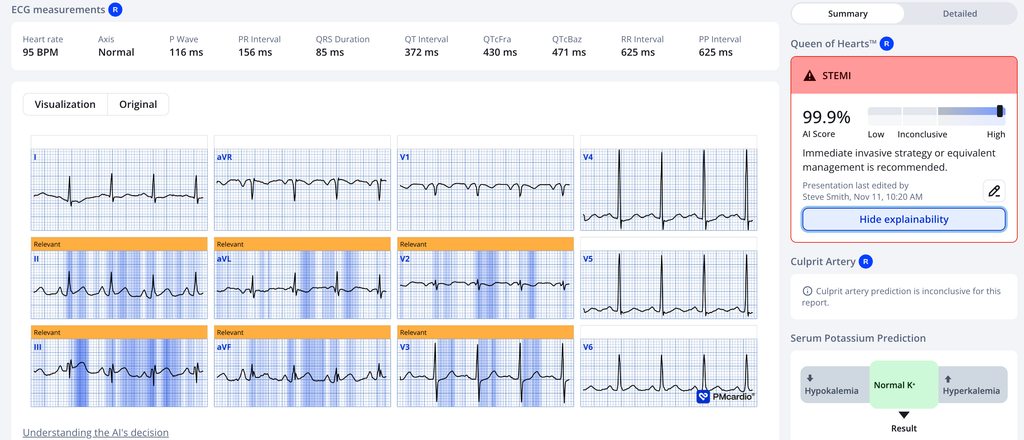
With this Queen result, the patient was transferred to the critical care area and the cath lab was activated.
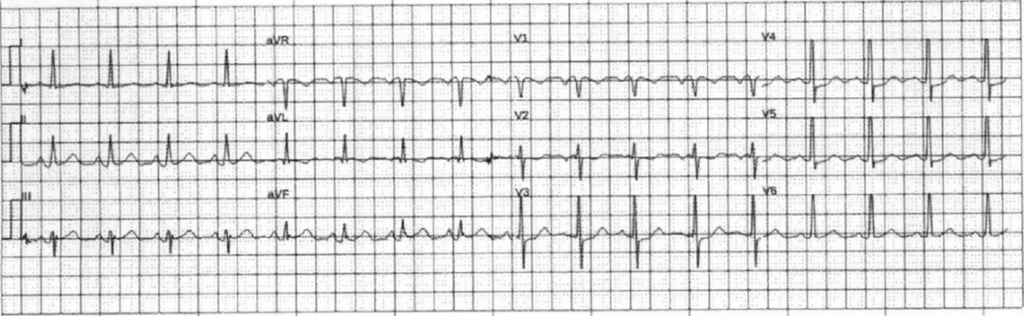
Another ECG was recorded before the angiogram, 45 minutes after the first ED ECG, as the pain had decreased from 8/10 to 2/10:
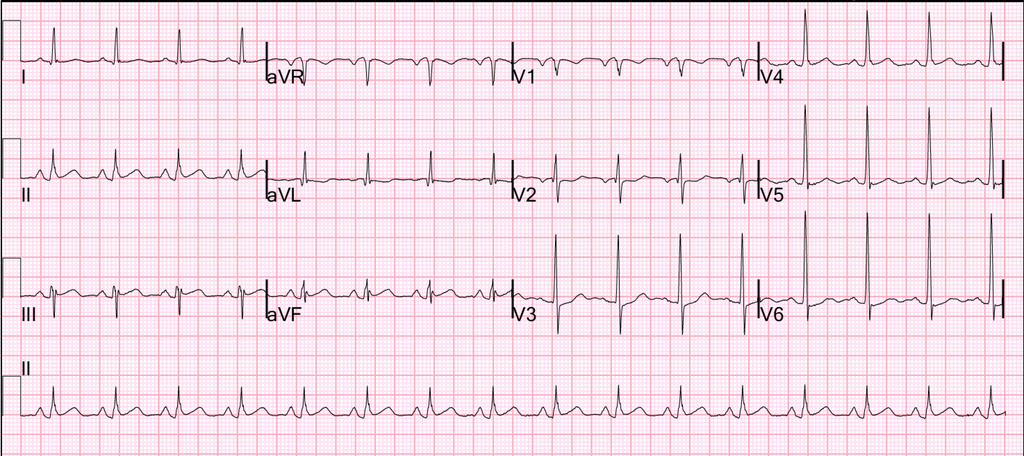
It is still diagnostic, but less obvious
This was also interpreted as “nonspecific ST-T abnormalities by the interventionalist”
Here is the Queen again:
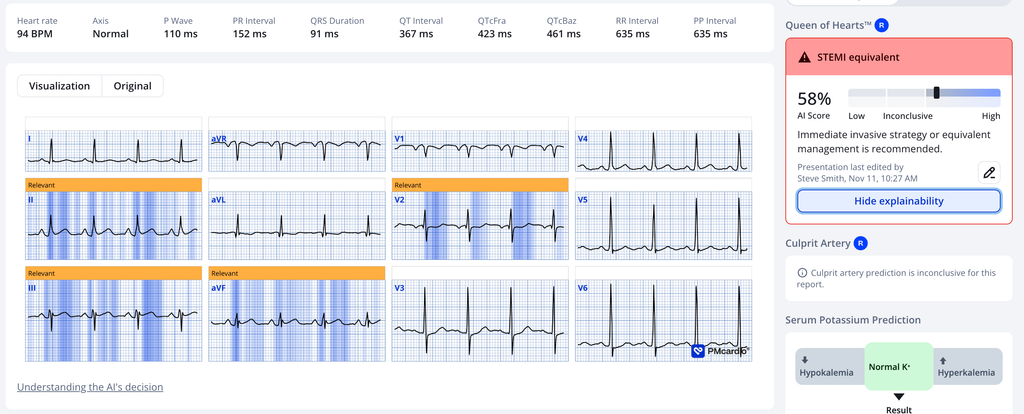
Again, she sees the inferior posterior OMI
I could not find the door to balloon time.
In any case, a prehospital activation based on Queen would have saved more than 30 minutes.
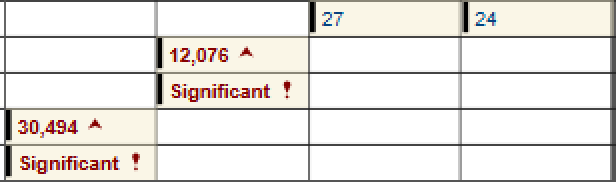
It turned out to be a very large MI with peak trop > 30,000 ng/L
But door to balloon time is measured from the first “STEMI” ECG (not from the first ECG diagnosed as OMI), so the door to balloon time is universally underestimated.
The SUBZERO study, done by Pendell, was presented at TCT. TCT-333 An Artificial Intelligence ECG Model Predicts Subsequent-ECG STEMI on the Initial “Nondiagnostic” Time-Zero ECG: The SUBZERO Multicenter U.S. Registry Study.
In this study of 8000 STEMI patients, 1008 had an initial “nondiagnostic” ECG. The Queen of Hearts would have made the diagnosis of OMI on 70% of these, saving 57 minutes of door to balloon time and identifying OMI 150 minutes earlier on 57 of 73 patients who died!
Post PCI ECG 165 minutes after the first ED ECG:
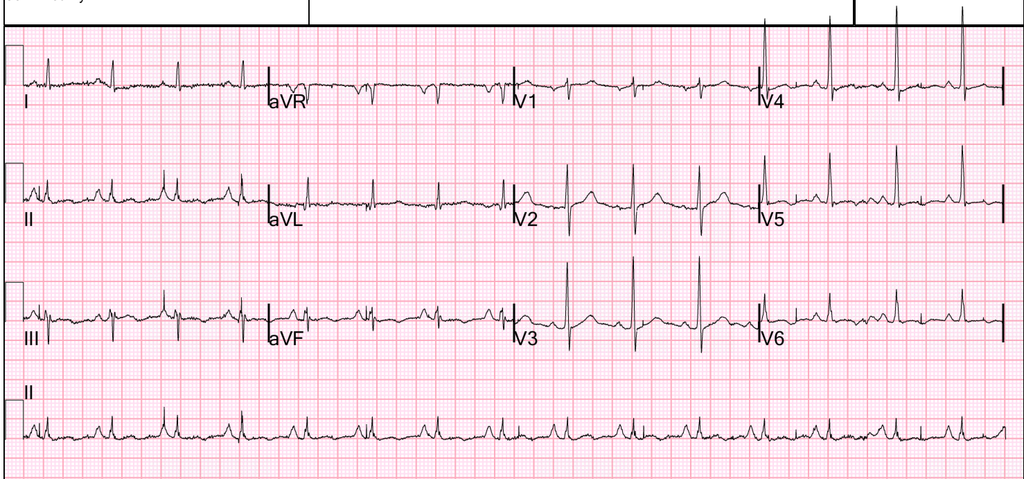
This has T-wave inversion consistent with spontaneous reperfusion (patient was lucky).
Here is the Queen on this last ECG:
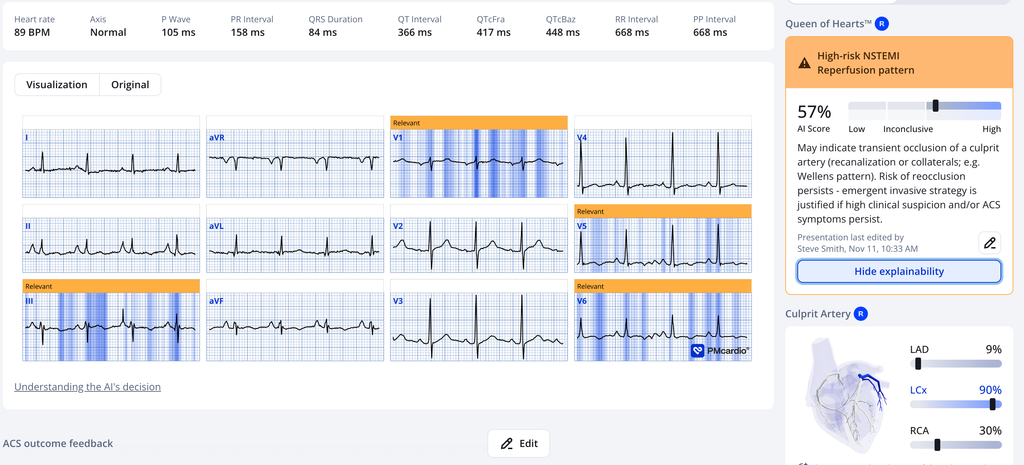
= = =
Troponin profile, drawn every 2 hours. First is on far right:
Angiogram:
- LCx: Circumflex is a medium to large caliber vessel.
- OM-1 is tiny; OM-2 is a medium to large caliber vessel with tubular 30% stenosis in the ostium.
- There is a 95% stenosis in the distal circumflex with TIMI-3 flow beyond. Distal circumflex supplies a medium to large caliber branching LPL.
- Lesion on Dist CX: 95% stenosis 16 mm length reduced to 0%. Pre-procedure TIMI III flow was noted. Post Procedure TIMI III flow was present. Good run off was present. The lesion was diagnosed as a moderate risk lesion. The lesion was tubular and eccentric. The lesion showed evidence of thrombus presence, with smooth contour, moderate angulation and moderate tortuosity. Lesion plaque is ruptured.
= = =
Echo:
- The estimated left ventricular ejection fraction is 56%.
- Regional wall motion abnormality-basal and mid inferolateral and basal anterolateral, hypokinetic.
Notice that the first 2 troponins were below the URL, and that the delta was only 3 ng/L. This patient might have ruled out for MI by troponins!
The interventionalist interpretation of “Non-diagnostic ECG” plus 2 negative trops with small delta: you might discharge this patient!!
See this post with a “Non-diagnostic ECG” and 2 troponins below the URL: Queen of Hearts Now FDA Approved!! What’s her take on this “Non-diagnostic” ECG?
= = =
======================================
MY Comment, by KEN GRAUER, MD (11/16/2026 ):
Today’s case provides an insightful example of how helpful it can be to correlate serial ECGs to the presence and severity of CP (Chest Pain).
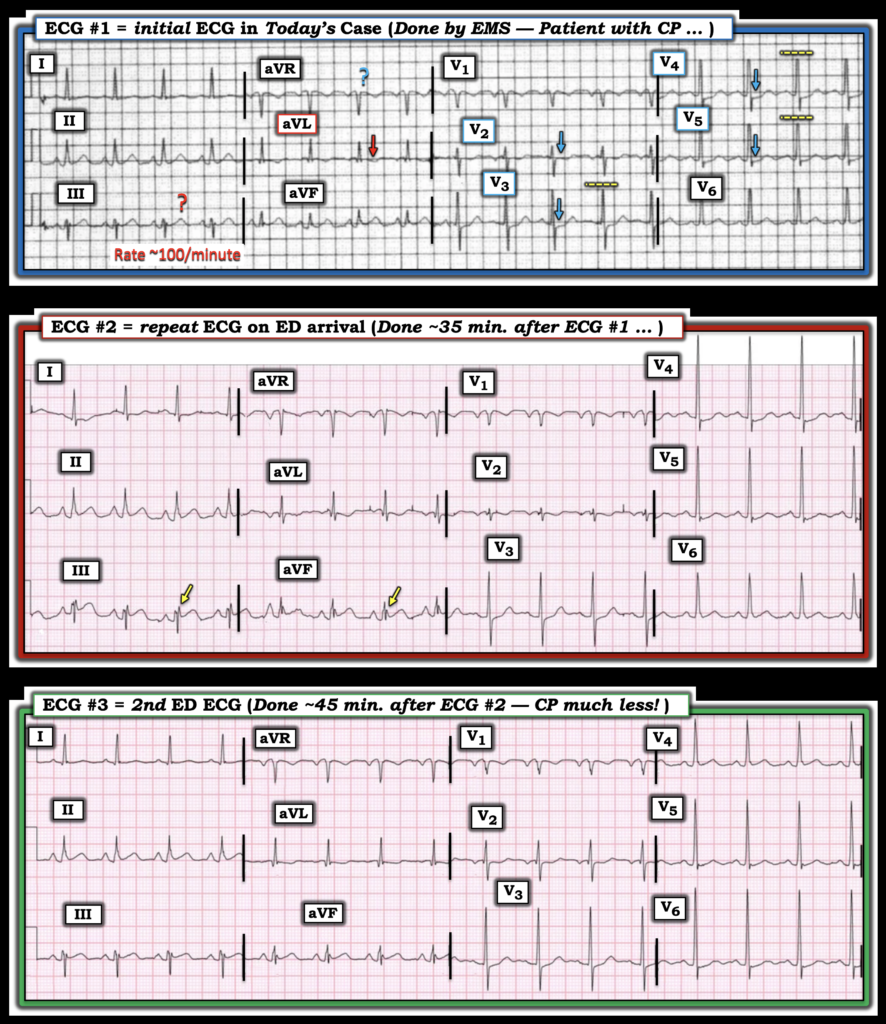
- For clarity in Figure-1 — I’ve reproduced the first 3 ECGs in today’s case.
= = =
The initial ECG …
The patient in today’s case is a 60-something man who called EMS for sudden-onset of severe CP (Chest Pain). The CP was ongoing for 2+ hours at the time medics arrived, with “some reduction” in the severity of his symptoms following administration of SL nitroglycerin.
- As per Dr. Smith — the initial ECG in Figure-1 shows subtle-but-worrisome findings given the history of sudden persistent CP.
- The rhythm is sinus tachycardia at a rate of ~100/minute. As noted often in Dr. Smith’s ECG Blog — uncomplicated OMI is usually not associated with tachycardia — such that the presence of a rapid heart rate should always raise consideration of some complicating factor.
- My “eye” was drawn to ST depression in leads V2-thru-V5 (BLUE arrows in these leads). In this context — the subtle ST coving with T wave inversion in neighboring lead V1 that by itself might not necessarily be abnormal, may be part of the process.
- ST depression is maximal in leads V3,V4 — which in this patient with new CP clearly raises concern about acute posterior OMI. This finding by itself already suggests that prompt cath will be indicated.
I was less certain about the significance of ST-T wave findings in the limb leads of ECG #1:
- I was unsure if the size of inferior lead T waves was increased enough in this patient with tachycardia to indicate hyperacuity — but (as per Dr. Smith) — the shallow-but-definitely inverted T wave in lead aVL was clearly an abnormal finding (RED arrow in this lead).
- In favor of posterior OMI (and against the diagnosis of DSI = Diffuse Subendocardial Ischemia) was the lack of ST elevation in lead aVR.
- Bottom Line: In this patient with new-onset CP — prompt cath is almost certain to be indicated. The role of EMS in this setting is to ensure hemodynamic stability and transport the patient to the hospital as quickly as possible.
QUESTION: Did you realize that R wave amplitudes are truncated at 10 mm in at least 3 of the chest leads? (broken YELLOW lines in leads V3,4,5 of Figure-1).
- As discussed in My Comment in the June 20, 2020 post, among many other posts — there is a limit to the amount of voltage that prehospital ECGs in most EMS systems are able to display. As a result — QRS amplitudes are automatically truncated once they exceed that limit, that in U.S. EMS systems is usually 10 mm.
= = =
Figure-1: To facilitate compaison between the first 3 ECGs in today’s case — I put these 3 tracings together.
= = =
The repeat ECG on arrival in the ED …
Because the acuity of the initial ECG was not recognized by the EMS team — the patient was transported to a non-urgent bed in the ED. The repeat ECG performed on arrival in the ED ( = the middle tracing in Figure-1) — was interpreted by the interventionalist as showing, “nonspecific ST-T wave abnormalities”. But important findings were missed both by EMS providers and the interventionalist!
- KEY Point: If doubt was present regarding the acuity of today’s case — it could have been easily resolved by the simple step of putting ECG #1 and ECG #2 together — and applying lead-by-lead comparison of these serial ECGs.
- The heart rate remains ~100/minute in ECG #2. The frontal plane axis is essentially the same as it was in ECG #1. Therefore — lead-by-lead comparison between these 2 tracings is valid. Doing so should render it obvious that there is now ST elevation in lead III (and to a lesser extent in lead aVF) that was not present in ECG #1.
- ST segment depression persists in the chest leads of ECG #2 (perhaps increased in lead V2 — and still maximal in leads V3,V4).
- Note the significant increase in R wave amplitude in leads V3,V4,V5 — now that the automatic truncation of R wave amplitudes imposed on prehospital tracings is no longer enacted on this hospital ECG.
- Bottom Line: At least in leads III and aVF — the increase in ST elevation that is now clearly seen represents a “dynamic“ ST-T wave change that in this patient with new CP is clear indication for prompt cath.
= = =
The 2nd ED ECG …
The “good news” — is that QOH finally convinced providers of the likelihood of an ongoing acute event, such that the cath lab was now activated. At this time — another repeat ECG was obtained ( = ECG #3 in Figure-1, at which time the patient’s CP had markedly decreased).
- KEY Point: Once again — the simple step of putting ECG #2 and ECG #3 together — and applying lead-by-lead comparison of these serial ECGs was clearly not done — since if it had been done, providers could not have missed the finding of less ST elevation in leads III and aVF in ECG #3 (that correlates with the marked reduction in this patient’s CP).
- This clinical correlation of the presence and severity of CP to lead-by-lead comparison of ECG findings is absolutely diagnostic of “dynamic” ST-T wave changes in this patient with an ongoing extensive acute OMI.
= = =
P.S.: Could there be “N“-Waves?
In retrospect — I wondered if there are N waves in leads III and aVF in Figure-1 (best seen as highlighted by the YELLOW arrows in ECG #2).
We’ve made mention of N waves on occasion in this Blog (See the May 6, 2018 post). I thought the spikes at the end of the QRS in inferior leads III and aVF in Figure-1 look similar to those in the initial ECG from this May 6, 2018 post. Literature on the N-wave phenomenon is limited — though I found informative articles by Niu et al (Int. J Cardiol 162(2):107-111, 2013 ) and Yang et al (Clin Cardiol 43(5):491-499, 2020).
- The N wave is defined as a notch or deflection in the terminal part of the QRS. The height of the notch or deflection should be ≥2mm (the point of deflection being measured with reference to the PR segment).
- The QRS in leads with the notch is often prolonged.
- The notch tends to be transient (often disappearing in less than 24 hours — especially once there has been reperfusion).
- Physiologically — the N wave is felt to represent the delayed activation wave of the left ventricular basal region which the LCx (Left Circumflex) artery supplies. This explains why the transient presence of the N wave in one or more of the inferior or high-lateral leads often serves a marker of a LCx “culprit” artery.
- The reason the N wave appears in the latter part of the QRS complex — is because the posterior/basal wall is the last part of the LV to depolarize.
- When present, the N wave is often associated with acute ischemia in the absence of ST elevation. This is because the anatomic area supplied by the LCx is often not well visualized by any of the 12 leads on a standard ECG.
- There’s a tendency for the development of N waves in an acute cardiac syndrome to be associated with higher Troponin values and poorer outcome.
- Acknowledgment: I’m still uncertain about my ability to recognize N waves. To emphasize that in today’s case, whether present or not — N waves don’t alter the above noted findings of “dynamic” ST-T wave changes and the need for prompt cath. But clinical circumstances in today’s case “fit” the limited knowledge on N waves addressed in the literature (ie, critical LCx disease; minimal ST elevation on ECG; marked Troponin elevation).
- N waves are described as a transient phenomenon, often resolving shortly after reperfusion.
- I’d feel more comfortable about my suspicion re N waves in today’s case if the sharp inferior lead deflections in Figure-1 were not present on a previous baseline tracing — and if they disappeared over the next day or two after reperfusion.
= = =
= = =