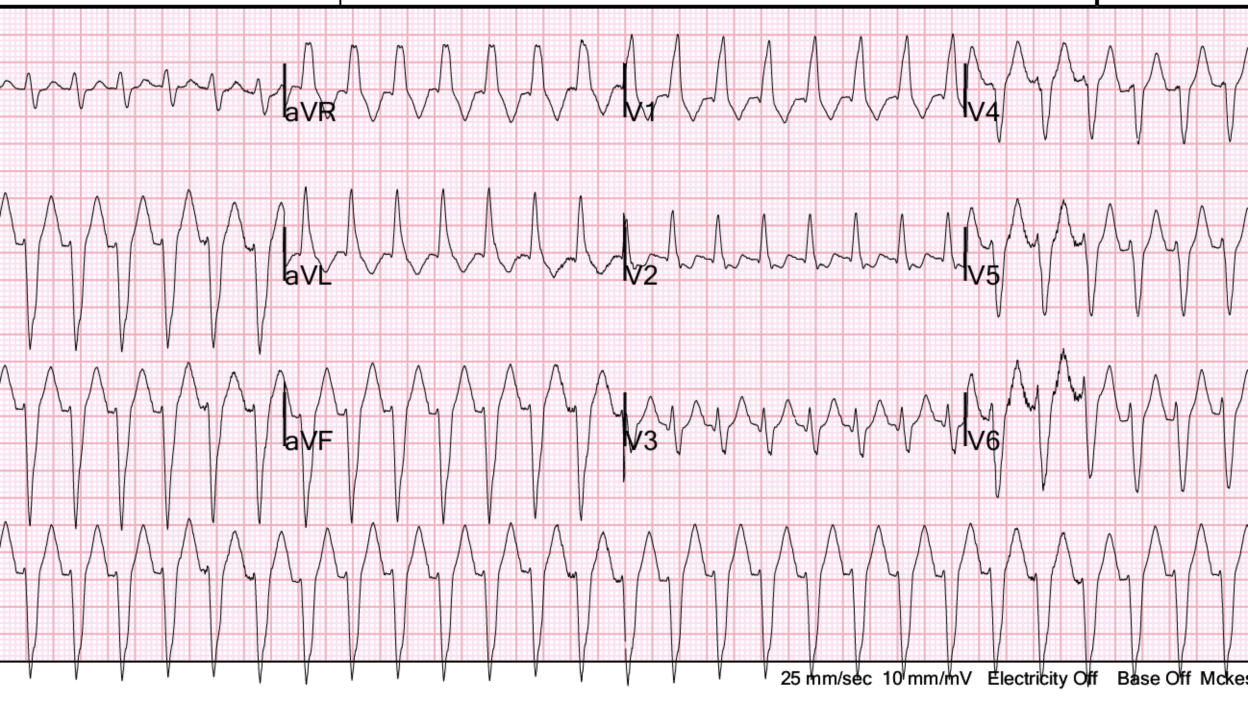
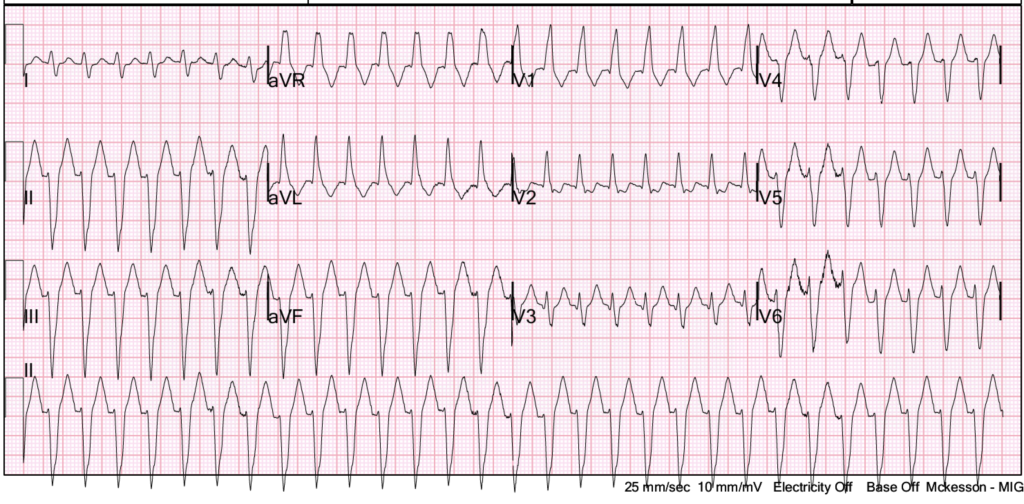
This ECG was sent to me with the following message:
“60-something with dyspnea. Tried adenosine 12 mg x 2 (didn’t do anything – no pause of change on monitor). Tried 200 Joule electrical cardioversion x 2 without effect. Blood pressure is OK.”
What do you think?
What is it and what would you do?
I said that this was typical posterior fascicular VT because it has RBBB and LAFB morphology. If there is good LV function (and in this case the providers indicated that bedside echo had good function), then verapamil is the treatment of choice.
See Ken Grauer’s detailed analysis below.
They gave metoprolol and had success. This is not common in posterior fascicular VT.
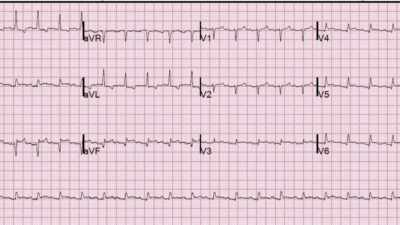
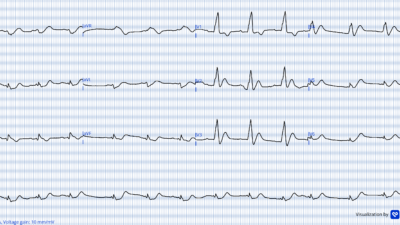
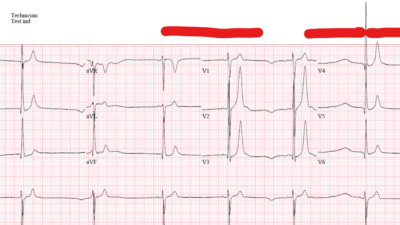
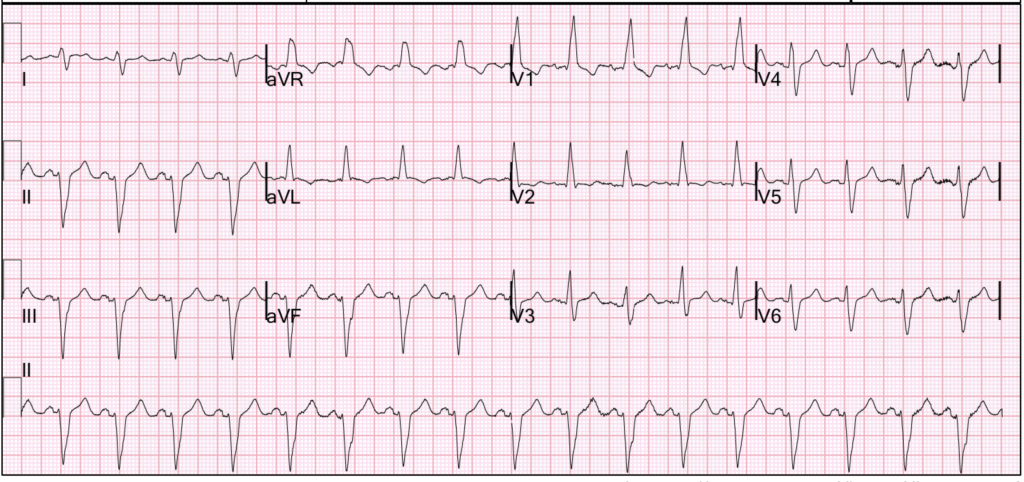
Later, I went into the chart. I looked for previous ECGs and this is what they all showed:
What do you see?
When the patient is in sinus rhythm, he has RBBB and LAFB!
That proves that 1) this was not posterior fascicular VT and 2) that it was SVT with pre-existing RBBB/LAFB.
Ironically, if electricity and adenosine are not working, then verapamil is again a great choice. But first one should try a higher dose of adenosine. At least 18 mg.
Learning Points:
When you have a tachydysrhythmia, always look at the previous ECGs, if available. Any abnormal QRS morphology that is present in sinus will be present in SVT also.
Learn about the idiopathic ventricular tachycardia syndromes:
See this great post by Pendell: Idiopathic Ventricular Tachycardias for the EM Physician
More cases:
A 50-year old with palpitations. How will you treat?
A 12 year old with Wide Complex Tachycardia
Another “Idiopathic VT, Right Ventricular Outflow Tract VT, or RVOT VT“: Wide Complex Tachycardia, intermittent
= = =
==================================
MY Comment, by KEN GRAUER, MD (8/23/2026):
Today’s case by Dr. Smith reminds us that even when our approach to an arrhythmia is optimal — we will not always arrive at the correct answer.
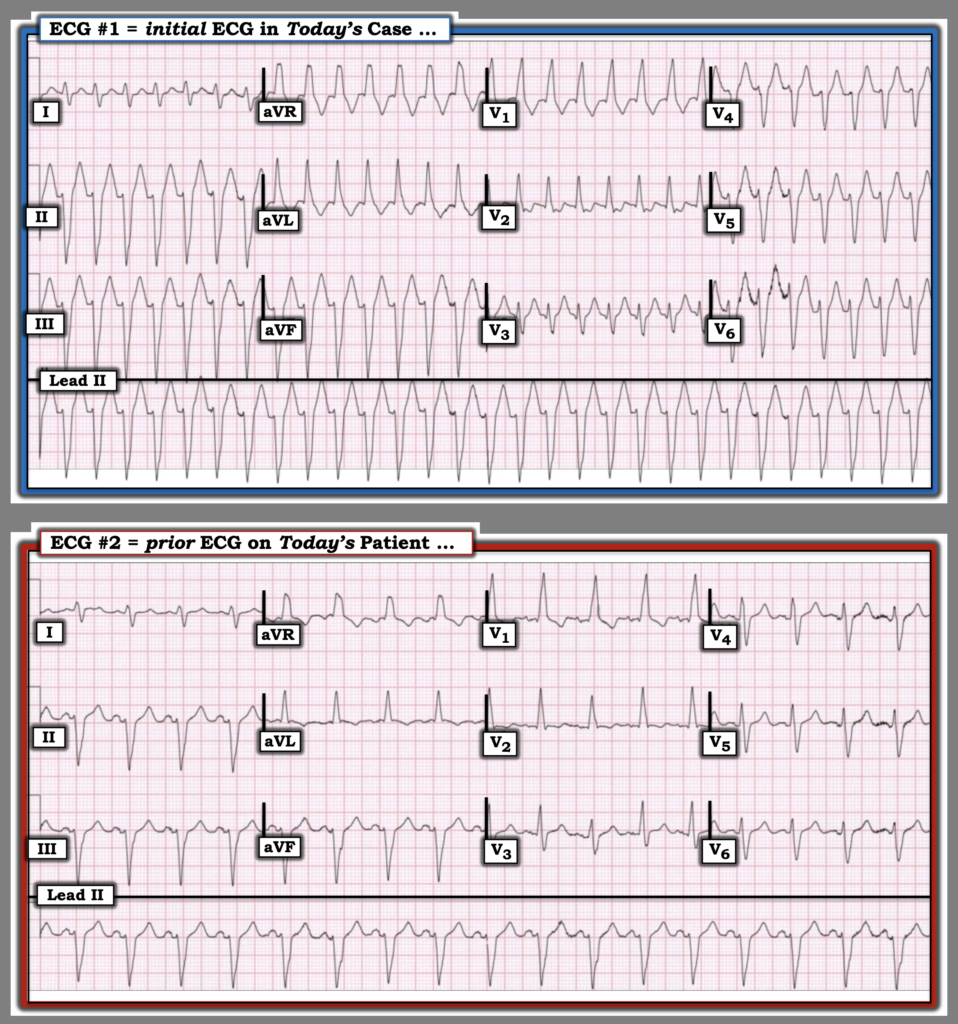
- For clarity (and to facilitate comparison) in Figure-1 — I’ve put both ECGs from today’s case together.
= = =
Why Does ECG #1 look like Fascicular VT?
My impression of today’s initial ECG was the same as Dr. Smith’s impression — namely, that the rhythm of this tracing looks almost certain to be fascicular VT. But as “correct” as our impression of VT may have been — it turned out to be wrong. Looking systematically — my approach to this tracing went as follows:
- This initial ECG in today’s case (Top tracing in Figure-1) — represents a regular WCT (Wide-Complex Tachycardia) rhythm at ~180/minute, without clear sign of atrial activity. In an older adult (this man is over 60) — the statistical odds that a regular WCT without P waves will turn out to be VT approach 90%, even before we begin to assess QRS morphology. As a result — we correctly start with the assumption that this rhythm is “VTuntil proven otherwise”, knowing that we’ll be correct at least 90% of the time.
- Among the different types of VT — fascicular VT is a special form because: i) This is often an “idiopathic” form of VT, in which the patient does not have underlying structural heart disease; — ii) Fascicular VT is readily recognized because of its resemblance to the morphology of bifascicular block (ie, to either rbbb/lahb or rbbb/lphb morphology) — and, iii) This rhythm responds extremely well to IV Verapamil (See My Comment at the bottom of the page in the March 9, 2026 post for more on fascicular VT and other idiopathic VT forms).
= = =
With regard to the regular WCT rhythm that we see in Figure-1 — the principal differential diagnosisis between: i) VT, VT, VT; — vs — ii) Some form of SVT rhythm with either preexisting bundle branch block or rate-related aberrant conduction.
- KEY Point: Most of the time — QRS morphology with rate-related aberrant conduction will resemble some form of conduction defect (ie, RBBB, LBBB, left anterior or posterior hemiblock, RBBB with one of the hemiblocks).
- If QRS morphology during a regular WCT does not resemble any of the above-mentioned recognizable forms of conduction defect — then this favors VT as the cause (and statistical likelihood of VT increases to above 90%).
= = =
The above said — Although QRS morphology in today’s initial ECG does resemble the bifascicular block pattern of RBBB/LAHB — there are some subtle atypical features for a supraventricular form of rbbb/lahb conduction. This was the reason I first suspected that ECG #1 most likely represented fascicular VT. These atypical features are subtle (!) — and include the following:
- Although the qR pattern of the QRS in lead V1 of today’s initial ECG is consistent with RBBB — the lack of a triphasic (rsR’ ) pattern in lead V1 means that we cannot reliably distinguish between rbbb conduction vs left ventricular ectopy.
- Usually with rbbb conduction — more of a rbbb configuration persists than what I see in lead V3 of ECG #1.
- The finding of 3 consecutive leads in V4,V5,V6 that look nearly identical with a predominant tiny-r/deep S configuration seems much more likely to be seen with VT than with supraventricular rbbb conduction.
- The initial r wave in each of the inferior leads is tiny, with a very deep S wave. This seems more likely to be seen with VT than with supraventricular rbbb conduction.
- The rs complex in lead I is unexpectedly small and isoelectric, which makes for a frontal plane axis of about -90 degrees — which seems more likely to be seen with VT than with supraventricular rbbb conduction.
- My overall “Gestalt” of ECG #1 being that although this could represent a supraventricular rhythm if this patient’s baseline ECG was similarly abnormal — I thought that far less likely than the probability that the rhythm was fascicular VT.
= = =
Figure-1: Comparison between the 2 ECGs in today’s case.
= = =
ECG Interpretation can be Humbling …
And then Dr. Smith astutely looked in this patient’s medical record — and found a series of prior tracings that all looked similar to ECG #2 in Figure-1.
- Virtually all of the subtle findings I noted above that most of the time will be consistent with a ventricular etiology — turn out to be this patient’s “baseline” ECG features during sinus rhythm!
- These prior tracings prove that today’s initial ECG in fact represents a regular SVT at ~180/minute with preexisting RBBB/LAHB. At this rapid a rate — this almost certainly represents a reentry SVT (most likely AVNRT) — which explains successful medical cardioversion that was seen after IV Metoprolol.
- PEARL #1: We are told that “neither cardioversion nor Adenosine worked”. But we need to be skeptical of that description until we see hard copy documentation of continuous rhythm strips showing no response to cardioversion and Adensine.
- What is far more likely — is that there was short-lived transient slowing of the rhythm (cardioversion) — that then very quickly reverted back to the AVNRT. That’s because AVNRT almost always will at least transiently respond to cardioversion and/or Adenosine — but it often quickly reverts back to AVNRT unless a longer-acting medication like Metoprolol is started!
- The “Lesson”: Be sure to always record (and then go back and study those recordings) of what happens when you electrically cardiovert and/or medically cardiovert after giving Adenosine (ie, Usually you need to keep 60-90 seconds after giving Adenosine — until the drug is wearing off). If you don’t do that — then you’ll miss the key moments that reveal the transient diagnostic effect of Adenosine.
- PEARL #2: This patient’s baseline tracing is not “normal” — since it shows bifascicular block. And here he is again in the ED for another episode of AVNRT.
- Follow-up is needed to determine why he has RBBB/LAHB — and whether referral to EP cardiology might be needed for consideration of an ablation procedure.
= = =
Final Lesson-to-be-Learned!
I’ve been a student of QRS morphology in WCT rhythms for decades (See My Comment at the bottom of the page in the May 10, 2026 post — for just one of many examples of this in Dr. Smith’s ECG Blog). Over that time — I’ve found assessment of QRS morphology during a WCT rhythm to be impressively accurate in predicting whether or not VT is present.
- Not all patients read the textbook. Every now and then despite “atypical” QRS morphology — a patient may present in a regular WCT rhythm with atypical QRS morphology that identically matches their baseline ECG when in sinus rhythm (exactly as occurred in today’s case).
- That’s why whenever time allows — it’s important to look back at the patient’s medical chart (as Dr. Smith did in today’s case). And then go back and compare the patient’s baseline ECG with the QRS morphology that you see during the WCT rhythm!
= = =
Addendum (8/24/2026):
I received the following message from Dr. Martin Royle (to which I added slight edits):
“Hi Dr Grauer. I’m an electrophysiologist from the UK. I try and keep up with the Steve Smith website and obviously your expert analysis.
- The WCT rhythm in ECG #1, which was thought to be a fascicular VT, but had identical QRS findings in sinus rhythm — was labeled SVT with pre-existing RBBB/LAFB.
- The RBBB is clearly atypical in this case, and you touch on this. The main reason the RBBB looks atypical — is that it isn’t. Instead — it looks like LSFB (Left Septal Fascicular Block), with in addition LAFB.
- In LSFB — there are very dominant anterior forces, and hence the large R waves in lead V1.
- This suggests in today’s case that the LPF is the only healthy part of the LBB, and is very sturdy as LBBB does not develop during SVT.
- This is why the term “hemiblock” is outdated and wrong — as there are often 3 fascicles. Best wishes — Martin”.
My Reply: My sincere appreciation to Dr. Royle for his astute and insightful comment on today’s post. Although the question, “Left Septal Fascicular Bloc: Myth or Reality?”, has prompted controversy for many years — there is increasing support from anatomic studies that indicate LSFB is indeed real, albeit often ignored by even experienced interpreters.
I believe the reason for the controversy is immediately evident on review of LSFB in the manuscript by MacAlpin (Indian Pacing Electrophysiol J:3(3):157-177, 2003):
- Dr. MacAlpin highlights evidence from anatomic studies suggesting that in most humans, the LBB (Left Bundle Branch) divides into 3 (not 2) fascicles = the LAF (Left Anterior Fascicle) — the LPF (Left Posterior Fascicle) — and the median or septal fascicle (the LSF). As emphasized in Dr. Royle’s email to me — the term “hemi”-block is outdated and wrong, because there usually are 3 fascicles.
- The above said — the sample of histologic reconstructions performed by Demoulin and Kulbertus (that I show below in Figure-2) highlights the marked potential anatomic variation that may be seen in LBB anatomy. While details of these anatomic variants exceed the scope of today’s ECG Blog post (and also exceed my expertise in this area) — the multiple and variable criteria for LSFB cited by MacAlpin reflect both this potential for anatomic variation of the LSF, as well as the effect that additional conduction damage to the LAF, LPF and/or RBB may have when compared to diagnostic criteria for recognizing isolated LSFB. In a word, while fully acknowledging the existence of LSFB — I find it hard to recognize this conduction defect.
- The 2 criteria for LSFB that I find easiest to conceptualize and remember are: i) Loss of septal q waves in inferior and/or lateral leads (when prior to onset of LSFB those leads initially did manifest septal q waves); — and, ii) An increase in anterior forces (which as noted by Dr. Royle — may explain the tall, monophasic R waves in leads V1 and V2 for both of the tracings in Figure-1).
- Dr. Royle points out that there appears to be a bifascicular block (LSFB + LAHB) in today’s case. Whether in addition to LSFB/LAHB there is also a component of RBB delay I think is uncertain from Figure-1 alone.
- NOTE: For readers interested in some examples of ECG tracings illustrating LSFB — Check out Figures-3 through -12 in the above cited MacAlpin article.
- Bottom Line: I find Dr. Royle’s suggestion of LSFB insightful for explaining the atypical ECG features for supraventricular conduction in today’s case that I alluded to above in My Comment — this being all the more reason for always considering the possibility of a markedly abnormal baseline tracing when evaluating QRS morphology in a WCT rhythm. And, when a moment of time arrives — the value of seeking out the patient’s chart (as done by Dr. Smith) in search of a prior tracing for comparison.
= = =
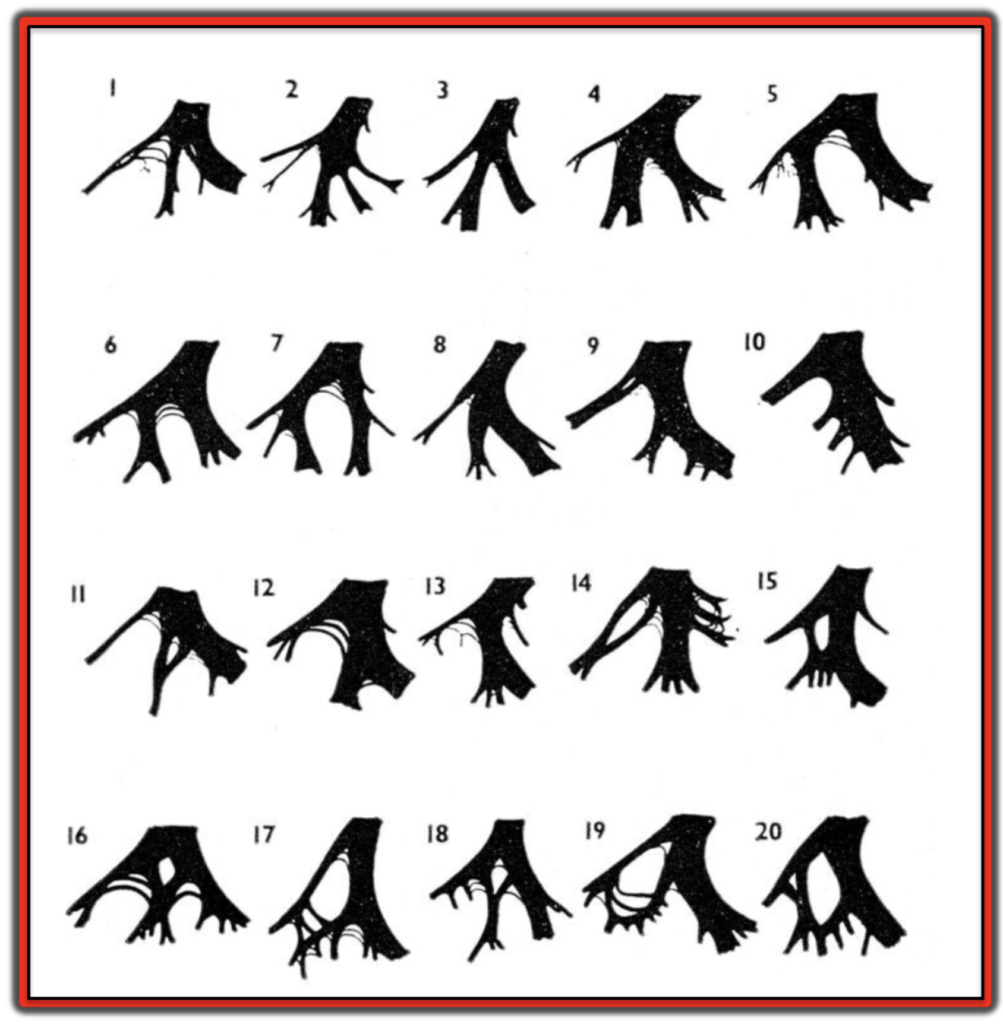
Figure-2: Depiction of the variation found in the left ventricular conduction system, based on anatomic derivation from serial histologic sections from 20 normal hearts. (This image excerpted from the above cited MacAlpin article — with credit to Demoulin and Kulbertus from their original 1972 publication in the British Heart Journal.)
= = =
= = =
= = =