Here is a classic ECG, presented and analyzed by Ken Grauer:
 |
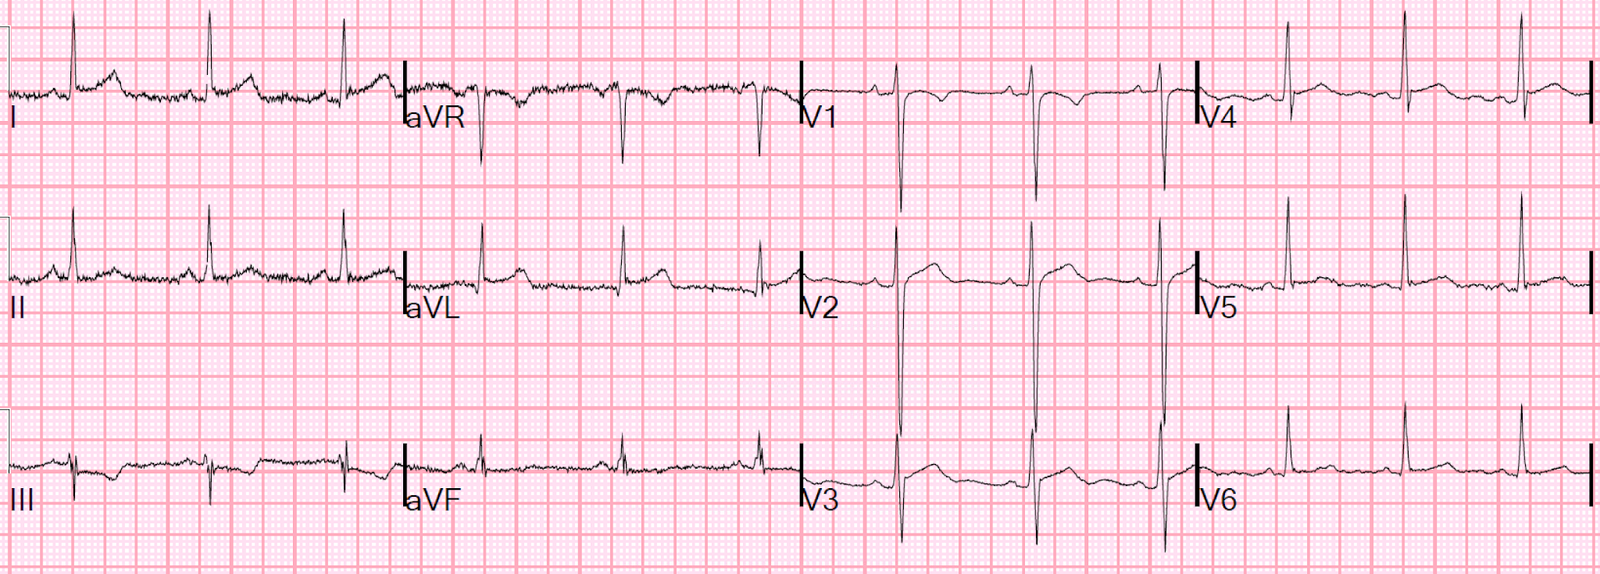
| Figure-1: The initial ECG in this case, obtained by the EMS team (See text). |
===================================
MY Comment by KEN GRAUER, MD (5/5/2020):
===================================
The 12-lead ECG in Figure-1 was obtained from a woman in her 80s who was seen by EMS for symptoms of new confusion and hypotension. She had a history of an MI in the past.
- WHAT is the rhythm in ECG #1?
- How certain are you of your diagnosis?
======================================
Smith’s comment on management:
First, what do you want to do?
The patient has confusion and hypotension, so she is in shock. And she has a regular wide complex tachycardia that cannot be sinus (because it is rate 180 and she is 80 years old).
Therefore, cardiovert immediately.
Assuming this works, then you can proceed to analyze the 12-lead
–If it is SVT with aberrancy or VT, electrical cardioversion should do the job.
–Consider etomidate or ketamine sedation, depending on how “confused” or awake she is.
–Adenosine is not contraindicated when there is reasonable probability that SVT is the etiology; that is not reasonable here, as Ken will tell you below.
–If cardioversion does not work (or the rhythm recurs after successful conversion), then an anti-dysrhythmic to treat (or prevent) needs to be given, and/or the underlying etiology needs to be reversed (e.g., acute coronary syndrome).
Choice of anti-dysrhythmic for recurrent refractory or recurrent VT is beyond the scope of this blog post, but you can start by looking at the Procamio study for stable VT: procainamide was better than amiodarone. In short, the literature on pharmacologic therapy for VT is terrible, whether using it for stable VT, refractory VT, or recurrent VT.
======================================
Ken Grauer on the ECG:
===================================
MY Comment by KEN GRAUER, MD (5/5/2020):
===================================
MY THOUGHTS on ECG #1: The ECG in Figure-1 shows a regular WCT (Wide-Complex Tachycardia) Rhythm at ~220/minute, without clear sign of atrial activity.
- PEARL #1: Even before you look any further at this ECG — statistical odds that a regular WCT rhythm without atrial activity is VT (especially given that this is an older patient with known history of coronary disease) — are at least 90%. This emphasizes the point that you have to prove that this rhythm is not VT — rather than the other way around. AVOID starting from the assumption that there is aberrant conduction … (SEE the April 15, 2020 post in Dr. Smith’s ECG Blog for another case in which I review my initial approach to a regular WCT rhythm).
Among the ECG Features I look to first for rapid distinction between an SVT rhythm (with QRS widening due to either preexisting BBB or aberrant conduction) vs VT are: i) Frontal plane axis during the WCT rhythm; ii) Resemblance to any known form of BBB or hemiblock; and, iii) Is there relative “delay” in the initial QRS deflection? Applying these features to ECG #1:
- Is there “extreme” Axis deviation? By this I mean — is the QRS complex during the WCT all negative in either lead I or lead aVF? To emphasize that this criterion is of no benefit in distinguishing between VT vs SVT if there is any positivity at all for the QRS complex in both of these leads. In ECG #1 — We see a fragmented, but all negative QRS complex in lead I! This means there is extreme axis deviation during the WCT rhythm (in this case, extreme right axis) — which allows you within a few seconds to increase statistical odds to ≥95% that this regular WCT rhythm without P waves is VT.
- Is there resemblance to any known form of conduction block? In ECG #1 — the QRS complex in lead V1 resembles RBBB morphology. That said — lack of any R wave in lead I, and lack of a wide terminal S wave in lead V6 negate the possibility of RBBB conduction. The nearly monophasic upright QRS complex in lateral lead V6 resembles LBBB morphology. But lack of a monophasic upright QRS in other lateral leads (I and aVL), and lack of predominant negativity in anterior leads negates the possibility of LBBB conduction. This means QRS morphology in ECG #1 does not resemble any form of known conduction defect! NOTE: Exceptions to this QRS morphology rule do exist — in that some patients may have an extremely abnormal baseline QRS morphology during sinus rhythm (and therefore an equally abnormal QRS morphology during tachycardia). That said — the overall bizarre QRS morphology we see in ECG #1 further increases statistical odds above the already high likelihood we previously established.
- Is there relative “delay” in the initial QRS deflection? SVT rhythms tend to manifest more rapid initial depolarization vectors — because supraventricular depolarization generally begins its path toward the ventricles by travel over established conduction pathways. A notable exception to this generality is when there is an AP (accessory pathway) that bypasses the AV node (ie, in a patient with WPW). That said — “relative delay” in the initial portion of the QRS complex in multiple leads favors VT. Although sophisticated research studies cite a number of indices with precise initial deflection time limits as “accurate” criteria for VT — in practice, making precise millimeter measurements of initial QRS deflections at the bedside of a crashing patient is both time-consuming, and extremely difficult to accomplish. Subjective measurements often suffice! In ECG #1 — Note the presence of relatively wide Q waves at the onset of the QRS complex in leads V1-thru-V5. Note that for each of these Q waves — the initial downsloping portion of these Q waves is angled instead of straight (ie, suggesting delay). This is consistent with VT.
- BOTTOM Line: The rhythm in ECG #1 is almost-certain-to-be VT. Treat the patient accordingly.
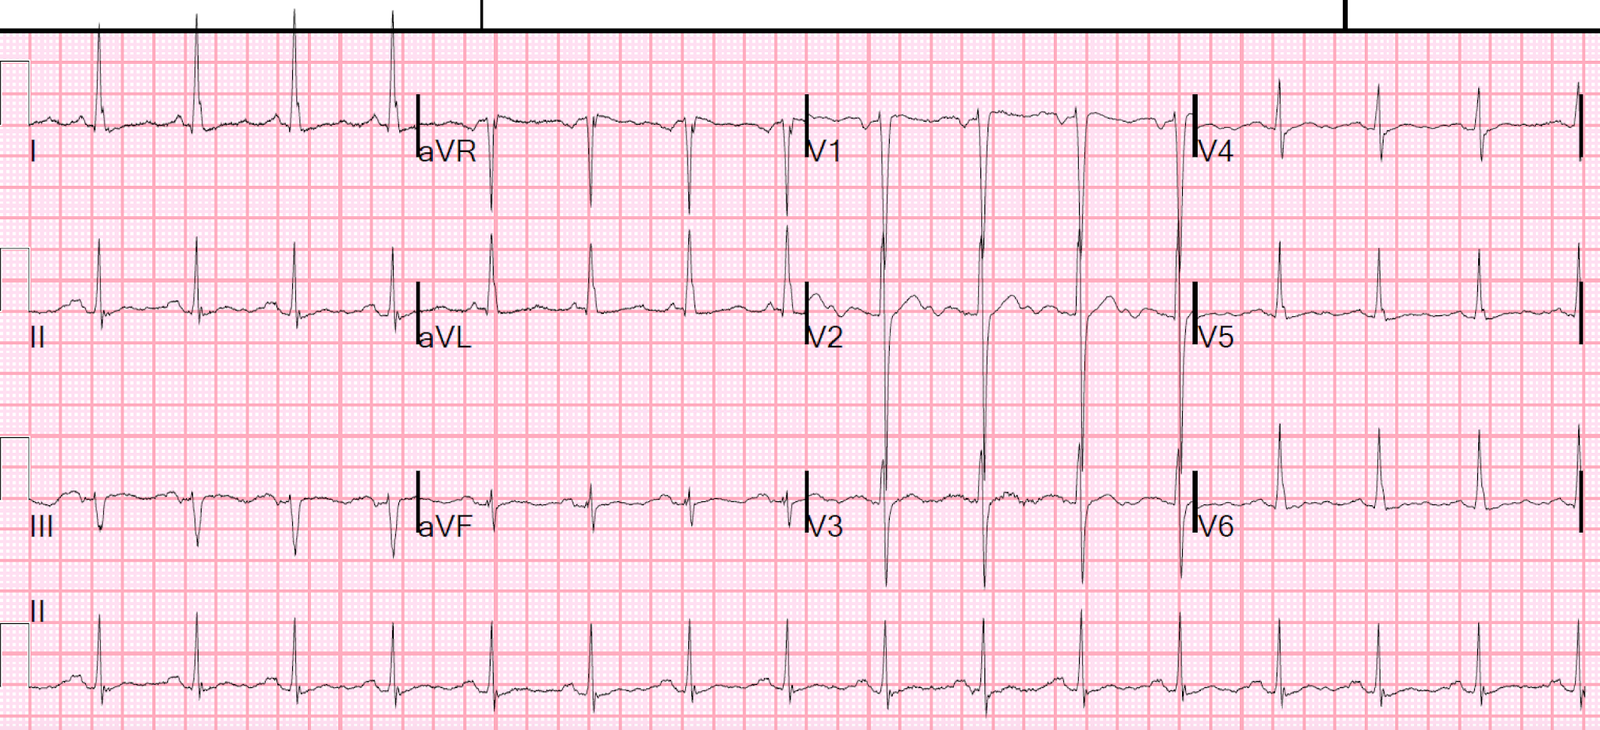
FOLLOW-UP: The patient was electrically cardioverted. The result appears in Figure-2, with the post-cardioversion ECG shown below the initial tracing.
- Does the post-cardioversion tracing confirm that the regular WCT rhythm from ECG #1 was VT?
- HINT: Are all of the beats in ECG #2 the same?
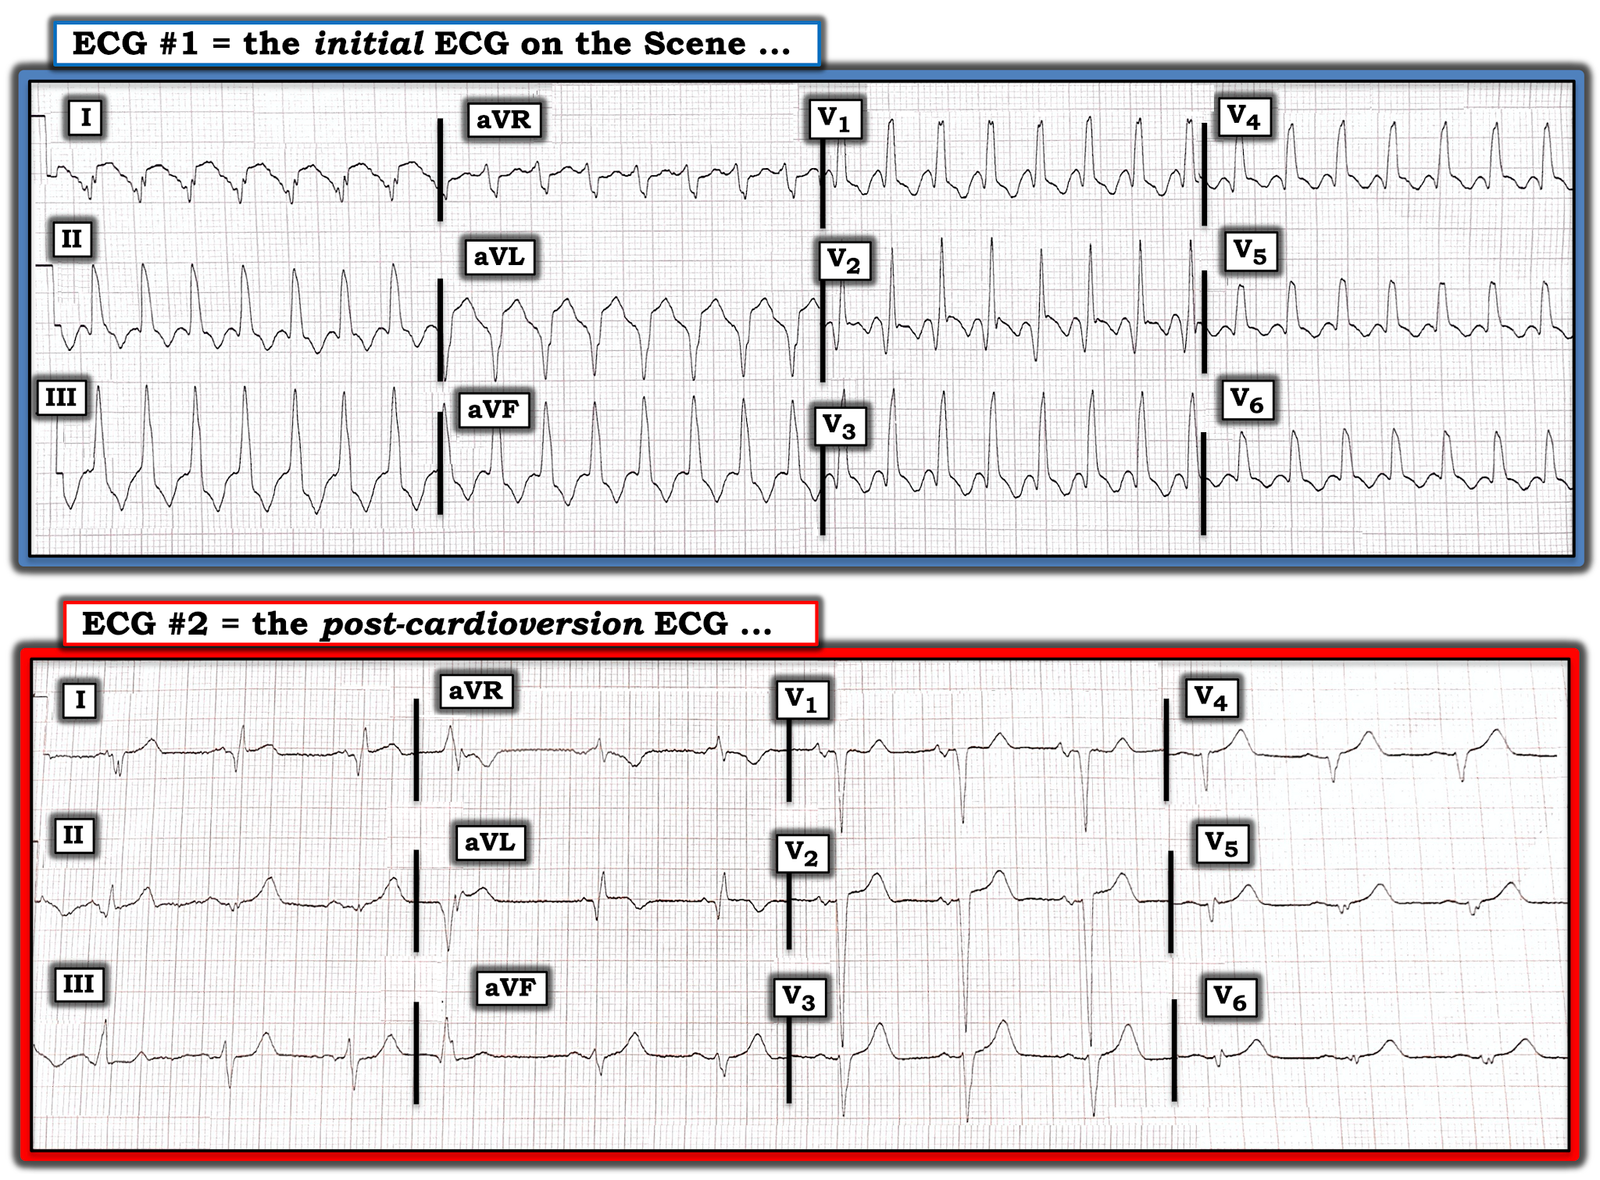 |
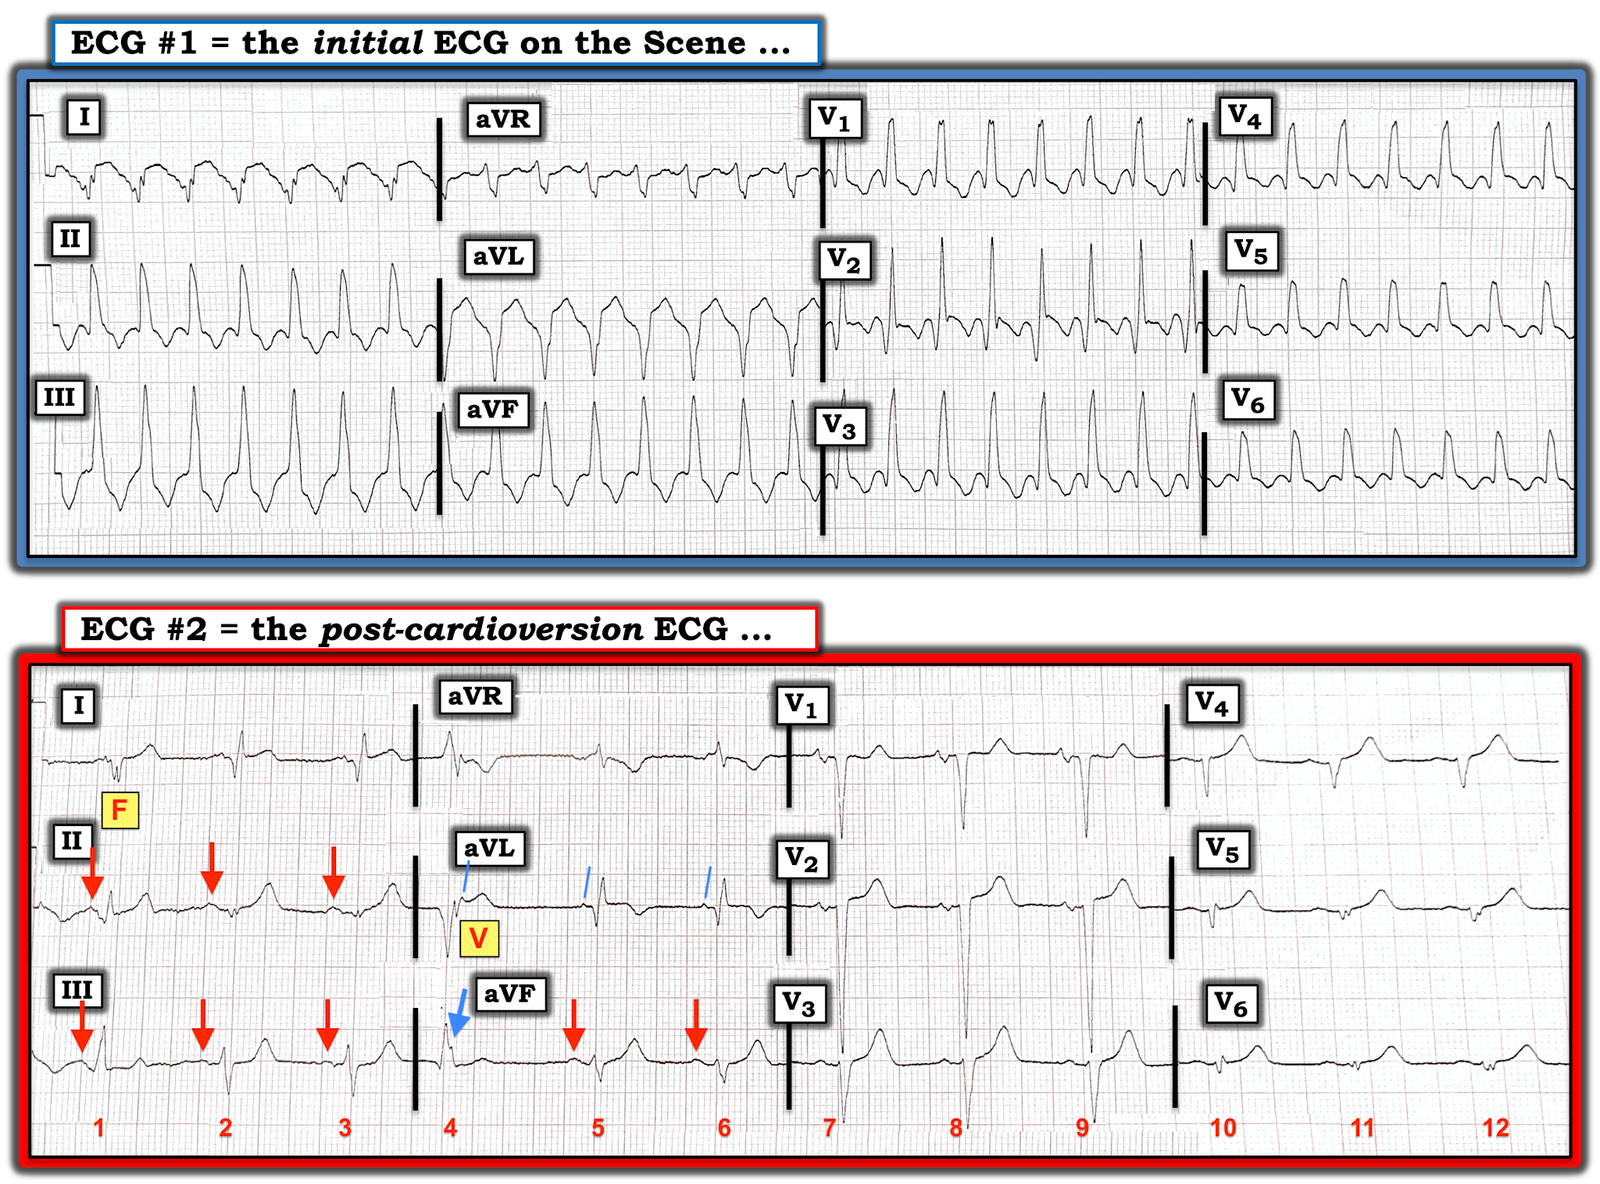
| Figure-2: Comparison between the initial ECG and the post-cardioversion tracing. Does the post-cardioversion tracing confirm that the rhythm in the initial ECG was VT? (See text). |
ANSWER: Unfortunately — there is no simultaneous long lead II rhythm strip for either ECG #1 or ECG #2. This would have been especially helpful for interpretation of ECG #2 (ie, EMS 12-lead ECGs often do not display a simultaneous long lead rhythm strip). That said — we still see enough in ECG #2 to confirm the diagnosis of VT in ECG #1 (I’ve labeled KEY findings in Figure-3 below).
- There are a total of 12 beats in ECG #2 — with beats #1, 2, 3 displayed in leads I, II, III — beats #4, 5, 6 in leads aVR, aVL, aVF — beats #7, 8, 9 in leads V1, V2, V3 — and beats #10, 11, 12 in leads V4, V5, V6 (See Figure-3 below).
- Electrical cardioversion has resulted in conversion of the rhythm to sinus (RED arrows highlighting sinus P waves in selected leads).
The KEY to the Answer lies with realization that beats #1 and #4 in Figure-3 look different from normally sinus-conducted beats in their respective leads.
- Looking first at beat #1 in each of the 3 simultaneously-obtained leads (ie, leads I, II, III) — QRS morphology is clearly different than the appearance of beats #2 and 3 in these leads.
- Note that the PR interval preceding beat #1 is slightly shorter than the PR interval preceding beats #2 and 3 (This is best seen in lead II).
- Finally — Note that QRS morphology of beat #1 in lead I of the post-cardioversion tracing looks very much like the QRS morphology we see in lead I during the regular WCT rhythm. This is because beat #1 in ECG #2 is a Fusion Beat (ie, QRS and ST-T wave morphology of beat #1 looks intermediate between QRS and ST-T wave morphology during VT, and after conversion to sinus rhythm). Realizing that beat #1 in ECG #2 is a fusion beat (ie, “F” in Figure-3) — explains why the PR interval of beat #1 is slightly shorter than the PR interval of normally-conducted sinus beats #2 and 3 (ie, before the P wave preceding beat #1 was able to fully conduct — a late-cycle PVC arose from the ventricles). Seeing a fusion beat with QRS morphology that at least in lead I of ECG #2 looks virtually identical to QRS morphology in lead I during the WCT rhythm — all but confirms that the WCT rhythm was VT (For more on fusion beats — CLICK HERE).
Beat #4 in the post-cardioversion tracing is slightly early! Beat #4 is a ventricular beat (ie, “V” in Figure-3). We explain this as follows:
- Using calipers — we can establish that the underlying sinus rhythm continues throughout the 12 beats seen in ECG #2. RED arrows in this Figure highlight the first 3 sinus P waves. Although the 4th P wave could be easy to overlook — the slanted BLUE lines in lead aVL show that regular occurrence of sinus P waves continues. That the notch that occurs right after the QRS of beat #4 in lead aVL is a sinus P wave — is established because it occurs right-on-time with respect to the 3 preceding RED arrows, and the next 2 sinus beats (ie, the 2nd and 3rd slanted BLUE lines in lead aVL).
- The fact that beat #4 is wide and occurs early — is not preceded by any P wave — and, the underlying sinus rhythm continues throughout (3 RED arrows, followed by the 3 slanted BLUE lines) — means that beat #4 has to be coming from the ventricles. Beat #4 is a late-cycle PVC. The fact that QRS morphology of beat #4 in ECG #2, at least in lead aVL — looks so very much like QRS morphology in lead aVL during the regular WCT — adds further support that the regular WCT rhythm was VT.
- PEARL #2: The finding of an identical QRS morphology for ventricular beats that occur during sinus rhythm — compared to QRS morphology during the regular WCT rhythm — confirms that the WCT was VT. While I fully acknowledge that QRS morphology of the fusion beat and the late-cycle PVC in ECG #2 is not quite identical in all 3 leads compared to QRS morphology in these leads during the WCT rhythm — I thought QRS morphology of the unique shape of the fusion beat ( = beat #1) in lead I, and of the late-cycle PVC ( = beat #4) in lead aVL was close enough to QRS morphology in these leads during the WCT to be unlikely the result of chance. BOTTOM Line: I thought QRS morphology of beat #1 in lead I and of beat #4 in lead aVL provided strong additional support that ECG #1 was VT.
 |
| Figure-3: Key findings from Figure-2 have been labeled (See text). |
WHAT ELSE does the Post-Cardioversion ECG Show?
Now that we’ve determined the rhythm and identified the etiology of beats #1 and 4 in ECG #2 — We can interpret the rest of the tracing:
- The rhythm in ECG #2 is sinus with occasional late-cycle ventricular beats (including a fusion beat). The PR, QRS and QTc intervals are normal. There is marked left axis deviation with an almost null complex for the QRS in lead II. In view of predominant negativity in leads III and aVF — this probably qualifies as LAHB.
- There is no chamber enlargement (I didn’t perceive the P was in lead V1 as having a deep enough negative component to qualify for LAA).
- Deep Q waves are seen in the normally-conducted sinus beats in the high-lateral leads (ie, leads I and aVL).
- R wave progression is lacking in the chest leads. A QS complex is seen in lead V1. A tiny initial r wave appears in leads V2 and V3 — but then disappears in leads V4-thru-V6, which manifest tiny, fragmented complexes.
- Hyperacute T waves (ie, T waves that are larger-and-fatter-than-they-should-be with respect to the QRS complex) are present in multiple leads.
BOTTOM Line: The post-cardioversion ECG of this elderly woman clearly shows evidence of extensive prior infarction. ST-T waves in ECG #2 are markedly abnormal in multiple leads.
- The above said — I feel it impossible to be certain from this single post-conversion tracing whether anything acute is going on (ie, this could be a “memory” effect, that sometimes follows an episode of sustained VT — in which marked ST-T wave abnormalities not due to infarction are seen and persist for hours, or even days).
- Given that there really is no J-point ST elevation in ECG #2 — no reciprocal ST depression — and given nearly uniform presence of similar-looking prominent T waves in almost all leads on this tracing — my hunch is that the ST-T wave changes in ECG #2 are not new!
- The fact that this elderly patient woke up; was normotensive, alert and oriented without chest pain soon after conversion to sinus rhythm — supported my hunch that the abnormal ST-T wave changes in ECG #2 were unlikely to be acute.
- Repeating the ECG after the patient arrived in the ED would have been insightful.
================
NOTE: My sincere THANKS to Emmanuel Reisman (from Monsey, NY) for sharing this case with us!
================
![]()