This patient presented with status epilepticus.
Here is the ECG:
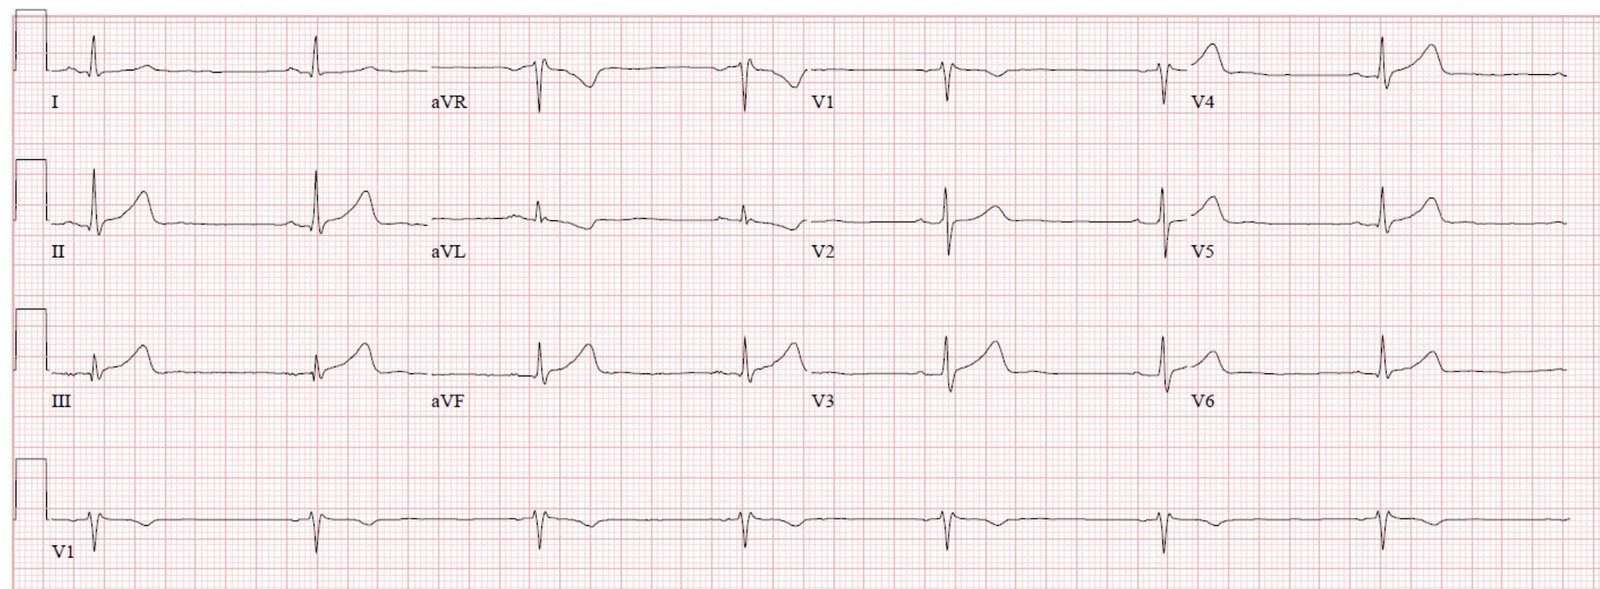
 |
| The computer reads a long QT at 449 ms, and a Hodges QTc of 506 ms.
What do you think? |
In lead V2, you can see distinct T-wave and U-wave. Thus, you can see that the QT interval is not very long. Really, it is 280 ms, for a Hodges corrected QT of 350 ms.
But there are prominent U-waves in all leads.
In many leads, you do not see the T-wave, but ONLY the U-wave: II, III, aVF, and V4-V6. What you might think is a QT interval is really a QU interval. (But a long QU is also dangerous)
This is pathognomonic for hypokalemia.
The K was 1.6 mEq/L.
Of course this is not a difficult case because one will always measure the K in such a case, but it does show that the K is markedly affecting cardiac electrical activity.
Case outcome
The Na was 109. This was the etiology of seizures.
He was treated with hypertonic saline.
Volume was down, and so repleted.
But volume repletion will shut off anti diuretic hormone release, and allow for free water excretion, which can result in rapid rise in Na.
Thus, the patient was also treated with DDAVP to moderate the rise in Na and prevent central pontine myelinolysis.
From EMCrit:
Taking control of severe hyponatremia with DDAVP
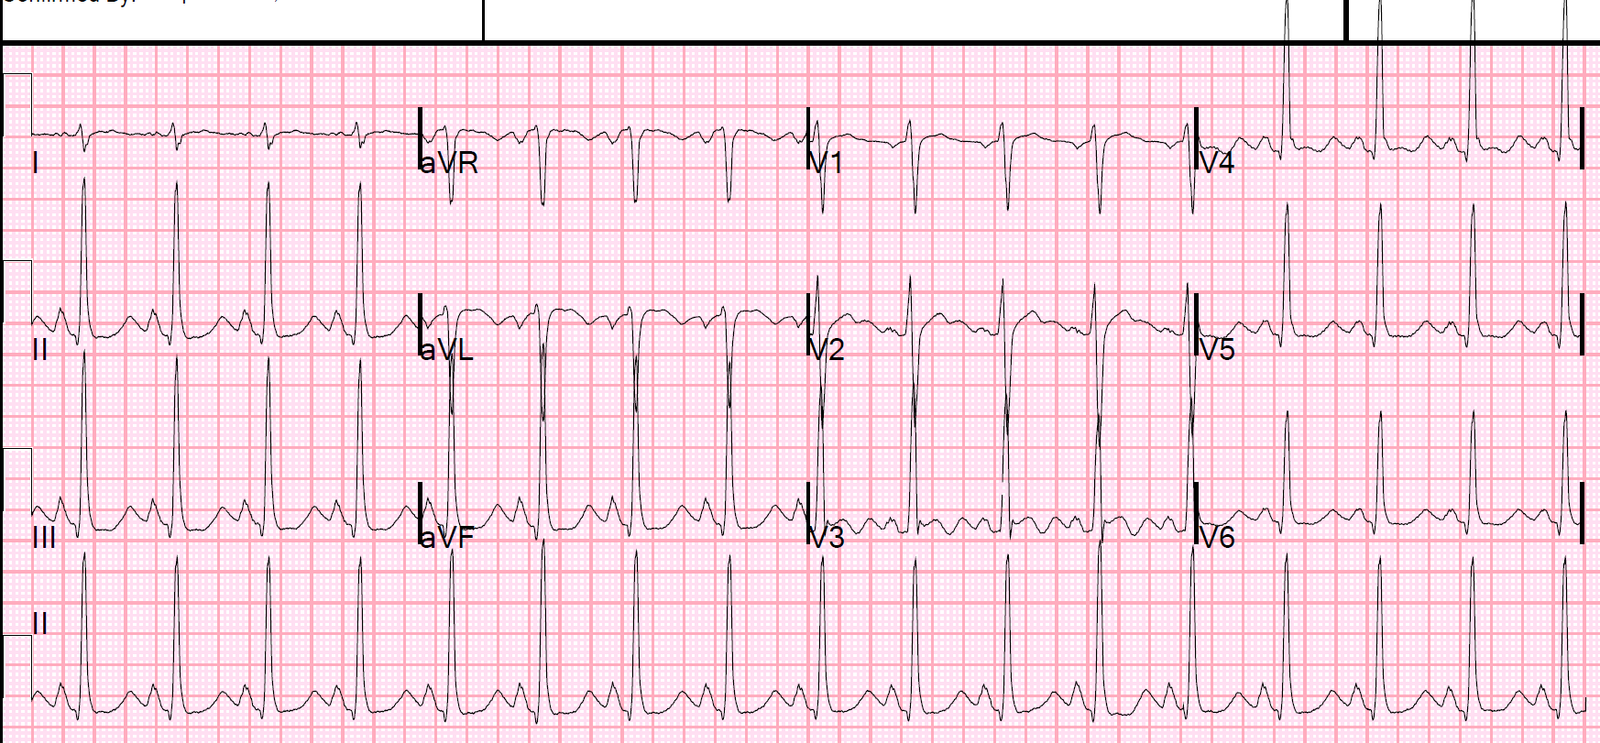
An ECG recorded 2 days later with a K of 4.1:
 |
| No more abnormal U-waves |
![]()
===================================
MY Comment, by KEN GRAUER, MD (11/18/2019):
===================================
LOTS of great points regarding use of the ECG in association with electrolyte abnormalities. I limit my comments to a number of additional points to those brought out by Dr. Smith — with some of my thoughts presenting a different perspective.
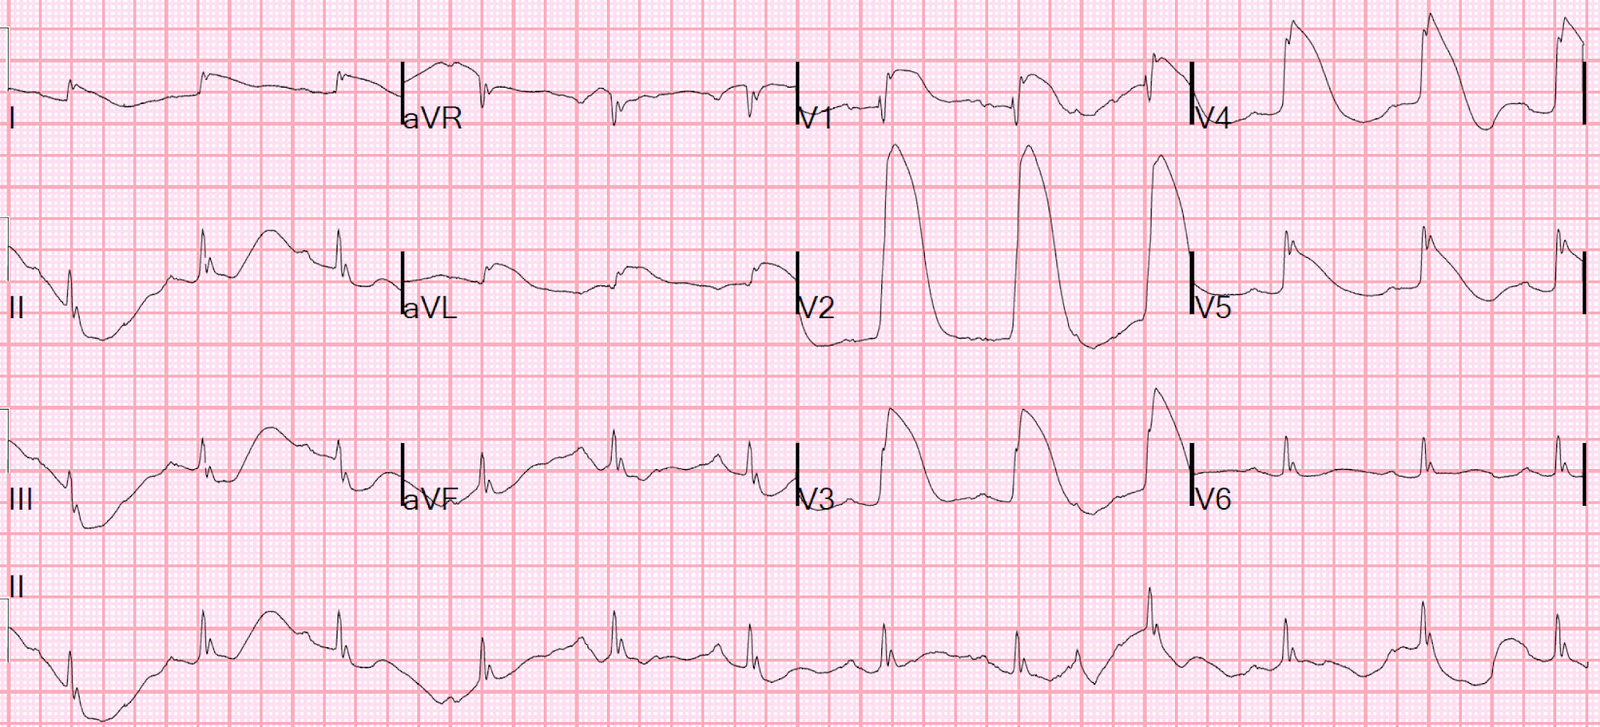
- For clarity — I’ve reproduced and have labeled both the initial ECG ( = ECG #1), as well as the follow-up tracing done 2 days later ( = ECG #2) after correction of the electrolyte disorders (Figure-1).
 |
| Figure-1: Both ECGs that were done in this case (See text). |
Imagine you were given ECG #1 — BUT without a lead V2.
- Wouldn’t it have been much, much more difficult to be certain that U waves were present in ECG #1 if lead V2 was missing?
- Wouldn’t you have thought that the QTc itself was prolonged? (instead of a fairly unremarkable QTc that is followed by large U waves)?
CONFESSION: I would not have known for certain there were U waves in ECG #1 were it not for lead V2.
- I review sequential ECG changes of HypoKalemia in Figure-2. To note, that with more severe degrees of hypokalemia — U wave amplitude may increase to the point of fusing with (and even overtaking) T wave amplitude. When this happens, as it does in most of the leads in ECG #1 — it may be difficult (if not impossible) to distinguish between T wave vs U wave vs fusion of the two.
For clarity — I’ve labeled T wave, U wave and P wave in lead V2 of ECG #1. I find the BEST way to identify U waves — is to appreciate that when present, U waves will be that upright deflection in between the T wave and the P wave.
- NOTE #1 — U waves are not specific for hypokalemia! U waves may also be found in patients with LVH and/or bradycardia, or occasionally as a normal variant. Anterior leads, such as V2 and V3 — as well as lead II — often show U waves best, though they may appear in any lead.
- NOTE #2 — On rare occasions, the U wave may be negative. This is often quite challenging to recognize — but the finding of negative U waves in a patient with chest pain is highly suggestive of ischemia!
- NOTE #3 — In my experience, the ECG is not overly reliable for diagnosing mild-to-moderate hypokalemia — as both sensitivity and specificity of ECG findings for less-than-severe hypokalemia are relatively low. However, sensitivity and specificity for ECG diagnosis of severe hypokalemia is much greater, especially IF: i) the clinical setting is “right” (and predisposes the patient to develop hypokalemia) — as in a patient on diuretics, or presentation with Seizures (as occurred in this case); and, ii) when U waves become so large, that they are bigger than (or almost as big as) T waves! This is comparable to Panel-F in Figure-2 — and comparable to the ST-T wave appearance in leads II, III, aVF, and V4-V6 in Figure-1, in which overly large U waves have fused with the terminal portion of the T waves in these leads.
PEARL #1 — In my experience over the years of closely correlating serum electrolyte levels with ECG appearance — HypoMagnesemia produces virtually identical ECG changes as hypokalemia. Low body magnesium is often encountered in association with other electrolyte abnormalities (ie, low sodium, potassium, calcium or phosphorus); acute MI; cardiac arrest; digoxin/diuretic use; alcohol use and abuse; renal impairment.
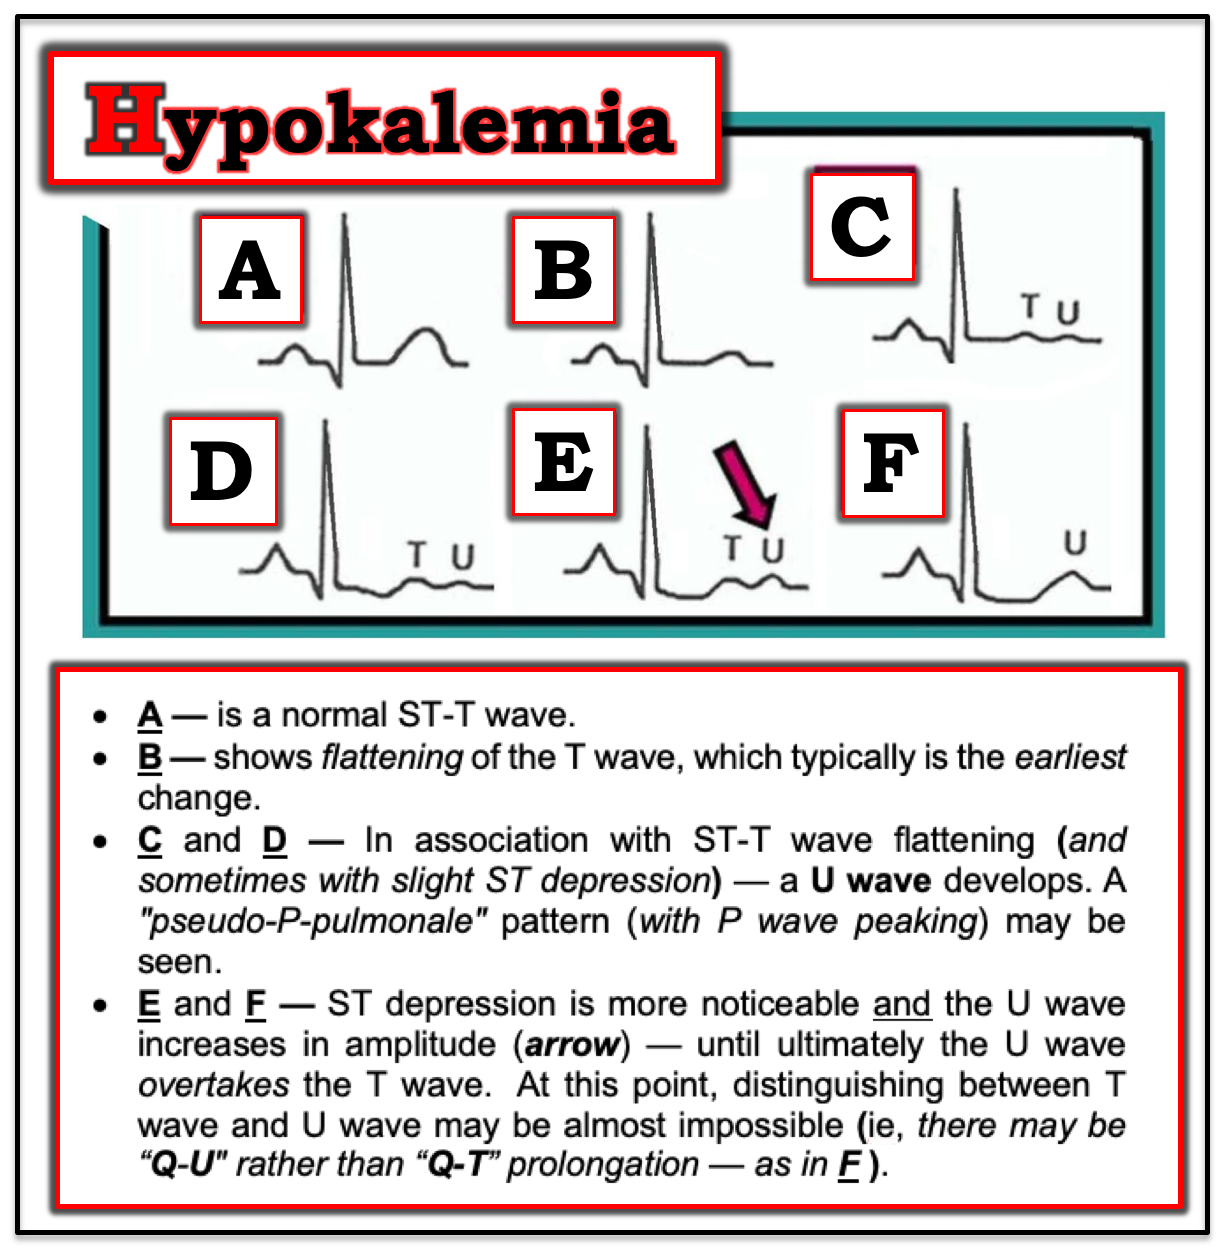 |
| Figure-2: Sequential development of ST-T wave changes with hypokalemia. Note increasing U wave amplitude (See text). |
Going back to Figure-1 — So, WHERE does the T wave end in lead V2?
- I’ve drawn in a BLACK line at the end of the last complex in lead V2 of ECG #1, with this line continuing the downward slope of the T wave in this lead. At the point where this BLACK line reaches the baseline (PURPLE arrow) — is the end of the T wave (vertical RED line in ECG #1). It should be apparent in lead V2, that the beginning of the U wave overlaps with the terminal portion of the T wave in this lead.
- Practically Speaking — it does not matter clinically IF you realized (or not) that the QTc was normal in ECG #1, but that many of the T waves in this tracing were associated with large, overlapping U waves. That’s because IF you appreciated that there are large U waves in ECG #1 — you would have immediately thought of hypokalemia as the likely cause. But even if you did not appreciate that there are diffuse, large U waves in ECG #1 — You still should have considered the LIST of the Common Causes of QT Prolongation — which include: i) Certain Drugs; ii) “Lytes” (ie, hypokalemia; hypomagnesemia; hypocalcemia); and/or iii) CNS Catastrophes (ie, stroke, seizure, coma, tumor, trauma, intracerebral or brainstem bleeding) — CLICK HERE for application of “My Take” on these considerations.
Did YOU Notice any OTHER ECG Findings in ECG #1? There is an all-too-common tendency for even experienced interpreters to skip over the Systematic Approach to ECG interpretation as soon as a significant abnormality “jumps out” at them from the tracing. YOU should have noted the following additional ECG findings in ECG #1:
- There is sinus tachycardia at ~100/minute in ECG #1. This is relevant — because we have to correct our calculation of the QTc based on heart rate.
- The QRS complex in ECG #1 is wide (I measure 0.12 second). QRS morphology does not really resemble RBBB, LBBB or a hemiblock — so I would describe this QRS widening as a nonspecific IVCD.
- There is a vertical QRS axis in the frontal plane (of about +90 degrees, given the tiny but isoelectric QRS complex in lead I ).
- There is increased QRS amplitude in multiple leads (ie, raises the question IF the patient might have LVH?).
- The is a prominent P wave in each of the inferior leads (inferior P waves are tall, peaked and pointed). PEARL #2: In addition to prominent U waves and ST-T wave flattening (if not slight ST depression) — some patients with hypokalemia develop a “pseudo-P-pulmonale” picture (See Panels D, E and F in Figure-2). I’ll emphasize that this tall and peaked P wave appearance is not consistently seen — but on occasion, this ECG finding has helped me to suspect hypokalemia.
Comparison with ECG #2: I found it of interest to compare the initial ECG with ECG #2, which was obtained 2 days later (after electrolyte abnormalities had been corrected).
- Did YOU Notice that after correction of serum electrolytes — QRS duration normalized in ECG #2? To my knowledge, QRS widening does not result from simple hypokalemia. This makes me wonder WHY the QRS was wide in ECG #1? Unfortunately, we don’t know full details of the clinical history (ie, medications that the patient may have been taking, results of other electrolyte values, such as serum Ca++ and serum Mg++) — but perhaps the significantly wider QRS that we see in ECG #1 reflected a pre-Torsades stage (and perhaps frank Torsades de Pointes would have developed had the electrolyte disturbance not been recognized and corrected?).
- Other ECG Changes — that should be noted in the follow-up tracing (ECG #2) include the following: i) The heart rate is slower in ECG #2; ii) P wave size is smaller in ECG #2 compared to ECG #1; iii) the frontal plane axis has normalized (it is now about +75 degrees); iv) ST segment straightening with slight depression has resolved; and, v) QRS voltage is less. Finally — Note that separation is seen in leads V2 and V3 of ECG #2 between the end of the T wave and the ensuing U wave that has significantly decreased in size (PINK arrows). I have always found it insightful to observe this separation of fused T-U waves as they evolve back into distinct T waves and distinct U waves over the ~12-36 hours during which hypokalemia/hypomagnesemia is corrected. It would have been interesting in this case to see a few more serial ECGs sooner than 2 days later.
Our THANKS to Dr. Smith for this instructive case!