My city of Minneapolis is being attacked and occupied by ICE right now and it is very frightening and anxiety provoking, especially for anyone who has brown skin. They are constantly breaking the law. I have personally witnessed gross and dangerous traffic violations: 1) driving 80 mph on 35W, 2) a convoy of 12 vehicles going directly through a red light, 3) an SUV passing at 60 mph in the oncoming lane of a city street, 4) an SUV going through a red light and then turning left across 8 lanes of trafffic. 5) a convoy driving on a street that is for buses only. These are just the incidents that I have personally witnessed. I wish I had had a dashcam, but only thought of it later.
Case
A 50-something male called 911 for acute chest pain. He had a very significant history of MI and coronary disease with multiple stents (to D1 and RCA), and history of ischemic cardiomyopathy
Medics arrived and recorded these ECGs:
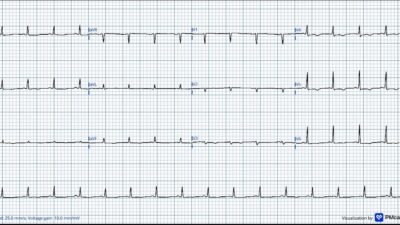
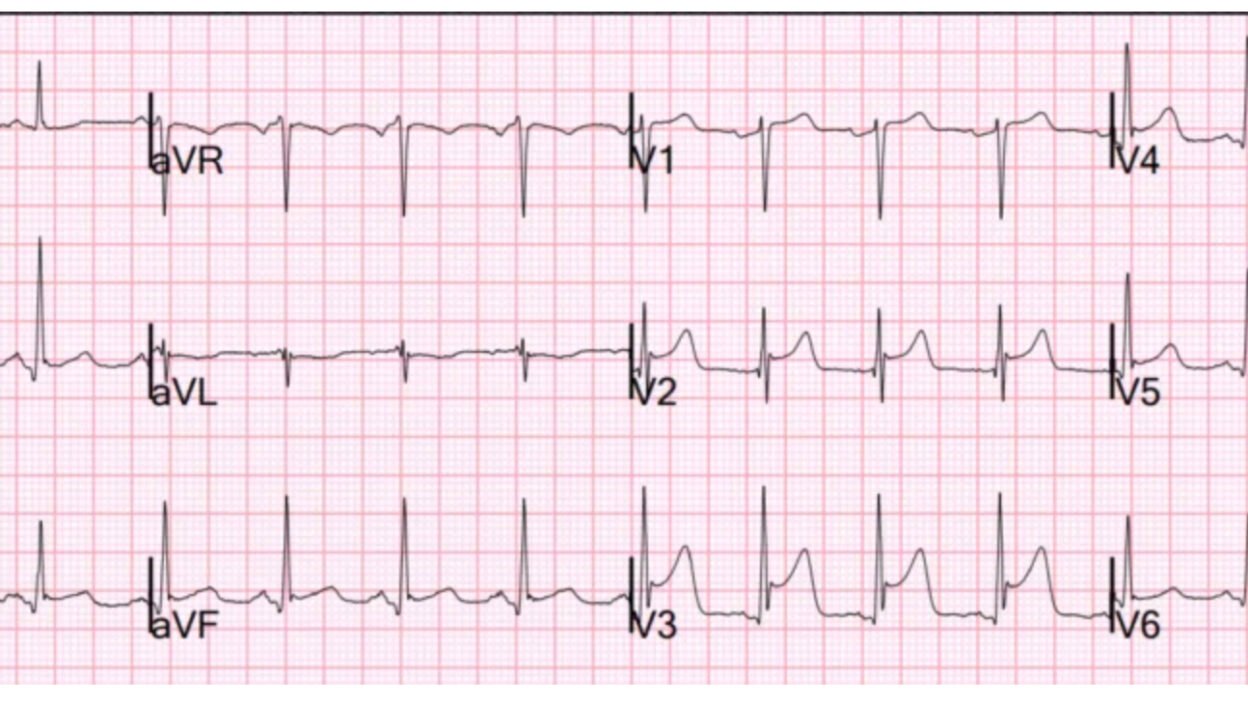
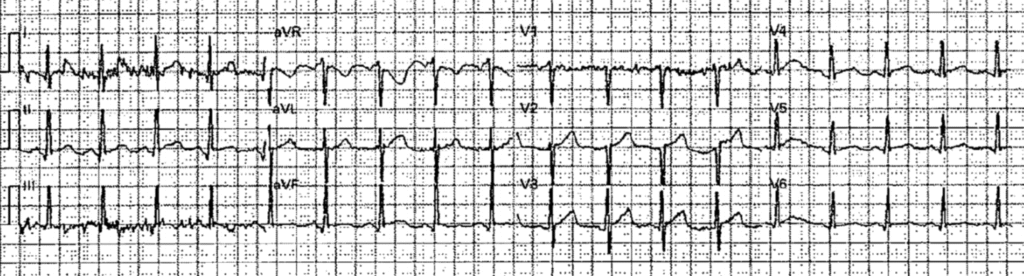
ECG 1, time zero:
What do you think?
This is diagnostic of LAD Occlusion (LAD OMI).
The Queen knows it:
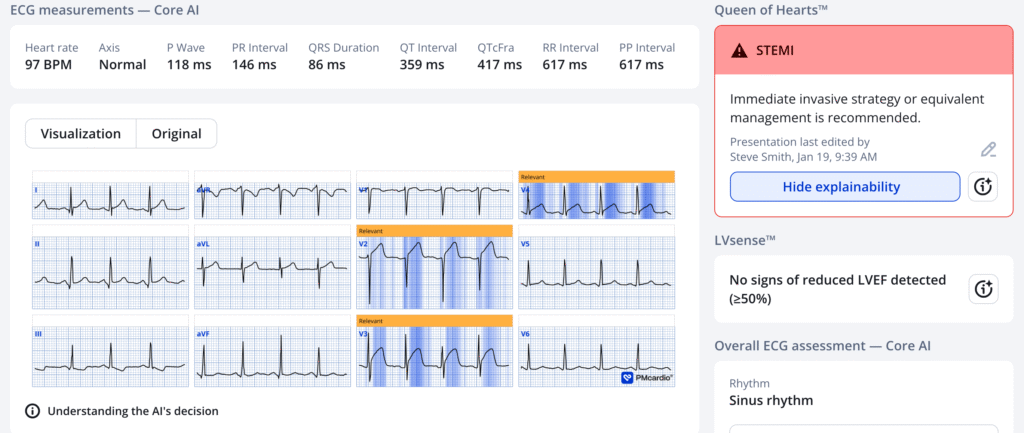
The patient’s pain beNew PMcardio for Individuals App 3.0 now includes the latest Queen of Hearts model and AI explainability (blue heatmaps)! Download now for iOS or Android. https://www.powerfulmedical.com/pmcardio-individuals/ (Drs. Smith and Meyers trained the AI Model and are shareholders in Powerful Medical). As a member of our community, you can use the code DRSMITH20 to get an exclusive 20% off your first year of the annual subscription. Disclaimer: PMcardio is CE-certified for marketing in the European Union and the United Kingdom. PMcardio technology has not yet been cleared by the US Food and Drug Administration (FDA) for clinical use in the USA.
The pain began to improve, and serial ECGs were recorded:
ECG 2, time 2 minutes:
ECG 3, time 16 minutes
ECG 4, time 32 minutes:
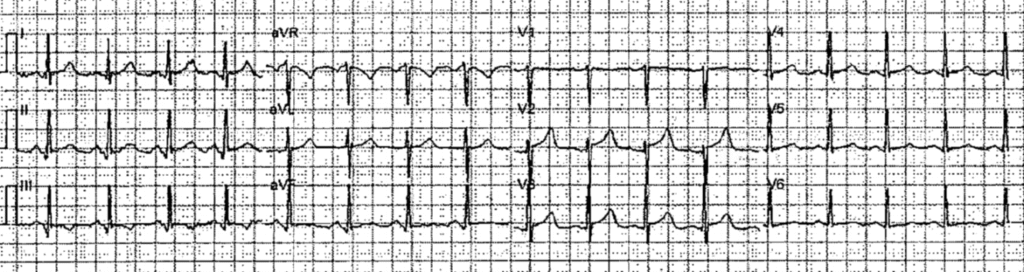
Now it is normalized!
The patient was pain free at this time, and the ECGs successively show prehospital full reperfusion.
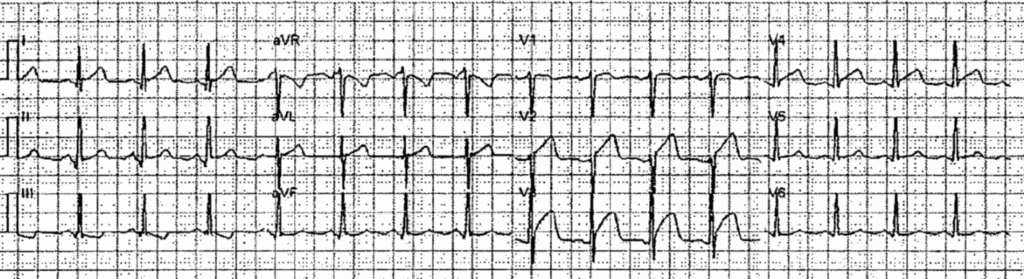
He then arrived in the ED and had recurrent chest pain. This is recorded at t = 58 minutes. So this is ECG 5 recorded in the ED.
This is “The last ECG” referred to in the TITLE of the post.
What do you see now?
There is recurrent ST Elevation. There is also loss of the previously present S-wave in V2-V5. Absence of S-wave in V2-3 is never seen in normal variant with one exception: sometimes (10%) the S-wave in V3 may be absent IF THERE IS A J-WAVE. Absence of both S-wave and J-wave in V2-3 is what I call “Terminal QRS Distortion”, and I showed that it is never present in early repolarization (normal variant STE in V2-V4).
In this case, there is actually J-point notching in V3!! However, the S-wave has disappeared compared to both the previous serial ECG and compared to the Old ECG (shown below). So in spite of this notching, there is terminal QRS distortion (TQRSD).
Moreover, I never call “normal variant STE” or “Early repolarization” when there is 5 mm of ST Elevation. That is too much. All of this is outlined in this 2012 paper. ECG Differentiation of LAD OMI from Early Repol.
The external validation is here. A Tale of Two Formulas
And the proof of the significance of terminal QRS distortion is here. Terminal QRS Distortion may be Present in LAD OMI but is absent in Early Repol
And a fantastic demonstration of TQRSD is here: Best Explanation of Terminal QRS Distortion in Diagnosis of Electrocardiographically Subtle LAD Occlusion
Case continued
Unfortunately, the Queen of Hearts did not see it, though she was worried about it (Indeterminate result at with a numeric value of 0.4 — positive is 0.5 or above):
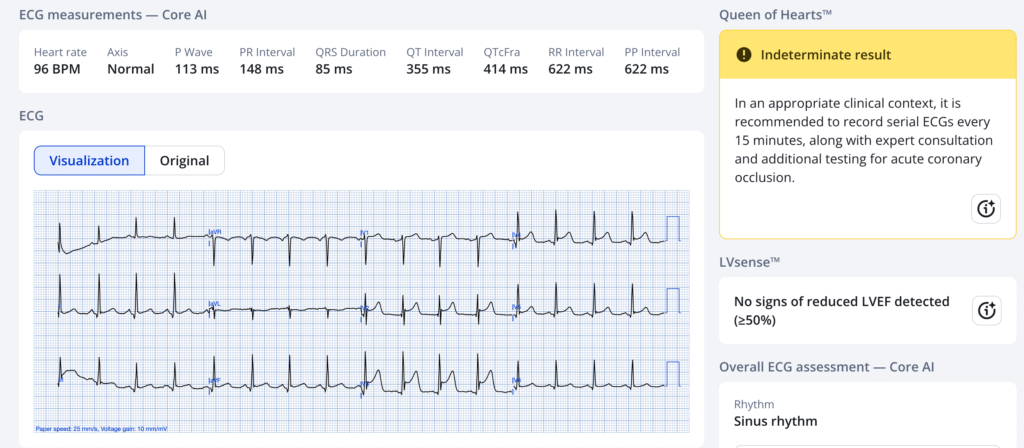
This result is from “PMCardio for Organizations.” “Indeterminate” means that this may indeed be OMI, but uncertain. It is not yet available on PMCardio for Individuals, but will be soon.”
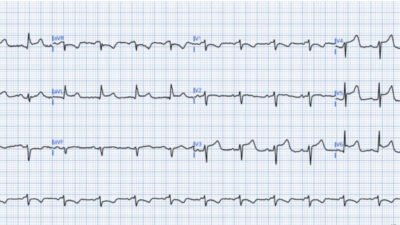
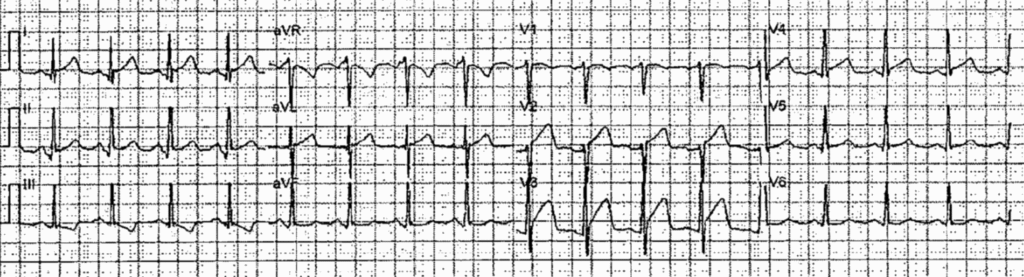
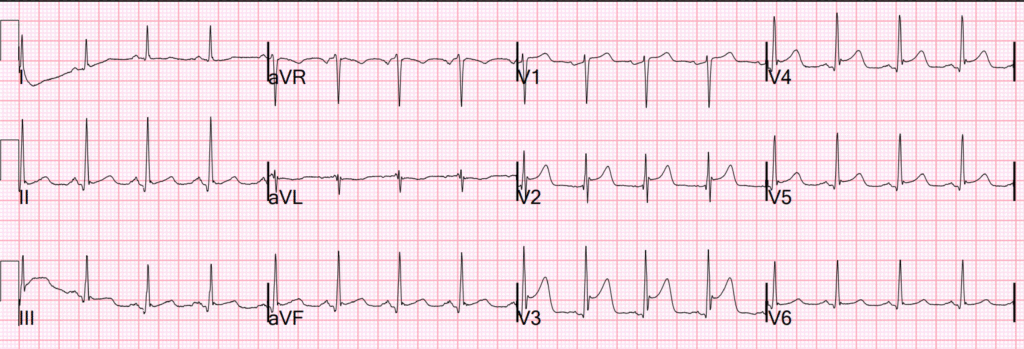
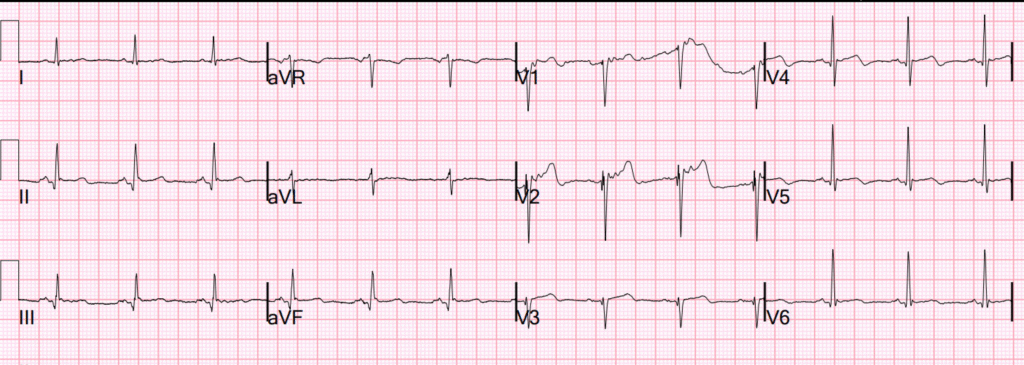
Just to prove this, let’s look at an ECG recorded 2 months prior on this patient:
This confirms that the patient normally has S-waves in V2-3, as all early repol does.
The interventionalist stated that the ED ECG (ECG 5) was “early repolarization”. This is clearly not true. It had normalized prehospital, but then re-occluded.
Then the patient became pain free again.
Angiogram showed 95% LAD culprit with 3 vessel disease. Patient was set up for CABG. No PCI was done.
Peak troponin I was 328 ng/L.
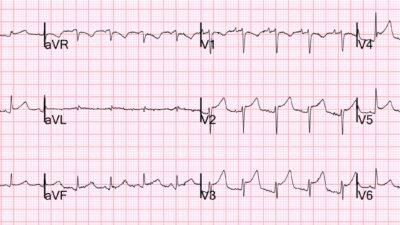
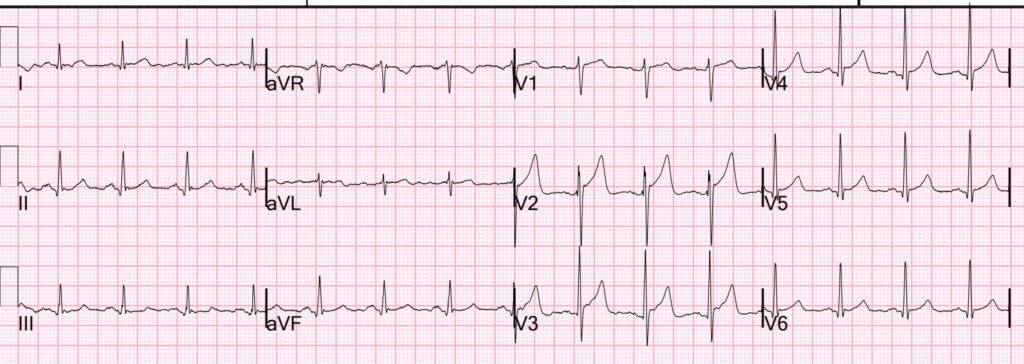
ECG after angina subsided:
This confirms spontaneous reperfusion with reconstitution of S-waves and typical Wellens reperfusion T-waves.
Echo:
Normal left ventricular cavity size with mildly increase wall thickness, and mildly reduced ejection fraction of 40 – 45%. Regional wall motion abnormality-inferior and inferolateral (from previous MI). Notice that there is no anterior wall motion abnormality (WMA). Rapid reperfusion often results in zero WMA; sometimes it results in a temporary WMA (“stunning”) that resolves with time. So if you think you can diagnose ACS with high sensitivity by obtaining a next day echo, think again.
Learning Point:
Learn to recognize Terminal QRS Distortion (TQRSD). Here is a terrible case of TQRSD:
An intoxicated, agitated, 29 year old with chest pain
= = =
======================================
MY Comment, by KEN GRAUER, MD (1/19/2026):
I love the way today’s case provides 5 serial ECGs recorded within the 1st hour after this patient with new CP (Chest Pain) was seen.
- I focus My Comment on the first 3 serial ECGs that were recorded within the first 16 minutes.
- Confession: I looked at the first 2 tracings — but did not see anything by looking at ECG #1 and ECG #2 separately. I next looked at ECG #3 separately, and I thought it looked like there was “some improvement” — but I had trouble specifying what was better when I looked at that tracing separately.
= = =
Try it YOURSELF!
- Look at ECG #1. Then put ECG #1 aside.
- Now look at ECG #2 by itself. Does it look better or worse than ECG #1?
- Now put ECGs #1 and 2 aside — and look only at ECG #3. How much of a change is there?
- Now look at all 3 tracings together in Figure-1. Compare each tracing to the others, looking lead-by-lead to verify the differences.
= = =
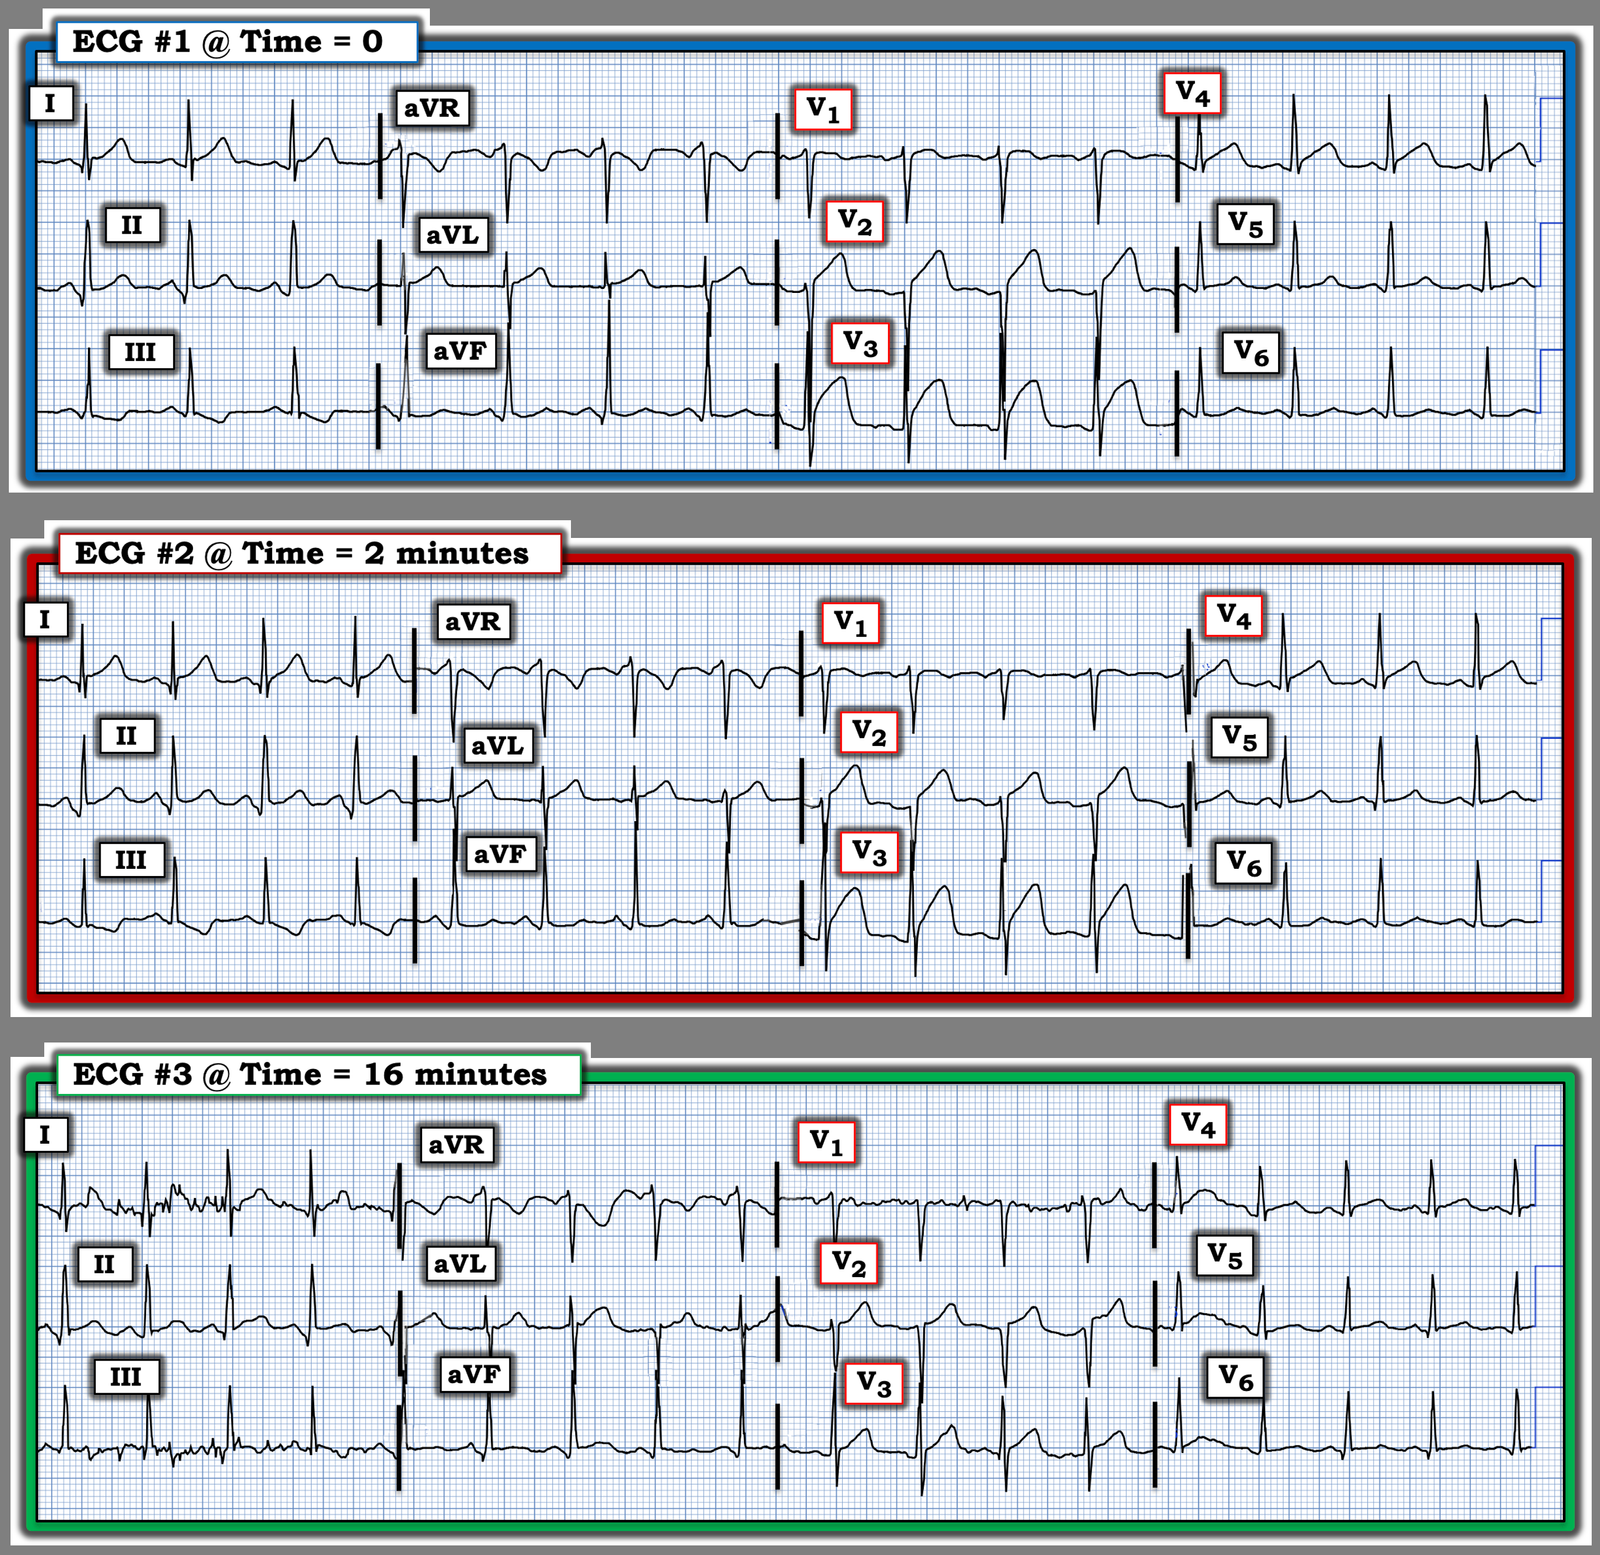
Figure-1: The first 3 ECGs in today’s case. (To improve visualization — I’ve digitized the original ECGs using PMcardio).
= = =
Lead-by-Lead Comparison:
I thought the KEY differences in lead-to-lead comparison were found in leads V1-thru-V4.
- ECG #1 — is the most concerning tracing! There is ST coving with subtle ST elevation in lead V1 — ST segment straightening with at least 1.5 mm of ST elevation in lead V2 — coving (if not bulging!) of the elevated ST segment in lead V3 — with ST segment straightening and still 1 mm of ST elevation in lead V4.
- ECG #2 — done just 2 minutes after ECG #1, already shows improvement. The coved ST segment in lead V1 is less prominent than it was 2 minutes earlier — there is now less ST segment straightening and less ST elevation in lead V2 — there clearly is less ST segment “bulging” and less J-point elevation in lead V3 — and there is subtle decrease of the ST segment straightening in lead V4 compared to what was seen in ECG #1.
- ECG #3 — has more artifact, but the change in ST-T wave abnormalities compared to ECG #2 done 14 minutes before is remarkable. The ST segment in lead V1 is now flat — and the amount of ST elevation is less, now with more of an upward ST segment concavity in leads V2,V3,V4 than was seen in ECG #2.
= = =
Learning Point:
Appreciation of the above-noted, sometimes subtle ST-T wave changes observed in these 3 serial tracings should not have been needed to establish the diagnosis of an acute ongoing OMI in need of prompt cath with PCI in today’s case (as this should be evident from the initial ECG and the history of new CP in this high-risk patient).
- That said — there are many instances in the evaluation of patients with new CP in whom detection of “dynamic“ ST-T wave changes may be the critical ECG finding for convincing a reluctant interventionist of the need for prompt cath and PCI.
- Unless you compare serial tracings lead-by-lead with each tracing placed next to the one you are comparing it with — subtle-but-important ST-T wave changes will be missed!
= = =
ADDENDUM (1/20/2026):
Additional “Learning Points” worthy of repetition from today’s case include the following:
- Refinement of our understanding of T-QRS-D (Terminal QRS Distortion). I illustrated the “picture” of what is (and what is not) T-QRS-D in My Comment at the very bottom of the page in the May 8, 2025 post.
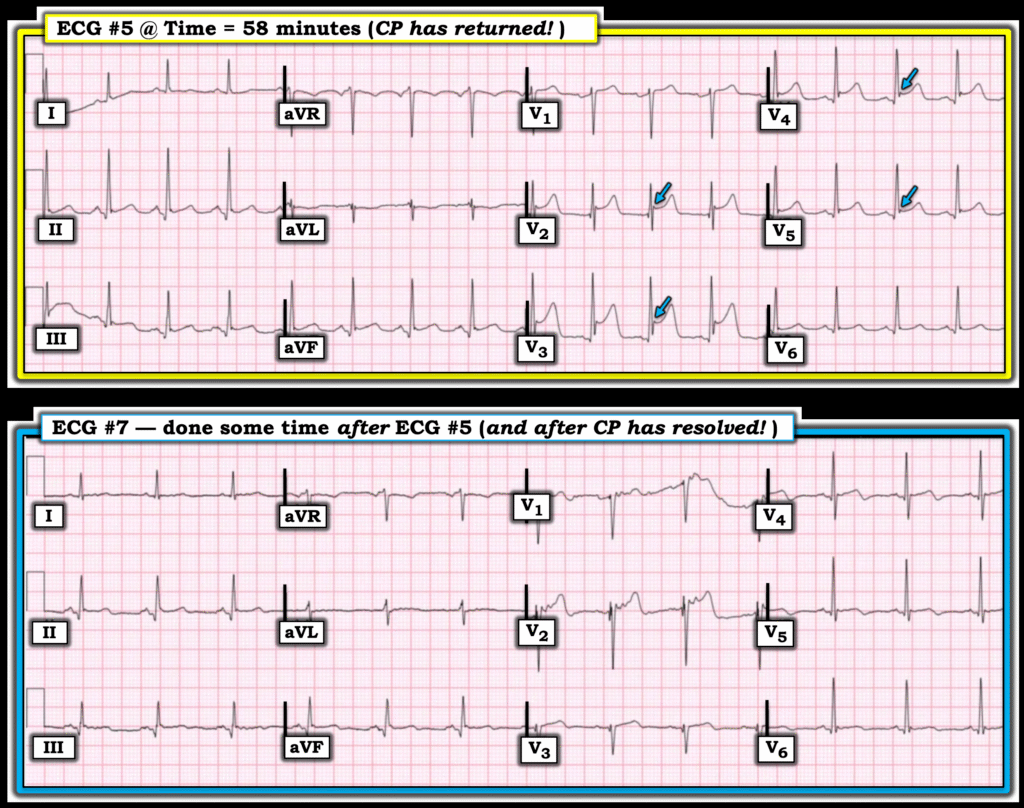
- Dr. Smith emphasized in his above discussion how the absence of an S wave (ie, that reaches down to the baseline) is never seen in a normal variant with one exception (ie, in ~10% of cases the S wave may be absent without this being T-QRS-D — if there is a J-wave). But in today’s case — ECG #5 does show a J-wave in lead V3 (highlighted in Figure-2 by the BLUE arrow in this V3 lead).
- However, considering that an S wave was present in ECGs #1, #2 and #3 (from Figure-1) — despite the J wave that has now developed in lead V3 of ECG #5, we should still define the ECG picture in lead V3 of ECG #5 as T-QRS-D because in association with recurrence of CP, the S wave that previously was present has now disappeared.
- Similarly — despite the J-wave seen in lead V4 of ECG #5 — The S wave that previously was present in ECGs #1,#2,#3 has now disappeared — so this should also qualify as T-QRS-D.
- That said — we should appreciate that the 4 BLUE arrows in ECG #5 highlight J waves in each of these leads! And these J waves were not seen in the prior ECGs in today’s case!
- The important point is that ischemic J waves may on occasion be seen in association with ongoing acute infarction (with this new development of J waves in ECG #5 corresponding to recurrence of this patient’s CP and to recurrence of ST elevation!).
- In further support that these chest lead J waves that we see in ECG #5 are the result of acute ischemia — is disappearance of the J wave in lead V3 and reduced prominence of the V4,V5 J waves in ECG #7 recorded after CP has resolved, in association with resolution of the ST elevation that had been present in ECG #5. (I felt excessive artifact in the ST segment in lead V2 of ECG #7 prevents assessment of whether or not a J wave is truly seen).
= = =
Ischemic J Waves …
Documentation of J waves potentially serving as an ischemic marker is forthcoming in the literature (Andreou — Cardiol J 28(4):638-639, 2021 – and – Andreou — Eur Heart J Case Rep 6(7):ytac249, 2022).
- The mechanism for development of ischemic J waves is thought to relate to conduction delay in ischemic myocardium and accentuation of the potassium current-mediated action potential notch during early ventricular repolarization in epicardium but not endocardium.
- Ischemic J waves may increase in size if acute ischemia persists and/or worsens. J waves may decrease in size and/or disappear as CP and associated ST elevation resolve (as was seen in today’s case!).
- The location of J waves often localizes the “culprit” vessel ( = the BLUE arrows in ECG #5 being consistent with acute LAD occlusion in today’s case).
- Clinically — Development of ischemic J waves has been shown to confer an increased risk of developing VFib (thought to reflect the increase in transmural dispersion of ventricular repolarization that these J waves serve as a marker for).
= = =
Figure-2: Comparison between ECG #5 (recorded at T = 58 minutes — when CP recurs! ) — with ECG #7 (recorded some time after ECG #5 — when CP had completely resolved).
= = =
= = =