A 70-something y.o. male presents to triage with shortness of breath. He reports significant chest pain at the base of his scapula on the right side along with new shortness of breath.
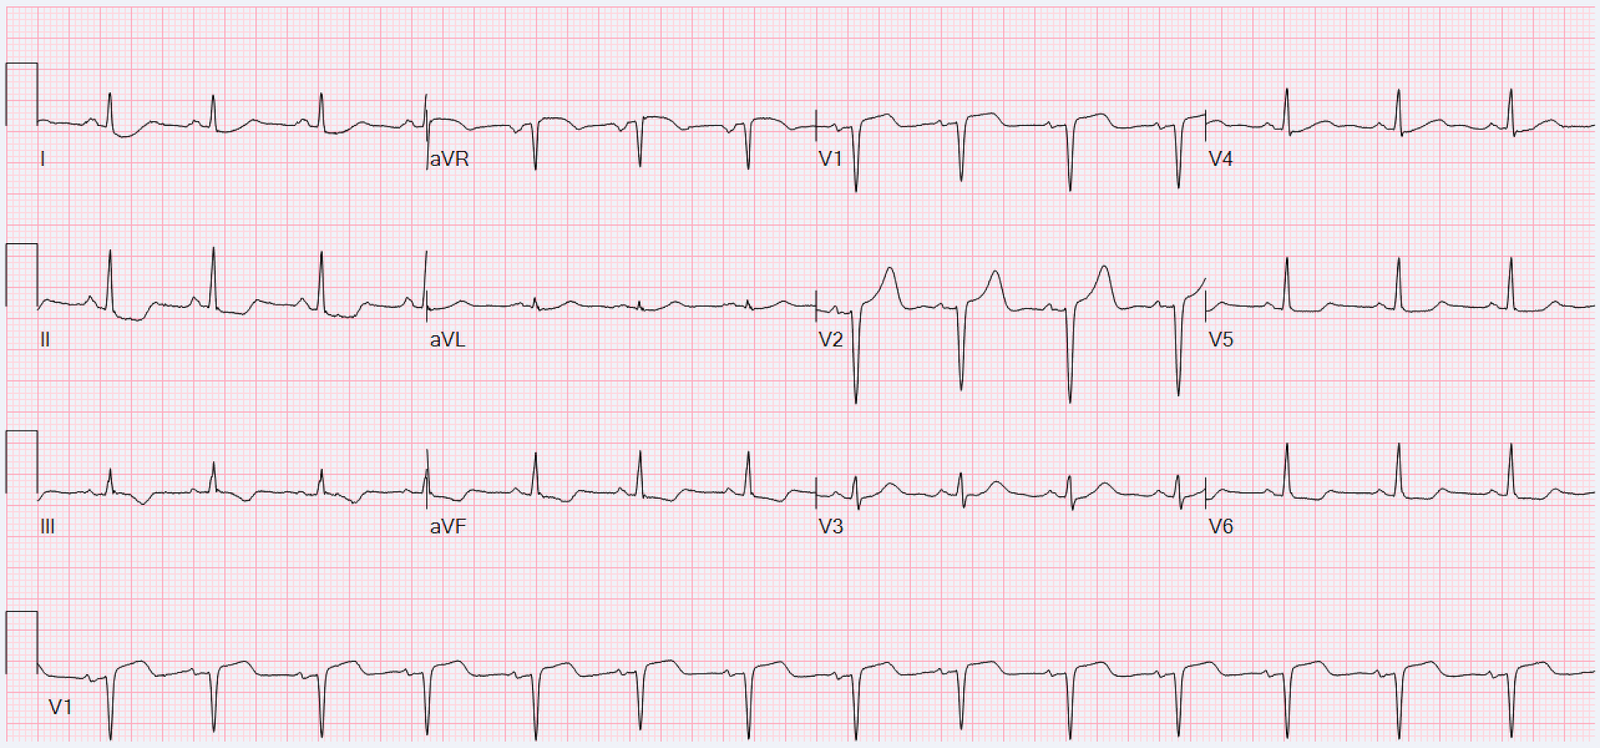
ECG 1 at time zero
EARLY REPOLARIZATION
ABNORMAL ECG
ED final official overread: “early repol vs hyperacute T, minimal changes from previous (previous shown below)”
What do YOU think?
Smith: there is some minimal ST elevation in V2-V6, but does not meet STEMI criteria. Is it normal STE? The computer thinks so, and the physician thinks that is quite possible.
However, there is terminal QRS distortion in lead V3. We showed that this NEVER happens in normal ST elevation!
There are also subtly hyperacute T-wave in I, aVL, and V2-V6.
There is also a very negative (reciprocally inverted) T-wave in lead III, and a down-up T-wave in aVF, both of which are highly suggestive of occlusion of the LAD or D1.
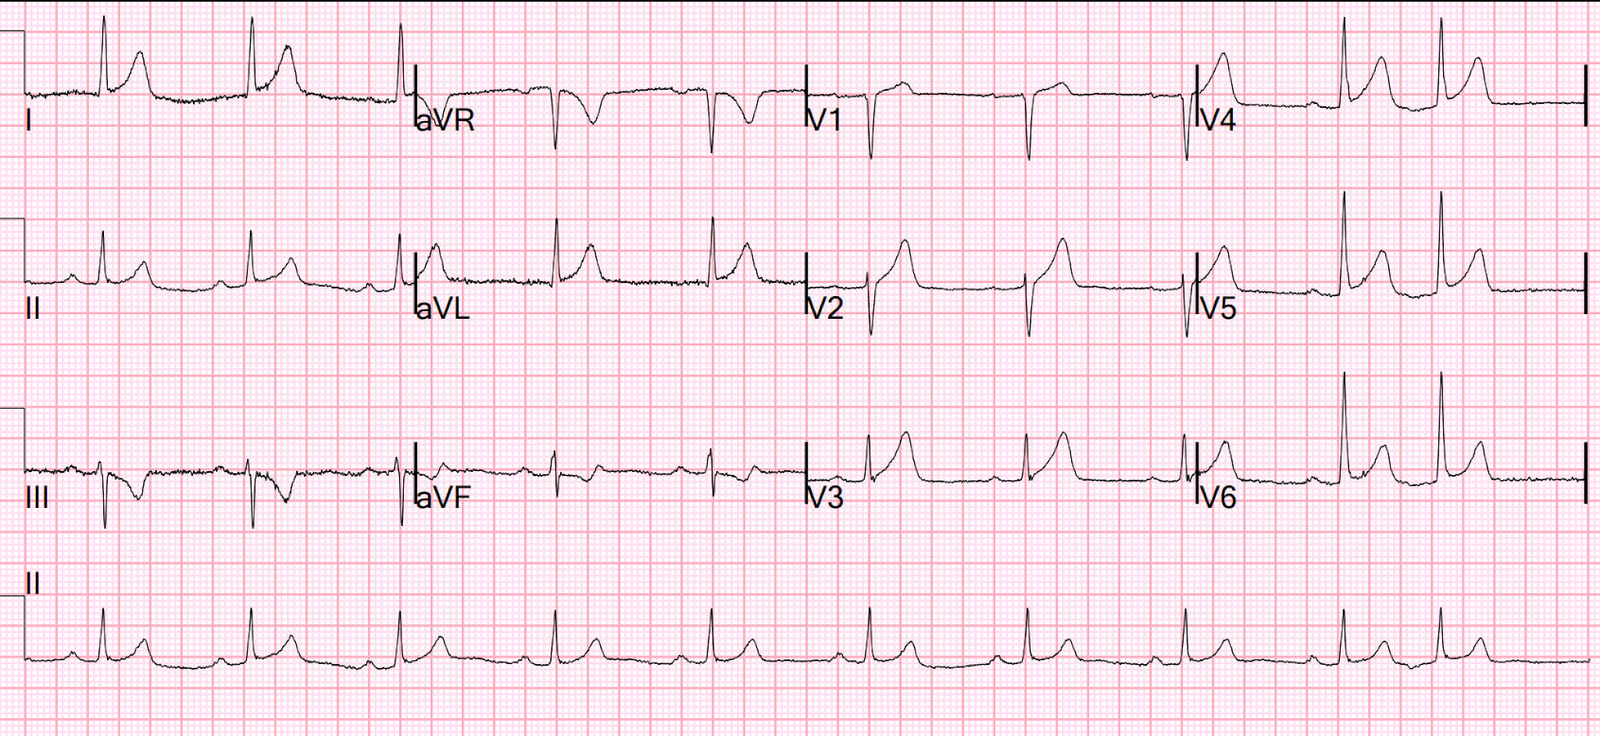
Previous many months ago when patient had vertigo:

Notice that the T-waves are far smaller, there is none of the inferior findings, and there is a well-formed S-wave in V3 (absence of terminal QRS distortion)
Queen of Hearts on first ECG:

OMI with High Confidence
Queen of Hearts interpretation of this prior (previous) ECG:

Not OMI with High Confidence
Click here to sign up for Queen of Hearts Access
These findings were very suspicious for the triage MD and so she took the patient to the critical care area.
Then the patient’s pain then resolved spontaneously after 2 sublingual nitroglycerine and another ECG was recorded
ECG 2 at 16 minutes
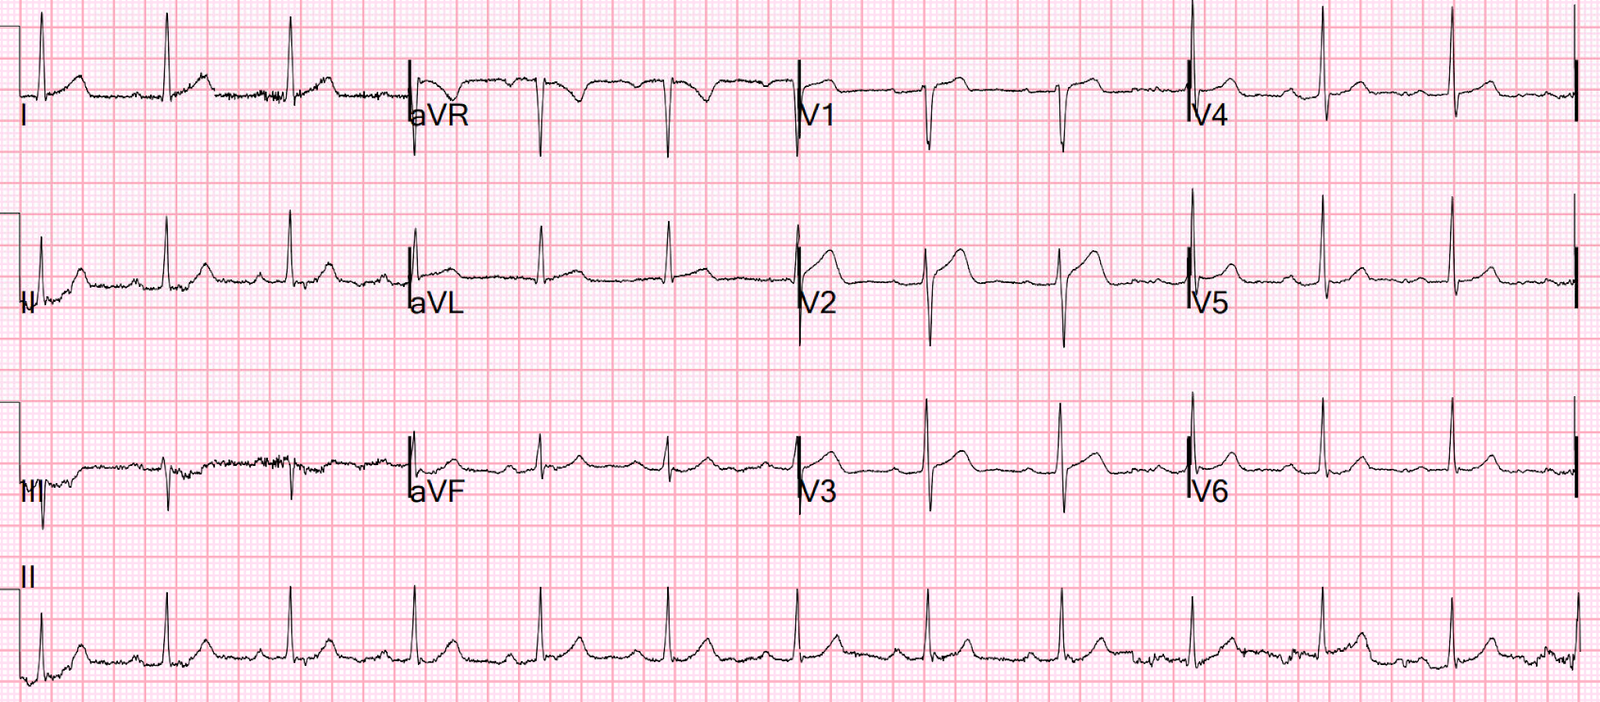
ST ELEVATION CONSISTENT WITH INJURY, PERICARDITIS, OR EARLY REPOLARIZATION
Overread same
Smith: The T-waves are now MUCH smaller. The S-wave is reconstituted. The inferior findings are much less pronounced. The T-wave and STE in V2 are still very suspicious and much different from baseline, but the overall interpretation is that it is consistent with reperfusion.
Thus, the LAD has reperfused (“recanalized”) spontaneously
Queen on ECG 2:

Not OMI, Low confidence
She is also worried about V2.
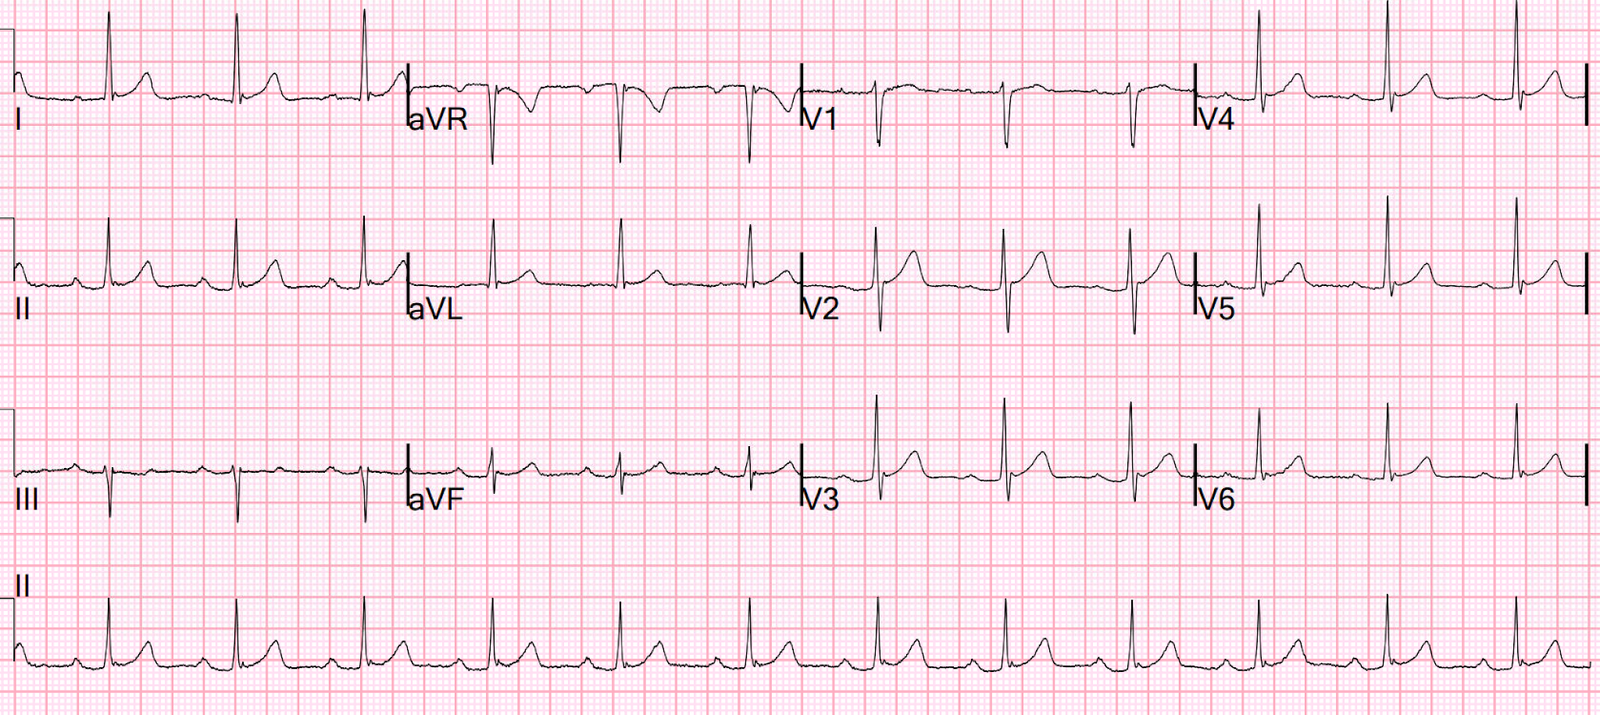
ECG 3 at 21 minutes

SINUS RHYTHM WITH FIRST DEGREE AV BLOCK
Overread same
Smith: Look at V2. All findings are now resolved.
However, the ST segments are still relatively straight.
ECG 4 55 min
SINUS RHYTHM WITH FIRST DEGREE AV BLOCK
Overread: previous in the same day, resolution of hyperacute T wave
Smith: Upward concavity is restored
Here are V1-V3 of all ECGs side by side for comparison:
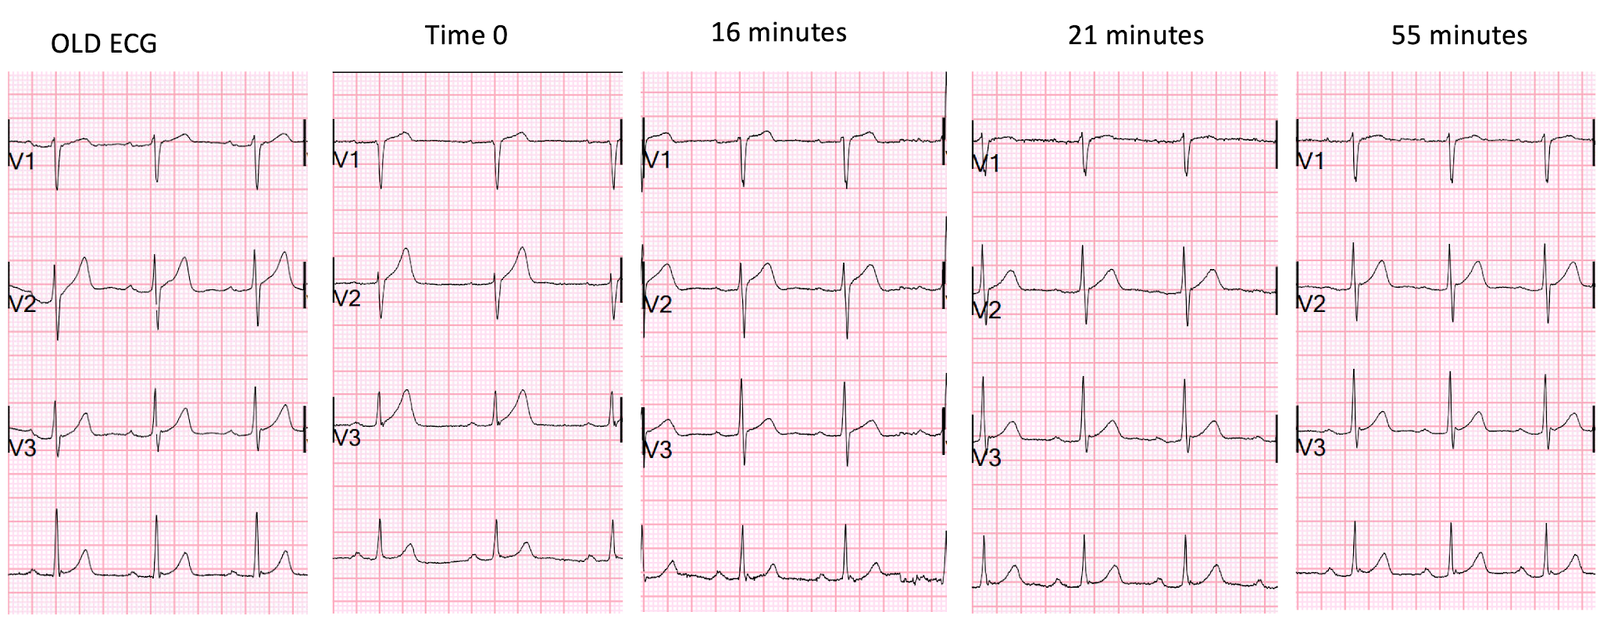
Time zero is with Occlusion, 16 minutes pain is resolving
Look at the subtle differences in T-waves, the terminal QRS distortion in V3 at time 0, the restoration of the S-wave in V3 after pain resolution at 16 minutes, the decrease in total size and height of T-waves at 16 minutes and thereafter, and the restoration of upward concavity at 21 and 55 minutes.
Because the pain was gone and the ECG improving, the cath lab was not activated. The chart says that “Cardiology agrees that the first ECG is early repolarization and similar to previous,” but recommended giving aspirin and starting heparin and to wait for the first troponin to discuss.
They also wanted an aortic CT which was negative.
This is a “Transient OMI”. Transient STEMI has been studied and many of these patients will re-occlude in the middle of the night. If you are prepared for this, they conclude that it is acceptable to wait until the morning for intervention. The Proximal LAD thrombus lysed or partially lysed, restoring flow.
Here it is not at all clear that they recognized that this was a transient OMI.
Lemkes et al. Timing of revascularization in patients with transient ST segment elevation myocardial infarction: a randomized clinical trial. Eur Heart J 2018. Full text link.
First troponin I returns at 48 ng/L
ECG 5 143 min

No significant change
ECG 6 261 min
Same
hs Troponin I profile (peaked at 1849):

Formal Echocardiogram
SUMMARY
The estimated left ventricular ejection fraction is 74 %.
The estimated pulmonary artery systolic pressure is 27 mmHg + RA pressure.
Normal left ventricular cavity size.
Normal estimated left ventricular ejection fraction .
No wall motion abnormality
This shows that significant ACS can have ZERO WMA!!
Angiogram
–LAD is a large-caliber vessel that wraps around the apex
–There is a tubular 80% in the ostial LAD that was relatively smooth but did not resolve with repeated doses of IC nitroglycerin
–There is a tiny D1, medium D2, and small D3
Lesion on Prox LAD: Ostial 80% stenosis. Pre-procedure TIMI III flow was noted. Post Procedure TIMI III flow was present.
ECG 7 24 hours

Now you see Wellens’ waves!!
Terminal T-wave inversion in V2-V4 (Wellens Pattern A)
This was read as “Normal ECG” by the overreading cardiologist
ECG 8 36 hours

Wellens’ waves here too, but less prominent.
V2 especially, V3 has artifact, and V4 has a sublte Wellens wave
This was read as “Normal ECG” by the overreading cardiologist
Wellens described reperfusion T-waves, but he did not explicitly link them to his own syndrome. See below.
Wellens’ waves and reperfusion T-waves are the same thing!
Wellen’s waves indicate that, when the patient was having chest pain, there was occlusion. After spontaneous reperfusion, the ST and/or hyperacute T-waves resolve and T-wave inversion evolves.
See these casese (and I have many others):
First ED ECG is Wellens’ (pain free). What do you think the prehospital ECG showed (with pain)?
Classic Evolution of Wellens’ T-waves over 26 hours
Why we need continuous 12-lead ST segment monitoring in Wellens’ syndrome
If you had recorded an ECG during chest pain, what would it have shown?
Evidence for Wellens as a reperfusion syndrome
To my knowledge, there is no research paper demonstrating this. From my experience, I am confident that if it were formally studied, it would be born out.
I believe that I was the first to represent Wellens as a reperfusion syndrome, in my book, The ECG in Acute MI, pages 22-23 and 51, and in chapter 27 on Reperfusion and Reocclusion.
My recognition of this was based papers by Wehrens and Doevendans on terminal T-wave inversion as a sign of reperfusion after use of thrombolytics. Notice that both papers have Wellens as senior author, and it is very curious that he did not make the connection between his own syndrome and the identical ECG he described in these studies!
Wehrens XH, Doevendans PA, Ophuis TJ, Wellens HJ. A comparison of electrocardiographic changes during reperfusion of acute myocardial infarction by thrombolysis or percutaneous transluminal coronary angioplasty. Am Heart J. 2000 Mar;139(3):430-6. PubMed PMID: 10689257.
Doevendans PA, Gorgels AP, van der Zee R, Partouns J, Bär FW, Wellens HJ. Electrocardiographic diagnosis of reperfusion during thrombolytic therapy in acute myocardial infarction. Am J Cardiol. 1995 Jun 15;75(17):1206-10. PubMed PMID: 7778540.
![]()
===================================
MY Comment, by KEN GRAUER, MD (9/7/2024):
===================================
The KEY to comparing to ECGs — is to put both ECGs next-to-each-other! Doing so greatly facilitates appreciation of any differences that might exist between the 2 tracings. Optimal comparison consists of 2 Steps:
- STEP #1: Make sure that lead-to-lead comparison will be accurate — by comparing the frontal plane axis and R wave progression in both tracings.
- STEP #2: Look lead-by-lead for any ST-T wave differences between the 2 tracings.
Today’s patient is an older man who present with shortness of breath and chest pain at the base of his right scapula — so this patient is having new symptoms (which means we need to pay extra attention to any new ECG findings we see).
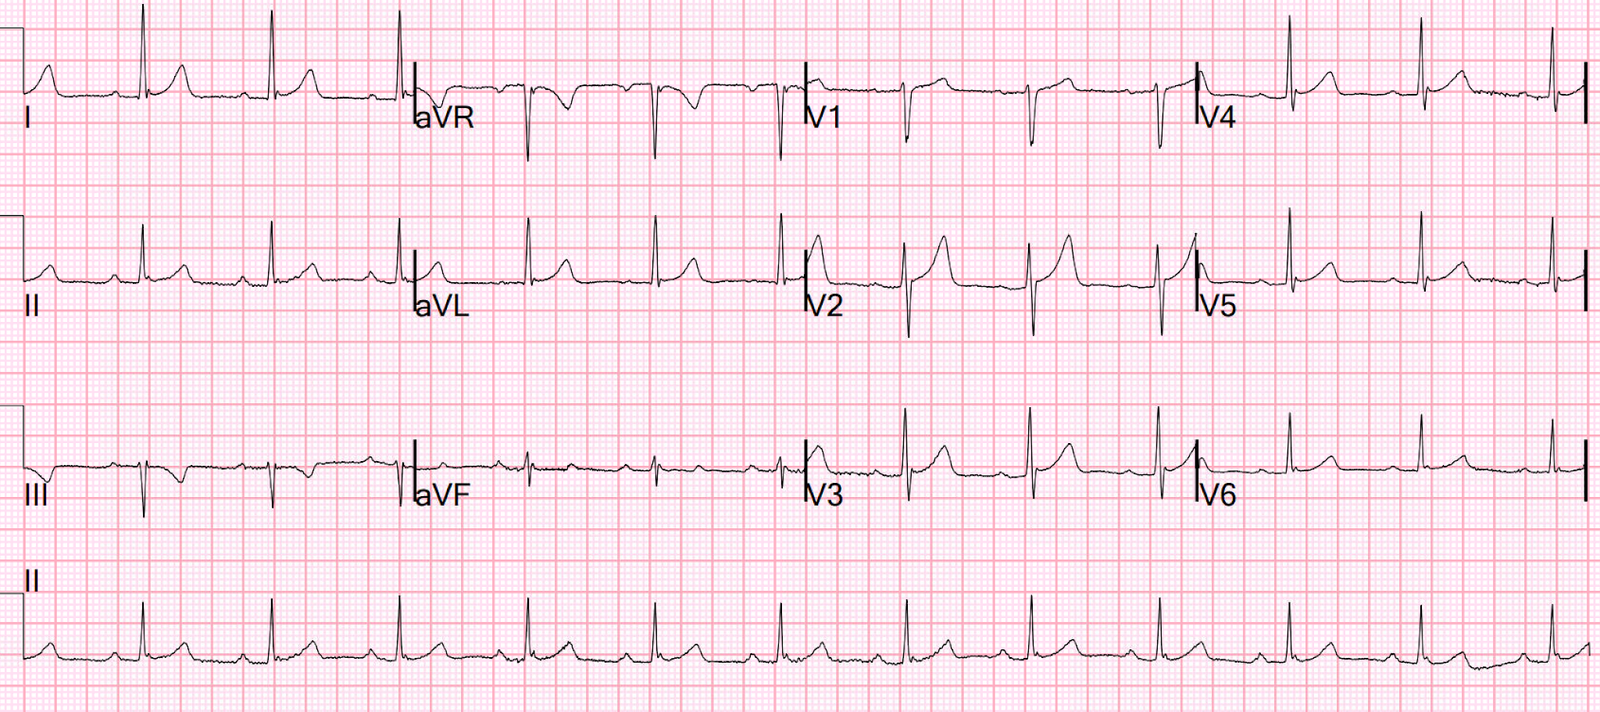
- Figure-1 compares the initial ECG — with a previous tracing done months earlier at a time when he was not having cardiac symptoms.
- Note that the frontal plane axis is different in the 2 tracings (The QRS is predominantly negative in lead III and isoelectric in aVF in ECG #1 — whereas the QRS is all positive in leads III and aVF in ECG #2). This may account for the fact that the T wave in lead III of ECG #1 is inverted (which it may sometimes normally be when the QRS in this lead is predominantly negative) — whereas the T wave in lead III of ECG #2 is upright.
- R wave progression (and QRS morphology) is also different in the 2 tracings. That said — I did not think the ST-T wave changes I’m about to describe in the chest leads were the result of this slight difference in precordial lead QRS morphology.
 |
| Figure-1: Comparison between the initial ECG and the previous ECG. |
What is the Difference between ECG #1 and ECG #2?
The emergency care provider did compare the 2 ECGs in Figure-1 — and wrote, “Early repolarization vs hyperacute T waves — minimal changes from previous tracing.” Putting both ECGs next-to-each-other as is done in Figure-1 suggests otherwise.
- The most striking difference between ECG #1 and ECG #2 is in the 2 leads within the RED rectangle. The T wave in lead V3 of ECG #1 is as tall as the R wave in this lead — or proportionately, much taller with respect to its associated R wave than was present on the previous ECG. Isn’t this T wave in lead V3 of ECG #1 also much bulkier (with a much wider base) than it was in ECG #2?
- The T wave in lead V2 of ECG #1 is also proportionately taller and more hypervoluminous than it appeared in the previous tracing (especially considering relative R wave amplitude in lead V2 for these 2 tracings).
- Leads V4, V5, and V6 in ECG #1 all show ST elevation — which was not present in the prior tracing.
- Finally — whereas the new T wave negativity in lead III of ECG #1 is not necessarily an abnormal finding (because of the more leftward frontal plane axis with predominant QRS negativity in lead III of ECG #1) — the down-up T wave that is seen in lead aVF of ECG #1 is clearly not a normal finding (double BLUE arrows in this lead).
- Impression: In a patient with new symptoms — early repolarization is a diagnosis of exclusion to be made only after you have ruled out the possibility of an acute event. In ECG #1 — the ST-T wave appearance of the 2 leads within the RED rectangle is not typical for a repolarization variant — nor is the down-up T wave in lead aVF — nor is the amount of ST elevation that we see in lead V4 which is neighboring to clearly abnormal leads V2,V3. And dynamic ST-T wave changes between ECG #1 and ECG #2 confirm an acute event in progress.
Learning Point:
It does not take more time to put the 2 ECGs you are comparing next-to-each-other. Doing so makes it so much easier to recognize important ST-T wave differences that otherwise are usually not detected.