
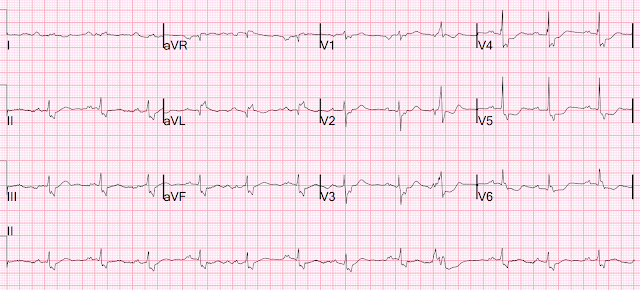
This ECG was sent to me with no information.

What do you think?
I responded: “Inferior OMI”
The sender then sent the clinical information:
A 50-something woman with a history of non-ischemic cardiomyopathy with EF of 20-25%, on HFrEF medications, complained of vomiting, upper back pain, and chest tightness that started on the day of presentation. She also complained of bilateral heaviness and weakness of the arms. She told another provider that she was short of breath especially with exertion.
These symptoms had started a couple days before: Her legs felt heavy. Then arms felt heavy. Then tried to walk up stairs and got very dyspneic. She got more concerned when early in the day of admission she developed nausea, vomiting, and left shoulder pain in addition to the symptoms previously noted. She came to the ED for further evaluation.
The EKG had been ordered by the triage physician 12 minutes after arrival, but it was not recorded until 90 minutes after arrival because the department was so busy.
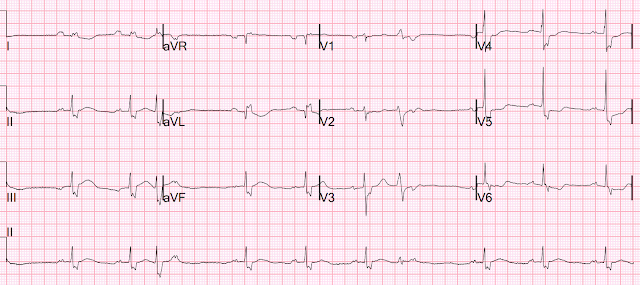
Here it is again, the same one as above:
= = =
= = =
There is an RBBB-like intraventricular conduction delay, with a wide S-wave in inferior leads and V2-V6. There is subtle STE in lead III with subtle reciprocal STD in aVL. The T-wave in III is very inflated (Hyperacute T-wave-HATW), with a large area under the curve, and the reciprocally inverted T-wave in aVL is equally hyperacute (inverted reciprocal HATW). There is ischemic ST depression in V4-6.
I said that this is all but diagnostic of acute inferior OMI.
This is a very difficult ECG, but it is diagnostic! And one must try to learn from it.
The PMCardio Queen of Hearts AI Model sees OMI, especially in lead III.
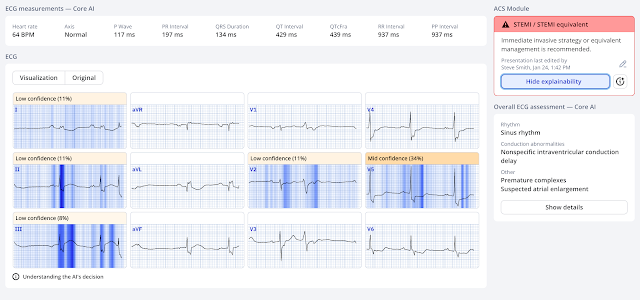
It is interesting that she does not highlight the reciprocal ST depression and reciprocally inverted hyperacute T-wave in aVL.
She gives is a score of 0.90, which is HIGHLY SPECIFIC (>98% specificity). All ECGs are given a number from 0-1.0. Scores above 0.50 have combined specificity of 98%, but within that range, if higher than 0.75, the the specificity is higher, and if lower, specificity is lower)
She does diagnose OMI (“STEMI/STEMI Equivalent”)
Unfortunately, the conventional computer algorithm saw nothing except IVCD and PVC, and the overreading emergency physician confirmed that reading without noting the evidence of OMI.
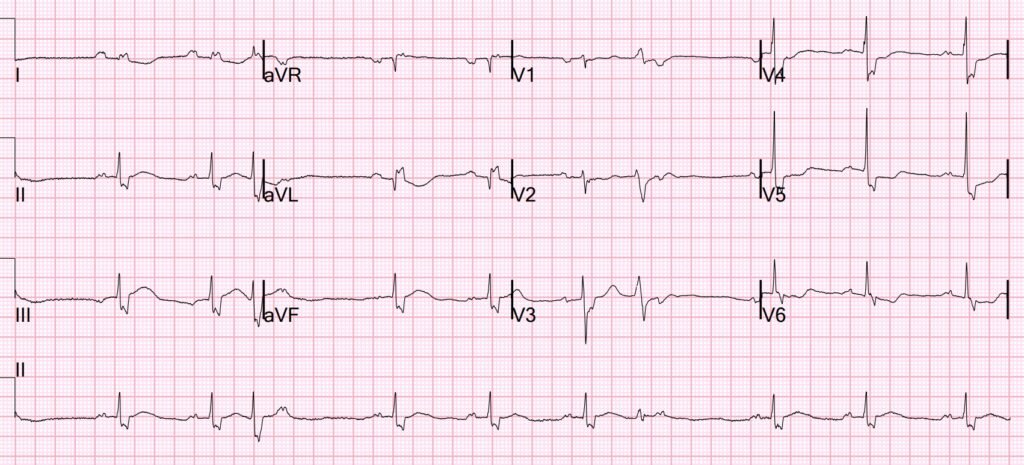
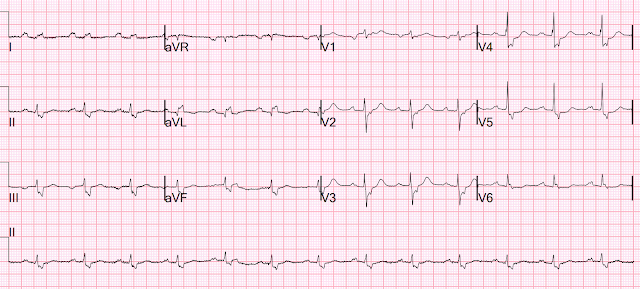
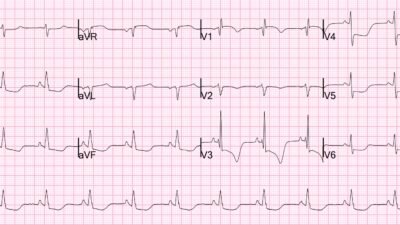
Old ECG 3 months ago:
(neither I nor the Queen had access to this)
Now you can see that the findings above are definitely new (acute).
= = =
She was roomed at 100 minutes after arrival, at which time an hs troponin I, which was drawn 1 hours after arrival, returned at 29 ng/L (elevated for a woman, with URL of 16 ng/L, but also consistent with chronic HFrEF; indeed, previous troponins had been in the 24-31 range)
Her exam was consistent with heart failure and an NT-proBNP was elevated at 3648 (this was near her baseline, and consistent with acute or chronic heart failure). Unfortunately, it is not unusual to have a slightly elevated troponin in chronic heart failure, so that elevated troponin did not worry anyone. A bedside echo showed diffuse B lines. Her chest x-ray showed pulmonary edema.
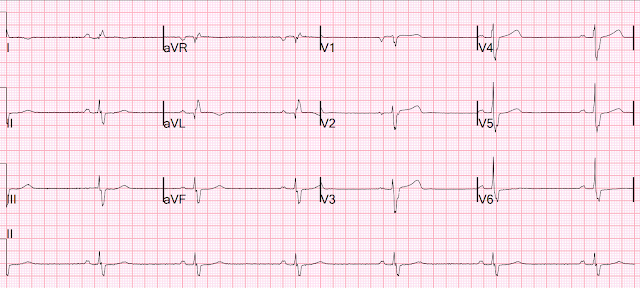
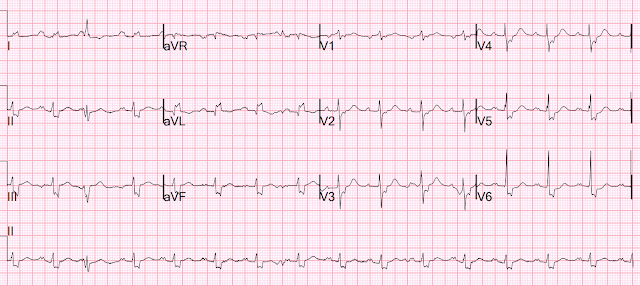
It is uncertain if the chest pain and arm pain were persistent, as there is no comment about it — but another ECG was recorded at 2.5 hours:
= = =
Another ECG was recorded at 2.5 hours:
This proves that the first ECG was indeed ischemic, as all the ischemic findings are gone!
The OMI has reperfused. But no one noticed …
Reperfused OMI are at very high risk of re-occlusion!!
= = =
At 3 hours after arrival, another troponin was drawn and returned at 247 ng/L. So there is definitely an acute myocardial infarction.
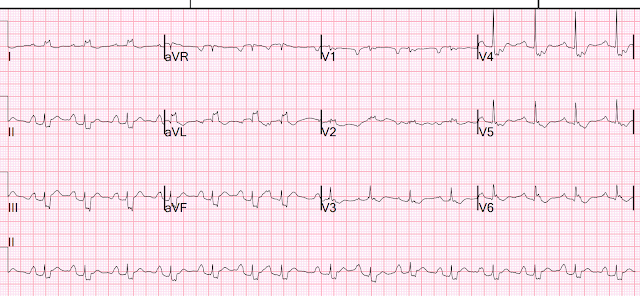
Another ECG was recorded at 5.5 hours.
= = =
At 6 hours after presentation, another troponin returned at 2945 ng/L.
Cardiology was consulted:
“No cardiac chest pain with presentation today. She reportedly had reproducible chest pain.”
“EKG with IVCD similar to prior but wider QRS duration mostly due to prominent S waves. There is a coving ST-T region in inferior leads with reciprocal changes in I and aVL. The reciprocity was present on an old EKG from 3 months ago though now more pronounced.”
Smith: I do not see any “coving” or reciprocity on the old ECG (above).
Cardiology continues: “In the setting of IVCD and prolonging QRSd, clinical certainty of these findings as markers of injury was discussed. Beyond the rising TnI, the clinical presentation was not consistent with acute coronary syndrome.”
Smith: Why not?
Let’s be clear: this patient has chest discomfort and a VERY high troponin. It is an excuse to call the chest pain “reproducible”. There is bilateral arm pain, which has a very high pretest probability. This is now proven ischemic cardiac chest pain and it is continuous. Therefore the patient needs the cath lab NOW.
Another ECG was recorded:
= = =
She was admitted to the hospital, and oxygen requirements rose to 10 liters (worsening pulmonary edema).
Her troponins rose to 13,000 to 19,000, then to 28,000.
Another ECG at 11 hours was similar.
Then, at 16 hours after arrival, she had a ventricular fibrillation (VF arrest).
She was resuscitated and had this ECG recorded.
There is no apparent ischemia at this point in time.
= = =
Troponin profile — first is on the far right, last on the far left.
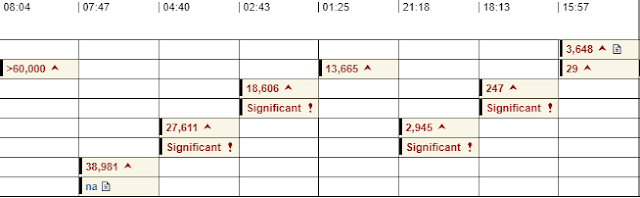
So peak troponin was greater than 60,000, which is a massive MI.
Too high to measure. And it was apparent on the very first ECG, at which time there could have been an intervention.
So at this point, one must assume that the ECG represents missed OMI, and that it was missed.
This is why “NSTEMI” is a totally worthless diagnosis and worthless diagnosis.
To illustrate how worthless “NSTEMI” is, consider this: We showed that the final diagnosis of STEMI vs. NSTEMI has little to do with the presence or absence of occlusion, and little to do with the presence or absence of ST Elevation. It only correlates with Door to Balloon Time!
= = =
Angiogram:
- Acute MI Non ST Elevation Myocardial Infarction .
- Complicated by Polymorphic VT (Smith: probably really VF), prolonged CPR in CMIC unit, brought emergently to the CCL
- Culprit is 100% stenosis in the distal LCX .
- Lesion was reduced to 0 % using 2.75 x 20 Synergy DES .
- IVUS assessment of LCX done to assess for SCAD presence. There was no SCAD, but there was thrombotic occlusion of the distal LCX with no obvious ruptured plaque. = =
Patient with cardiogenic shock, balloon pump placed.
Final comment: it is unclear why only the first ECG showed the OMI. Probably the artery was opening and closing, and was only recorded once during an occluded phase. But was again occluded at angiogram.
= Echo:
- Study was interrupted for 18 minutes because of VT and need for resuscitation.
- Mildly enlarged left ventricular cavity size, mildly increased wall thickness, and severe LV systolic dysfunction.
- The estimated left ventricular ejection fraction is 10-15 %.
- Severe global hypokinesis. Asynchronous interventricular septal motion IVCD possible.= = =
Unfortunately, after a long hospital course, the patient died.
Learning Points:
- Deadly ECGs can be completely missed by humans, and we should not expect such expertise. The Queen can also miss and overcall, but far less often than humans. When the Queen (using the ECG only) is compared to humans (who have all the data in front of them: ECG, history, physical exam, and old records), and the Queen and humans disagree, the Queen is 7.5x more likely to be correct than the human!
- We are hoping the Queen of Hearts will be FDA approved and available soon.
- Always compare with a previous ECG! Although inconvenient, the difference might have been apparent and possibly saved a life.
- When there is chest pain and an unexplained elevated troponin, which was certainly true at 3 hours after arrival (at which time the troponin had risen from 29 to 247), that rise is diagnostic of MI and if there is any remaining chest pain, SOB, pulmonary edema, then the patient must go to the cath lab regardless of the ECG!
- NSTEMI is a worthless diagnosis. Absence of diagnostic STE only describes one isolated ECG finding but says almost nothing about presence or absence of acute coronary occlusion or about the patient’s condition.
- NSTEMI with “instability” is a guideline indication for emergent cath lab activation, (though followed in only 6% of cases)
- NSTEMI with “instability” is usually a missed OMI with complications!
======================================
MY Comment, by KEN GRAUER, MD (7/1/2026):
I had a “bad feeling” as I read this case. Like Dr. Smith — I looked at today’s initial ECG before I looked at any clinical information.
- I focus my comment on today’s initial ECG — that I have labeled in Figure-1.
= = =
QUESTION:
- What are the unusual features in today’s initial ECG?
Figure-1: I’ve labeled the initial ECG in today’s case.
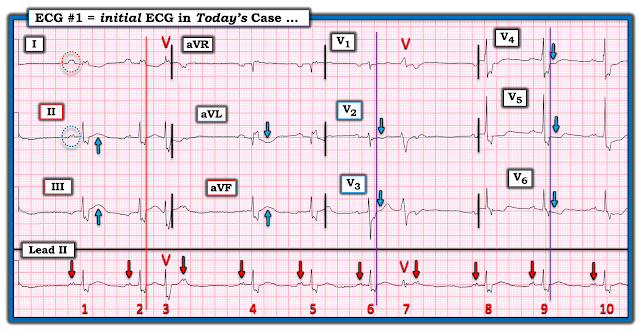
MY Sequential Approach to the ECG in Figure-1:
I found the initial ECG in Figure-1 remarkable for a series of unusual features. I suspect that failure to appreciate these features led providers to discounting the possibility of an acute event until the patient developed VFib (which occurred many hours after progressively increasing Troponin levels began to return).
- The rhythm in Figure-1 is sinus arrhythmia with 2 PVCs ( = beats #3 and 7).
- NOTE #1: Despite the similarity in QRS appearance between beat #3 and the sinus-conducted beats in the long lead II rhythm strip — and despite the seemingly narrow appearance of beat #7 in the long lead II — both of these beats are PVCs! This is clinically relevant — because optimal assessment of ST-T wave morphology for ischemic change is much more accurately accomplished by looking at sinus-conducted beats instead of at PVCs.
- We know that beats #3 and #7 are PVCs because: i) Both of these beats occur before on–time sinus P waves (whereas if these beats were PACs or PJCs — they would have disturbed the underlying sinus P wave rhythm); — and, ii) QRS morphology of beat #3 in simultaneously-recorded lead I looks very different than the 2 sinus-conducted beats in this lead — and beat #7 is neither narrow nor similar in morphology compared to sinus-conducted beat #6 in simultaneously-recorded leads V1,V2,V3.
- NOTE #2: There is no evidence of AV block in Figure-1. It just looks strange to see on-time P waves (as we do after beats #3 and 7) that are not followed by QRS complexes. This is because on-time P waves are usually hidden within the ST-T wave of PVCs that precede them. But because the ST-T waves of the 2 PVCs in this long lead II rhythm strip are nearly isoelectric — we clearly see these on-time notched P waves after beats #3 and #7.
QRS morphology of the ECG in Figure-1 is bizarre:
- To ensure that I was correctly measuring QRS duration — I selected the QRS complex in lead I as my reference point — with the vertical RED line that I drew through simultaneously-recorded leads I,II,III and the long lead rhythm strip marking the end of the QRS complex.
- Therefore — everything to the left of this RED line is part of the QRS complex — with the ST segment beginning immediately to the right of this vertical line.
- Carrying on upward from this point for beats #6 and #9 of the long lead II rhythm strip with a vertical PURPLE line delineates the beginning of the ST segment that starts immediately to the right of this PURPLE line in simultaneously-recorded leads V1,V2,V3 and V4,V5,V6.
- Using these landmarks to define the limits of the QRS complex in each of the 12 leads reveals a QRS morphology unlike any known form of conduction defect — with marked fragmentation (notching) in virtually every lead and bizarre narrow-R wave/wide-notched S waves in 7 leads, with much of the QRS being flat on the baseline in leads V1,V2.
- PEARL #1: Even before learning that this patient had a history of peripartum cardiomyopathy with severe LV dysfunction — the above described QRS morphologic abnormalities are diagnostic of some form of severe cardiomyopathy (or other severe form of underlying heart disease).
The abnormal P wave morphology:
- The P wave in lead I in Figure-1 — is clearly larger than the P wave in lead II (compare the P waves within the dotted RED and BLUE circles). While this P wave finding is usually a tip-off to either a non-sinus rhythm or to LA-LL Reversal — I do not believe either of these conditions is present. Instead — I interpreted the rhythm as sinus, with marked P wave deformity as a result of significant intra-atrial conduction defect.
- The parameters I describe in Figure-3 of My Comment in the June 25, 2024 post of Dr. Smith’s ECG Blog, which characterize LA-LL Reversal do not “fit” in today’s tracing.
- Instead — there is P wave notching in virtually all leads in Figure-1 — and this diffuse P wave notching picture is consistent in each of the 6 tracings shown in today’s case.
- PEARL #2: It is sometimes difficult to distinguish on ECG between atrial enlargement vs intra-atrial conduction defects vs a combination of both. But finding the largest P wave in an unusual location (lead I instead of lead II) — in association with unusual P wave notching in virtually all leads is diagnostic of intra-atrial conduction defect. Even before knowing about this patient’s longterm compromised LV function — the combination of this intra-atrial conduction defect plus this patient’s bizarre QRS conduction defect with marked “scarring” (fragmentation) should alert providers to the severity of her condition.
The acute OMI that was missed:
- As discussed by Dr. Smith above — today’s initial ECG is highly suspicious for acute inferior OMI. While more challenging to assess ST-T waves for acute ischemic change when there is a conduction defect — the BLUE arrowsin each of the 3 inferior leads highlight coved, hypervoluminous (if not slightly elevated) ST-T waves — with reciprocal (mirror-image opposite) ST depression in lead aVL (and to a lesser extent in lead I).
- In leads V2,V3 — BLUE arrows placed at the onset of the ST segment in these leads highlight abnormal ST segment straightening (loss of the normal slight upward sloping ST segment in these leads).
- BLUE arrows in leads V4,V5,V6 highlight abnormal ST segment flattening with ST depression.
- Impression: Even before comparing ECG #1 with the prior ECG from 3 months earlier — and before subsequent ECGs in today’s case confirmed “dynamic” ST-T wave changes — and before return of progressively elevated Troponin levels — the abnormal ST-T waves in virtually all leads of this ECG strongly suggest acute inferior OMI until proven otherwise.
= = =
Lessons to Be Learned:
- The history in today’s case is not inconsistent with an acute cardiac event. Although the patient did not report CP (Chest Pain) as her predominant symptom — she did complain of “chest tightness” — as well as “left shoulder pain”.
- Among the symptom complex reported by today’s patient — increasing dyspnea and weakness appeared to predominate (and the patient was clearly found to be in heart failure on her initial exam).
- PEARL #3: Remember the lessons taught by the Framingham studies (which I described in the December 6, 2022 post, among others): — The incidence of “Silent MI” in which the patient does not have CP, is as high as ~30% of all MIs. And, among non-CP equivalent symptoms in patients with “silent” MI — new shortness of breath is the most common (not to mention that a new heart failure exacerbation will not uncommonly be precipitated by an acute MI that either is or is not accompanied by CP).
- The combined presence of the intra-atrial conduction defect + the highly unusual ventricular conduction defect with diffuse fragmentation on today’s initial ECG — strongly suggests a significantly compromised patient (even before learning specifics of this patient’s previous medical history).
- Considering the above 4 bullets — the presence of the abnormal ST-T wave findings highlighted by the BLUE arrows in Figure-1 places the onus of proof on us as the provider to rule out an acute event, rather than the other way around.

