Written by Pendell Meyers, comments of course by Smith. Sent by anonymous
A man in his 50s was walking his dog early in the morning when he suddenly experienced acute chest pain.
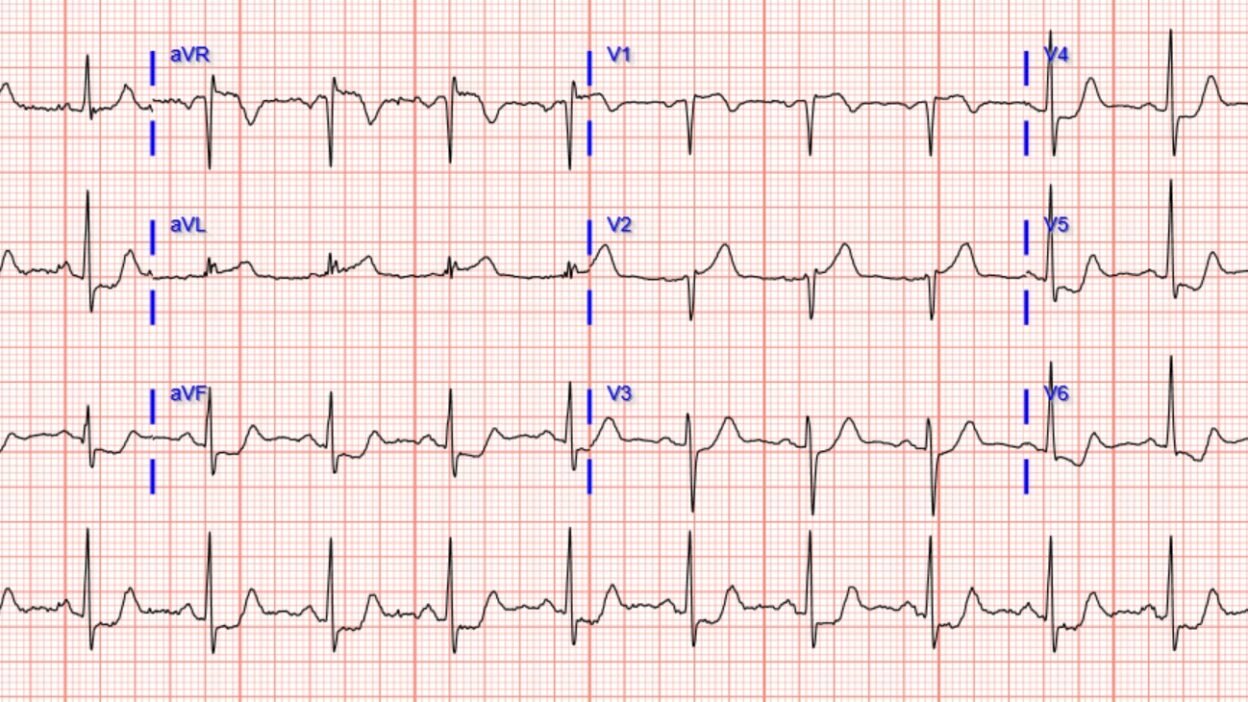
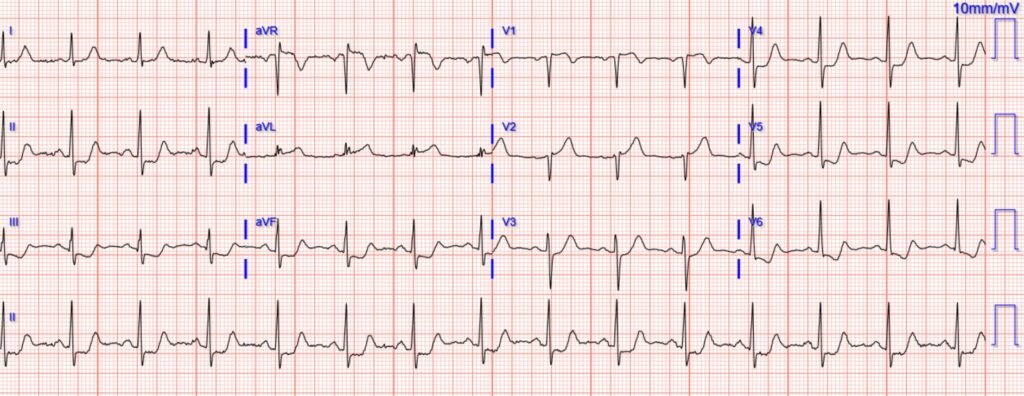
He presented to the ED and had an ECG recorded at 0658:
What do you think?
Sinus rhythm, grossly normal QRS, with diagnostic findings of acute LAD occlusion: precordial swirl pattern (STE in V1-V2, hyperacute T wave in V2, ST depression in lateral precordial leads V5-6), and also aVL HATW with inferior reciprocal depression. It is a mix of South African Flag sign and Precordial swirl, both of which indicate proximal LAD Occlusion. You could also describe it as a mix of LAD occlusion pattern superimposed on a subendocardial ischemia pattern.
Precordial Swirl — 20 cases of Swirl or Look-Alikes
Regardless, it is very specific for LAD occlusion, even though it is not a “STEMI” using the conventional STEMI/NSTEMI paradigm (remember, NSTEMI is a worthless diagnosis).
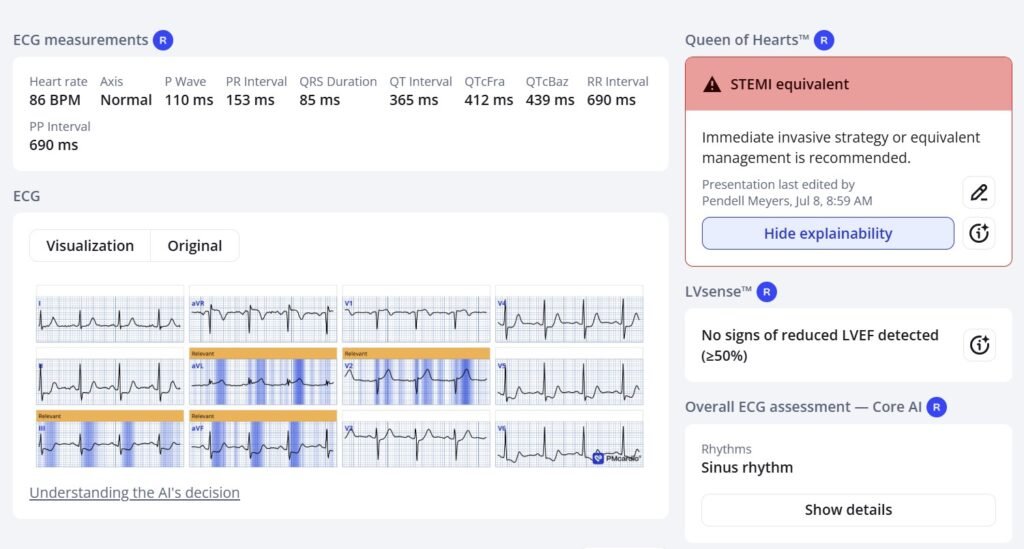
Here is what the Queen of Hearts thinks. Notice she does not highlight the ST depression in V4-6, and I believe that is because that could be due to simple subendocardial ischemia (which is also bad, but not necessarily due to complete coronary occlusion or even of ACS). What she does see is the STE in aVL with reciprocal inferior ST depression, and the hyperacute T-wave in V2:
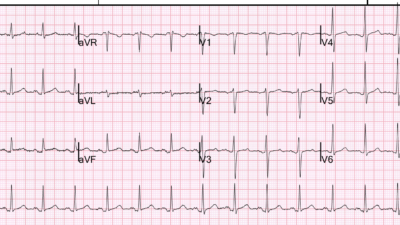
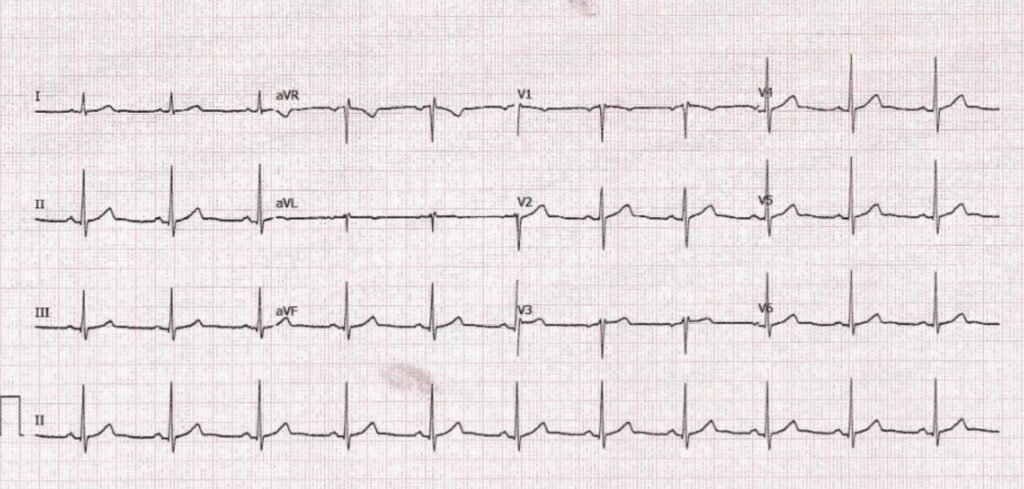
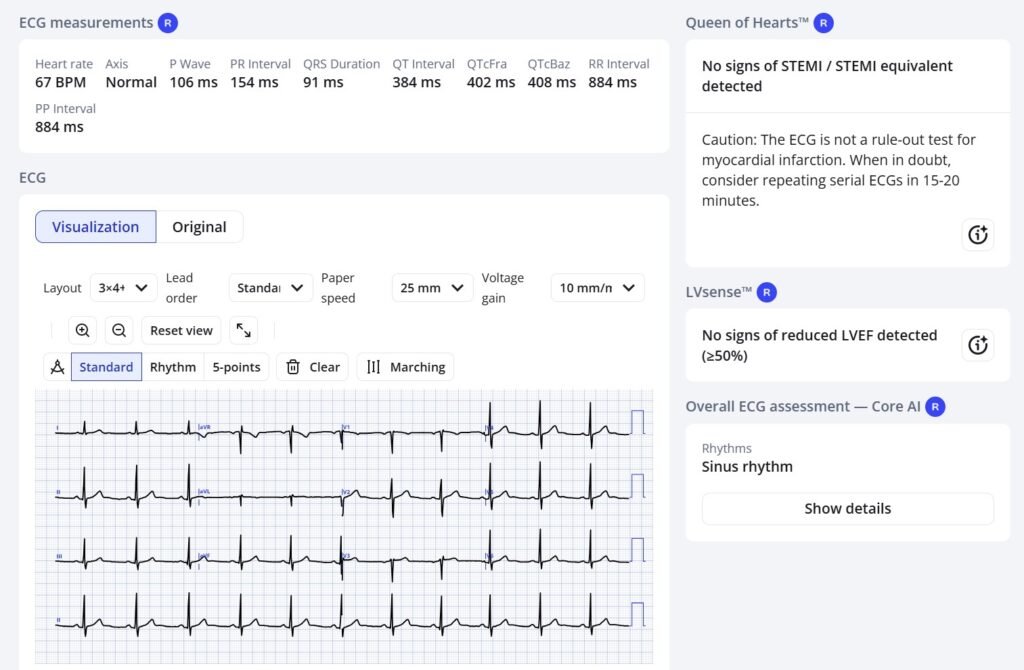
A baseline ECG was available for those who are unfamiliar with OMI patterns and thus might need one:
Unfortunately, the ECG was deemed “not STEMI”, and the patient was given aspirin but no emergent reperfusion therapy was planned on initial evaluation. There was also a comment that his pain had improved since onset.
About 45 minutes later, the patient suffered ventricular fibrillation cardiac arrest.
He was defibrillated and achieved return of spontaneous circulation.
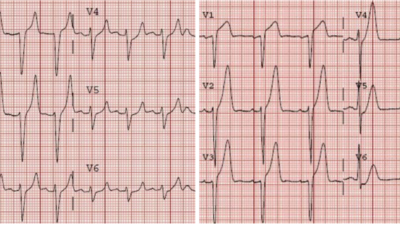
Here is his ECG about 10 minutes later:
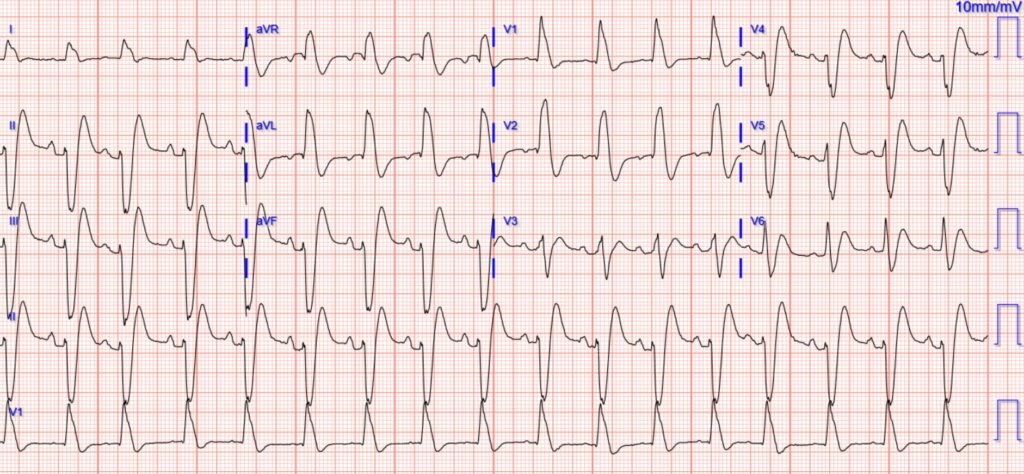
New RBBB/LAFB pattern is an extremely high risk feature of LAD OMIs.
Smith: Notice how difficult it is to see OMI signs when there is right bundle branch block and left anterior fascicular block (RBBB + LAFB). This is a pattern that goes far beyond STEMI/NSTEMI, and is incredibly dangerous and hard to recognize. Any time you see RBBB + LAFB in acute OMI, the patient is about to arrest, has just been resuscitated, or is in cardiogenic shock, because it is associated with left main or proximal LAD and a huge amount of ischemic myocardium.
See these posts on RBBB + LAFB:
Wide Complex Tachycardia; It’s really sinus, RBBB + LAFB, and massive ST elevation
68 minutes with chest compressions, full recovery. Plus recommendations from a 5-member panel on cardiac arrest. (When I showed this one to the interventionalist and said “Proximal LAD occlusion”, he just rolled his eyes and said “Maybe!”
See cases 2 and 6 here: How does Acute Total Left Main Coronary occlusion present on the ECG?
What, besides large anterior OMI, is so ominous about this ECG?
And many more: RBBB with LAFB (Left Anterior Fascicular Block)
The Queen of Hearts makes the diagnosis because she sees that the T-waves in V4-6 are hyperacute
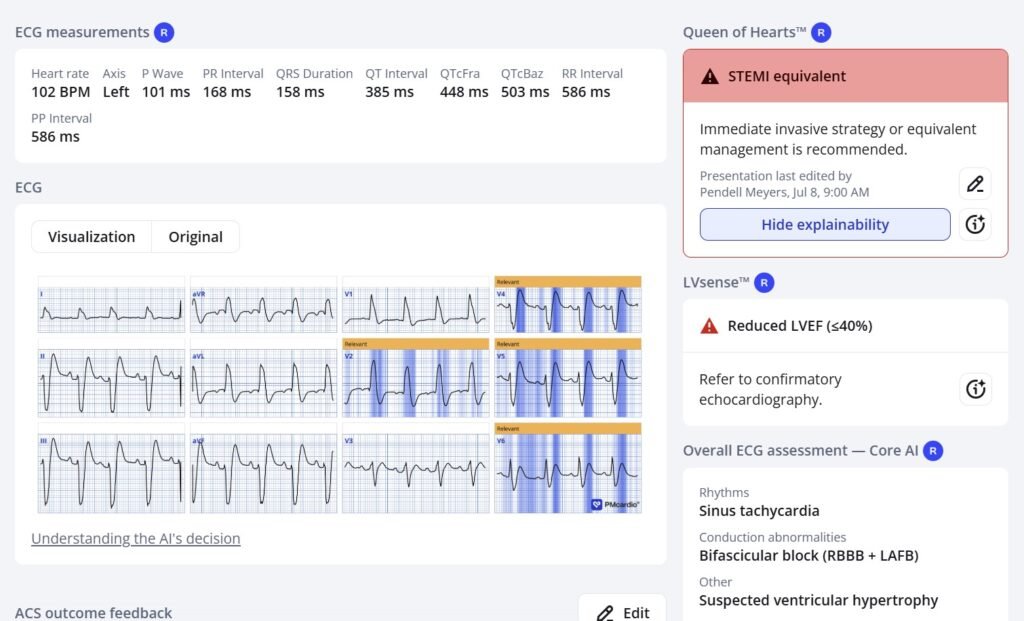
The initial troponin from triage returned at 50 ng/L. If this were the Abbott Architect hs-cTnI assay, the value is below the European Society of Cardiology cutoff of 52 ng/L for making a diagnosis of acute type I MI with PPV of ~70%, based on the first troponin. First troponins are not reliable for the diagnosis of myocardial infarction, even of acute coronary occlusion myocardial infarction!
After the cardiac arrest and subsequent ECG, he was finally perceived as “having a STEMI”, and was taken to the cath lab:
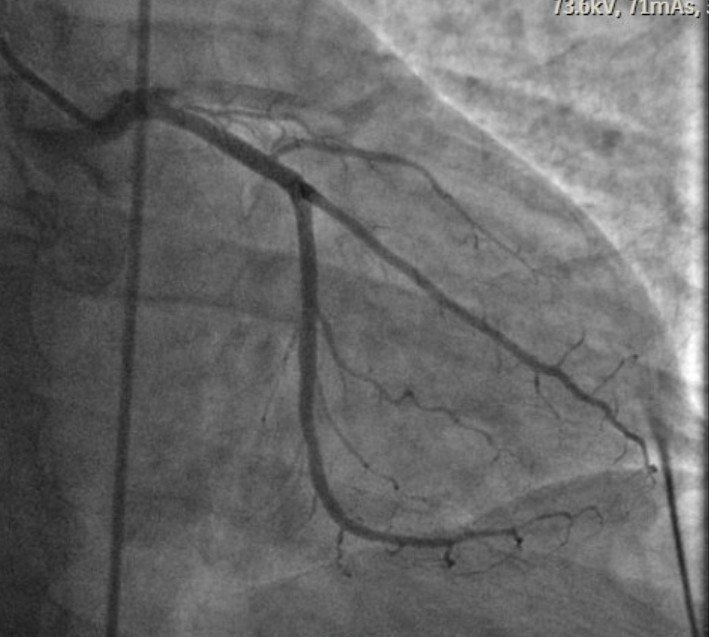
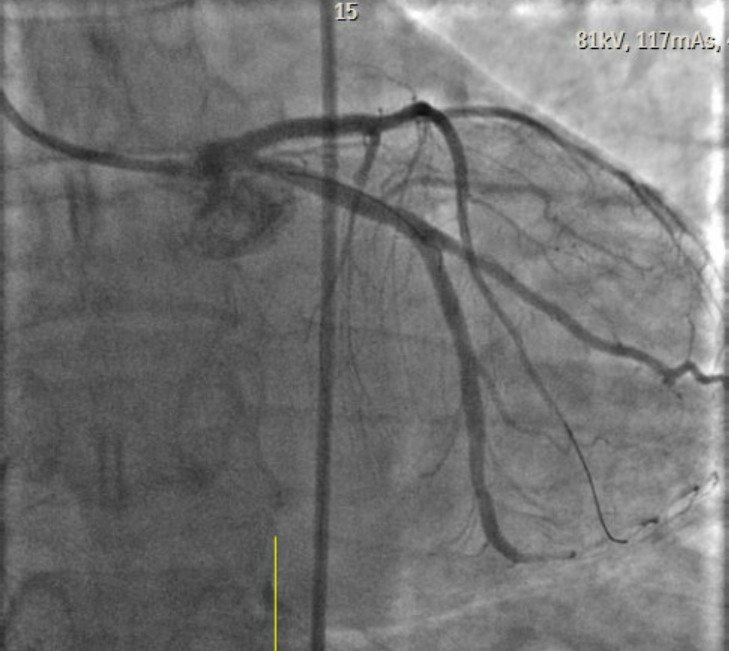
Proximally occluded LAD above, opened below.
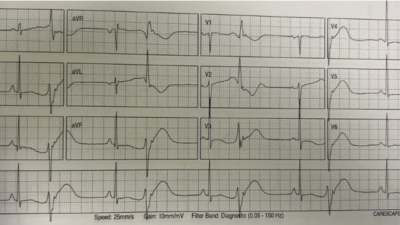
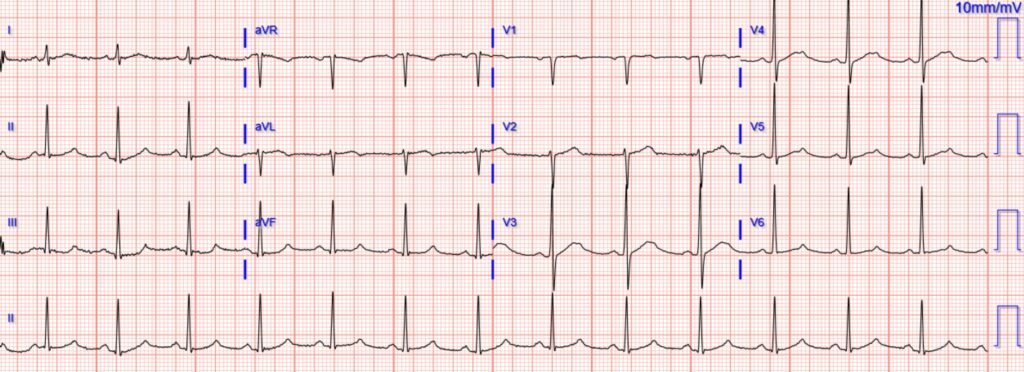
Post cath ECG:
The subsequent ejection fraction (EF) was 35% with anterior wall motion abnormality.
The second troponin was around 7000 ng/L, and none further were measured.
The patient survived to discharge, but long term outcome is unknown.
Smith: Such a long delay to reperfusion in total proximal LAD OMI is highly likely to result in a large amount of infarcted myocardium and permanently low ejection fraction (EF). This patient probably has permanent heart failure with reduced ejection fraction (HFrEF), which has high 5 year and 10 year mortality, and results in suffering from lifestyle limitations and shortness of breath.
Remember this graph: 80% of the benefit of reperfusion therapy is lost at 4 hours after chest pain onset.
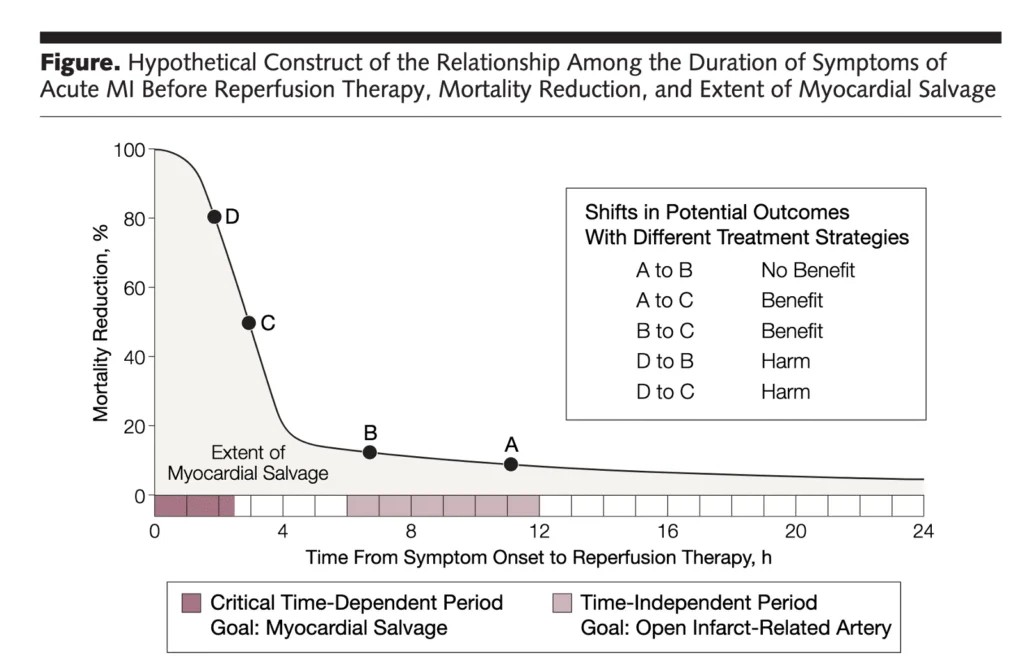
Gersh BJ, Stone GW, White HD, Holmes DR Jr. Pharmacological facilitation of primary percutaneous coronary intervention for acute myocardial infarction: is the slope of the curve the shape of the future? JAMA [Internet] 2005;293(8):979–86. Available from: http://www.ncbi.nlm.nih.gov/entrez/query.fcgi?cmd=Retrieve&db=PubMed&dopt=Citation&list_uids=15728169Learning Point:
If you want to best treat patients with acute myocardial infarction, you must become proficient at ECG interpretation, or use an accurate AI ECG model (the only one in existence is the PMCardio Queen of Hearts AI model, and we hope it will be FDA approved soon) Typical training and current guidelines are not sufficient.
Smith: I believe that it is nearly impossible for humans to be as accurate as the PMCardio Queen of Hearts. I believe this because I’ve been teaching this for 25 years and find that humans just cannot learn it adequately. It takes too much time and also a special talent for seeing sublte waveform morphologies. You should know that I own stock in the company, but all my teaching and research over 35 years has been without reimbursement or funding of any kind. I do it to save lives, not to make money. My motivation for promoting the Queen is to save lives and myocardium.
= = =
==================================
MY Comment, by KEN GRAUER, MD (7/13/2026):
I found the sequential progression of the 3 ECGs in today’s case to be fascinating — as well as different from the usual course of an acute ongoing OMI. As a result — there are important lessons to be learned!
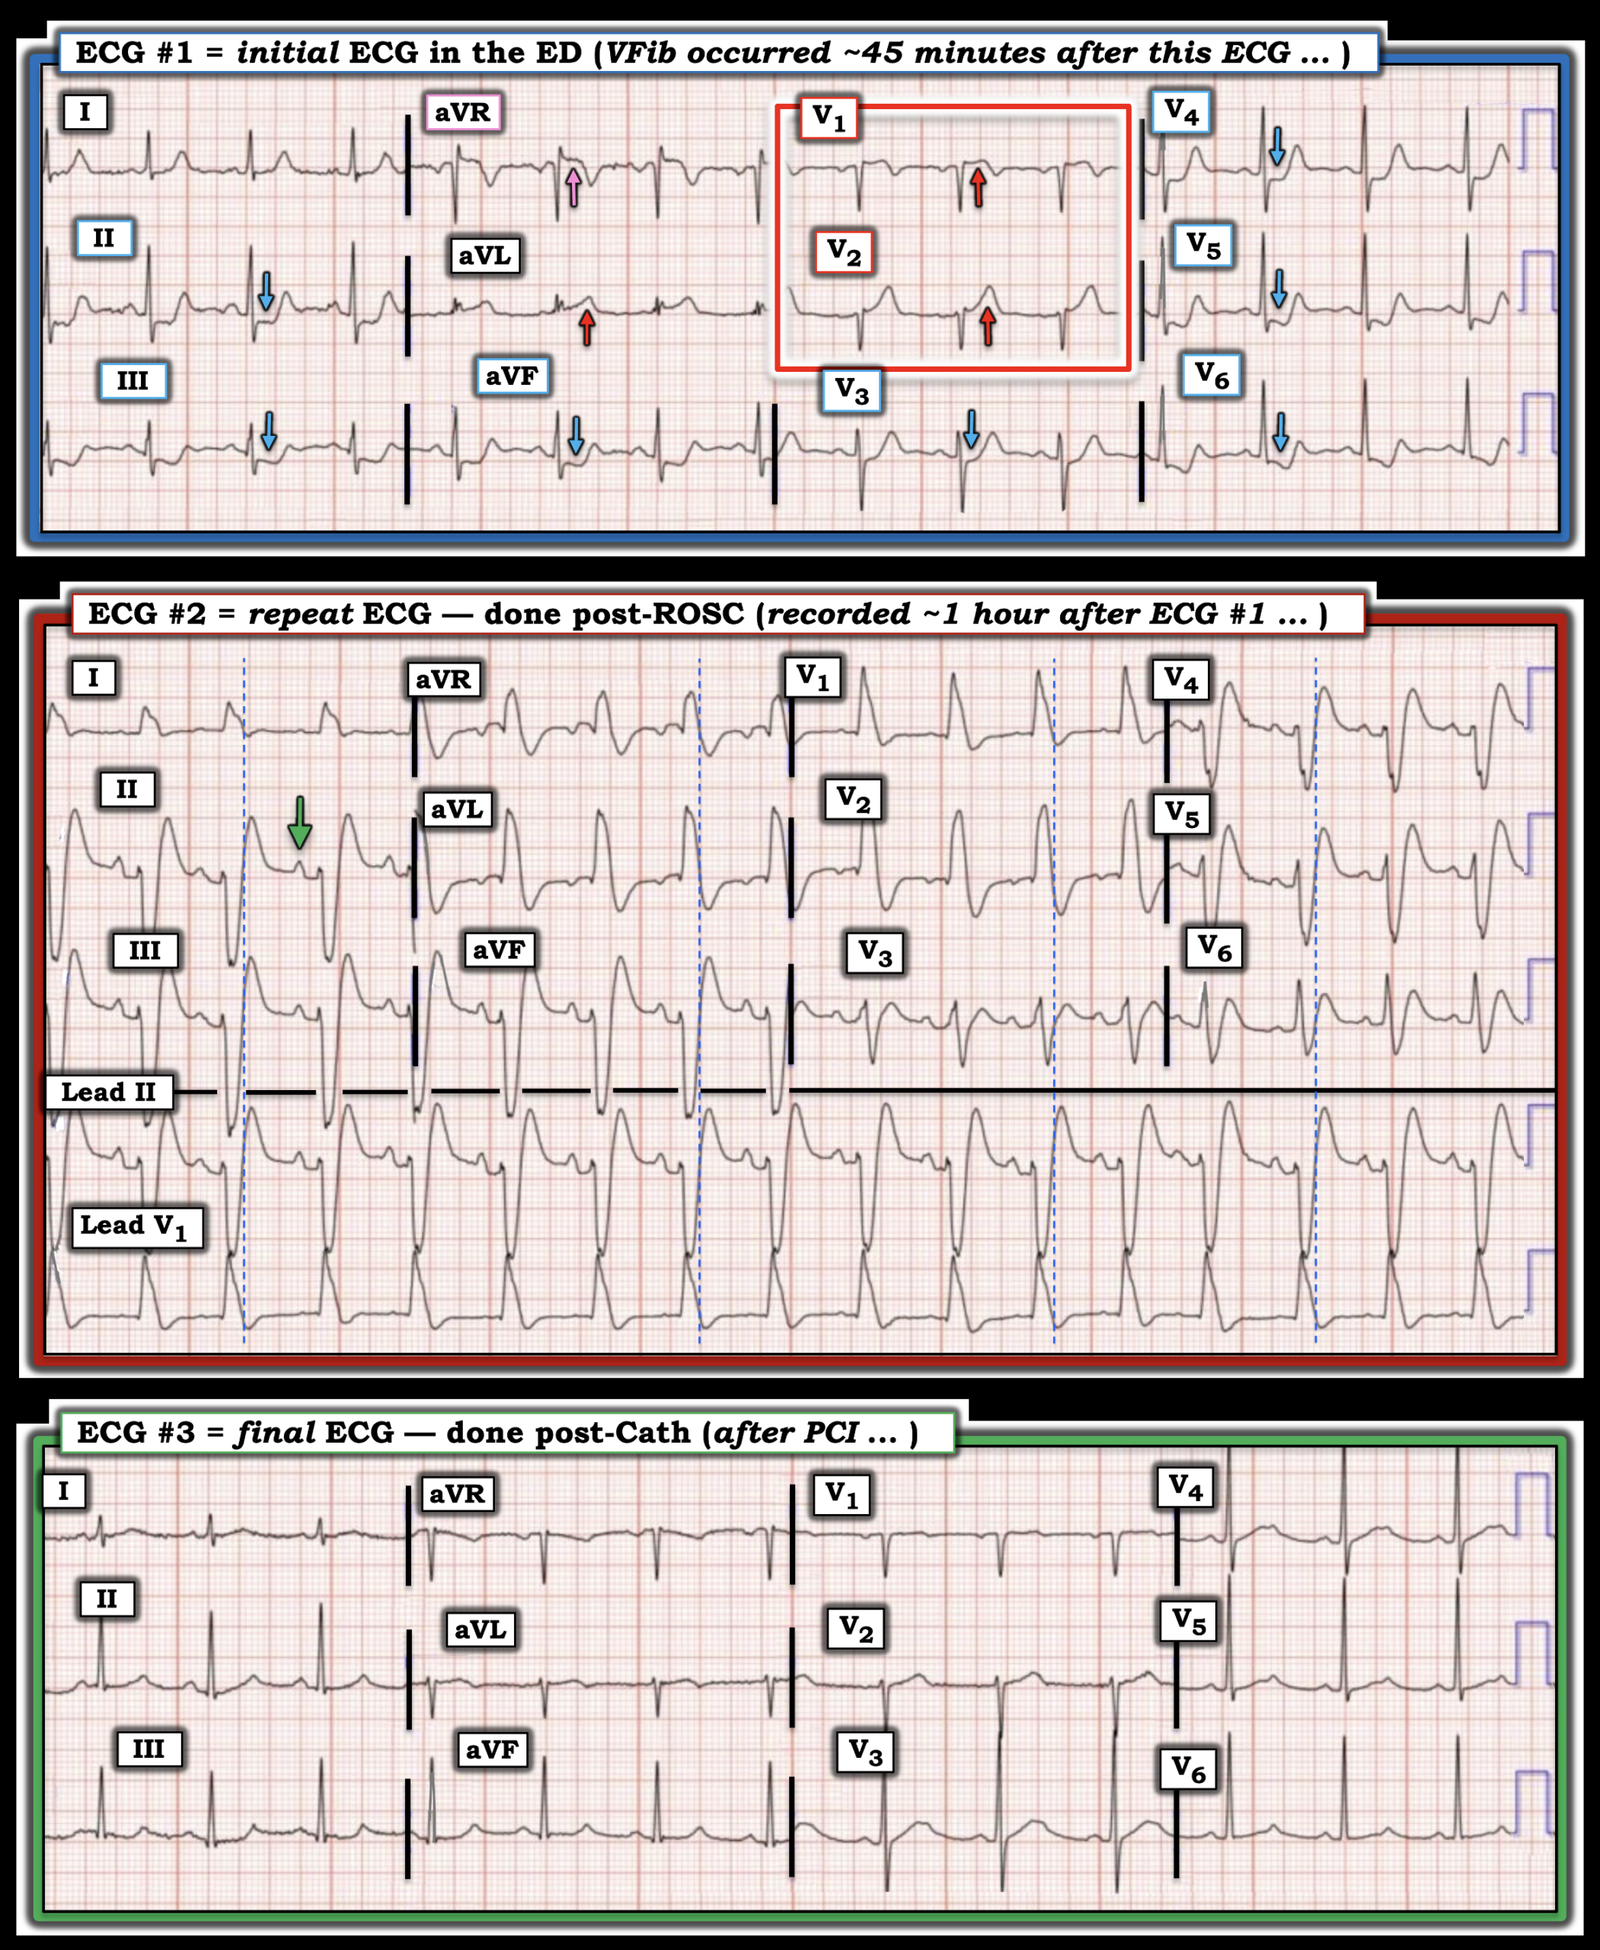
- To facilitate comparison between these 3 sequential ECGs — I’ve put them together in Figure-1.
= = =
The Initial ECG …
The “Take Home“ Message from ECG #1 — is that in a 50-something year old adult who presents with sudden acute CP (Chest Pain) — We should recognize within seconds that prompt cath is needed! I’ve labeled the KEY findings in Figure-1:
- The rhythm is sinus at ~85/minute. The intervals and axis are normal. There is no chamber enlargement.
- The “eye-catching” finding is highlighted by the BLUE arrows in Figure-1 that show marked ST depression in multiple leads. Of special concern is that this ST depression is sharply downsloping in leads III,aVF; and inV5,V6 — with terminal T wave positivity in all the leads with BLUE arrows. In a patient with new CP — these findings suggest an acute OMI in progress until proven otherwise (which can only be done by performing prompt cardiac cath).
- As per Dr. Meyers — localization of the “culprit” artery to the proximal LAD is suggested by the hyperacute ST-T waves in leads V1,V2 (within the RED rectangle).
- The overly “bulky” upright T wave in lead V2 is clearly disproportionate with respect to the small size of the S wave in this lead.
- Although ST-T wave changes are more subtle in lead V1 — there is abnormal J-point ST elevation (given small size of the S wave in this lead) — with straightening of the ST segment takeoff and overly deep T wave inversion. As per Dr. Meyers — in association with lateral chest lead ST depression, these findings are consistent with a Precordial Swirl pattern (See My Comment at the bottom of the page in the October 15, 2022 post — for more on recognizing the features of “Swirl” in leads V1,V2 and V5,V6).
- Dr. Meyers also alludes to a component of DSI (Diffuse Subendocardial Ischemia) in ECG #1 — that is suggested by ST depression in multiple leads in association with ST elevation in lead aVR (the PINK arrow in this lead). (More on DSI in My Comment from the December 30, 2025 post).
= = =
- Beyond-the-Core: Actually — there are acute ST-T wave changes in all 12 leads! Although the ST-T wave abnormalities seem less prominent in lead I and lead V3 — this is not because ST-T wave changes are “less” — but rather because both of these leads represent areas of “transition”.
- For lateral lead I — the transition is between the hyperacute ST-T wave in the other high-lateral lead ( = lead aVL) — and the ST depression that progressively worsens as we move from lead II (at +60 degrees) — to leads aVF and III (at +90 and then +120 degrees).
- For anterior lead V3 — the transition is between the hyperacute ST-T wave changes in leads V1,V2 — and the ST depression that progressively worsens as we move from lead V4 — to leads V5,V6.
Bottom Line: Even before determining the site of the “culprit” artery — it should be evident from the history (new-onset CP) and from the depth and shape of the ST depression highlighted by the BLUE arrows in ECG #1 — that prompt cardiac cath is needed.
= = =
Figure-1: Comparison between the 3 ECGs in today’s Case.
= = =
Ischemic-induced QRS Widening …
As described in Dr. Meyers’ above discussion — today’s patient developed VFib ~45 minutes after ECG #1 was recorded.
- ECG #2 is the repeat ECG that was done ~10 minutes later, after successful ROSC. Note that although there is now marked QRS widening — the rhythm in ECG #2 is sinus (as per the GREEN arrow upright P wave that is shown in lead II).
- Although tempting to label ECG #2 as simply showing RBBB/LAHB because of the tall R wave in lead V1 and the predominantly negative QRS in the inferior leads (with this form of bifascicular block being a common feature of high-risk acute proximal LAD occlusion) — I thought in addition, that there is more to this tracing.
- I initially interpreted ECG #2 as showing “Shark Fin” ST segment deviations of elevation and depression (See My Comment in the August 8, 2025 post— for more on “Shark Fin”). But “Shark Fin”ST segment elevation and depression occur after the QRS — whereas the dotted BLUE lines that I added to each of the lead groups in ECG #2 delineate what looks to be the end of a very wide QRS complex (ie, ≥0.15 second).
- Therefore, against “Shark Fin” ST segment deviations is the timing of where these dotted BLUE lines suggest the QRS ends.
- This timing is also against an ischemic-induced Brugada Phenocopy pattern in leads V1,V2 — because the dotted BLUE lines in ECG #2 suggest there is no ST elevation in leads V1,V2 (as would be needed for this ECG to represent a Brugada pattern).
- While a component of bundle branch block may be present in ECG #2 — the amorphous shape of the QRS in lead V1 is clearly atypical for RBBB (ie, it lacks any hint of triphasic morphology in V1 — as well as lacking a wide terminal S wave in lead I, and therefore looking much more like LBBB than RBBB in this limb lead).
- And, there is no reason to suggest sudden development of hyperkalemia as the cause of QRS widening in this post-resuscitation ECG.
- My Suspicion: This left me to postulate ischemic-induced QRS widening as a potentially plausible reason for why the QRS that was so narrow in ECG #1 — suddenly becomes so wide in association with the development of VFib. It would seem that the equally sudden return to the very narrow QRS complexes seen after resolution of ischemia in post-cath ECG #3 supports this theory.
- Clearly — it is much more common to see acute development of RBBB/LAHB (occasionally with a superimposed Brugada Phenocopy pattern) as the reason for sudden QRS widening that occurs in association with evolution of an acute OMI.
- That said, sudden development of a large anterior R wave (as seen in leads V1,V2 in ECG #2) has been seen with acute ischemia (Chugh et al — Cureus 9(4), 2017) — and non-bundle branch block-related QRS widening has at least been produced in the laboratory (Demidova et al — J Electrocard 49(3):300-306, 2016).
= = =
Learning Points:
- Regardless of what the “culprit” artery turns out to be — in a patient with new-onset severe CP (as occurred in today’s case) — the finding of hyperacute downsloping ST depression in multiple leads of the initial ECG (as was seen in ECG #1) — is indication for prompt cardiac catheterization to define the anatomy and to perform PCI.
- At the very least — Repeat the ECG within the next 10-15 minutes. Doing so in today’s case almost certainly would have demonstrated “dynamic” ST-T wave progression that would have prompted earlier cardiac cath (and which would probably have avoided the episode of VFib).
- Ischemic-induced QRS widening in an unusual pattern that is not the result of bundle branch block, Brugada Phenocopy or hyperkalemia (as seen in ECG #2) — may occur as part of the ongoing process of an acute evolving OMI. These QRST changes often quickly resolve following reperfusion (as was evidenced by deflation of the acute ST-T wave changes seen in ECG #1 — with return to the very narrow QRS with normal R wave progression soon after PCI, as shown in ECG #3).
= = =
= = =