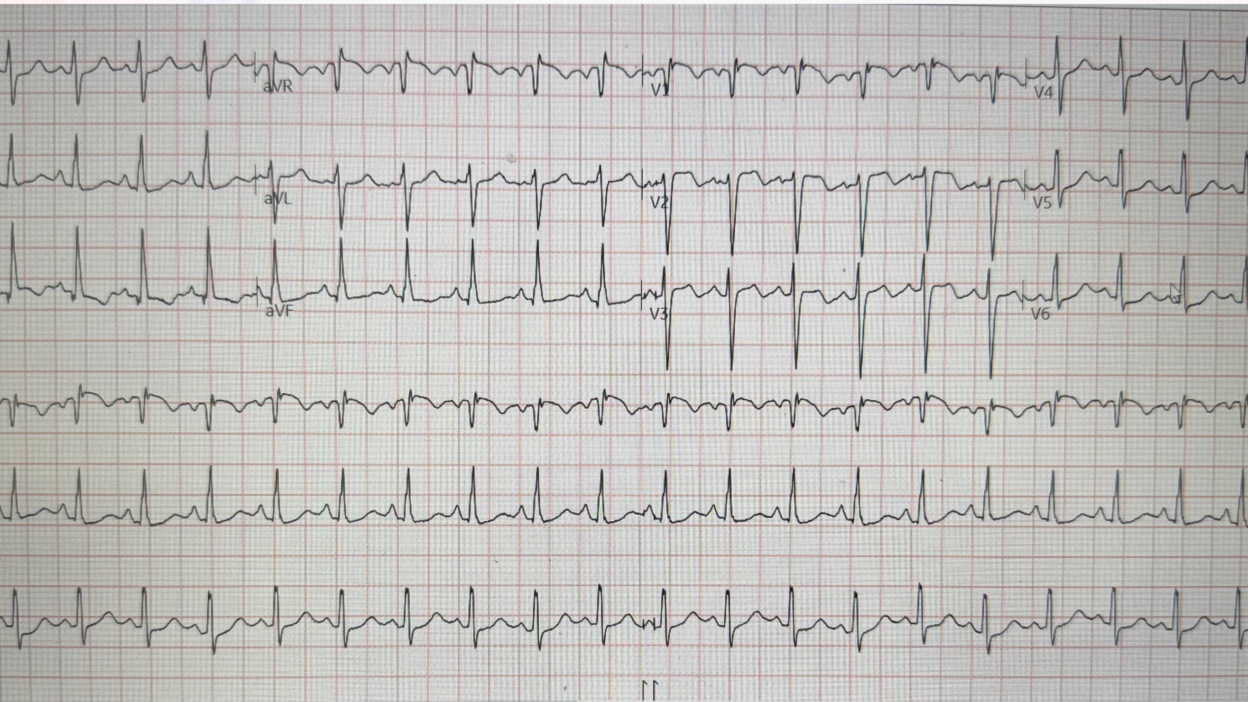
This was sent by a former resident, who is now a junior attending.
A patient presented in with clinical pneumonia and hypoxia, with hypotension.
A bedside echo was done immediately and the former resident immediately recognized a large right ventricle (RV). She noted that is was not only large, but thick-walled, and suspected right ventricular hypertrophy (RVH).
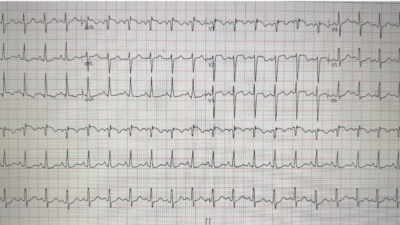
Then she recorded an ECG. Here it is:
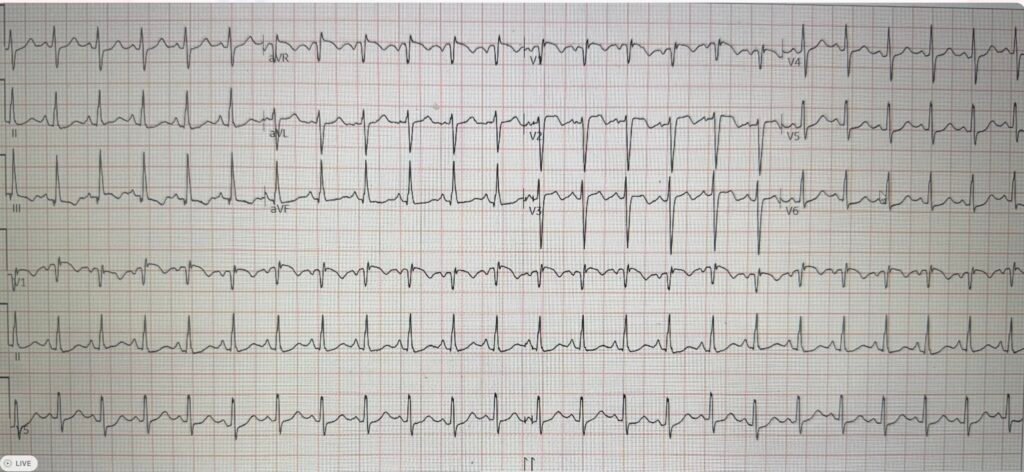
This has 1) tachycardia, 2) T-wave inversion in V1-V3 and lead III, and 3) S1Q3T3. So it should be considered to be acute right heart strain (ARHS) until proven otherwise. Also the morphology of the right precordial T-wave inversion suggests right heart strain rather than ACS.
See this post: Is this ECG easy for you yet?
This former resident recognized this pattern.
Remember that acute right heart strain is not only caused by pulmonary embolism, but also by any cause of acute increase in pulmonary vascular resistance, such as hypoxia.
The PMCardio AI ECG Model called haRVey gave an acute right heart strain score of 99.7 which is nearly perfectly specific.
However, as above, the former resident thought that the RV was hypertrophic on ultrasound, so she suspected chronic RVH in addition to possible acute right heart strain.
She obtained a CT pulmonary angiogram (CTPA), or as some people call it, a CTPE (which I find somewhat humorous!). It was negative.
She repeated the ECG:
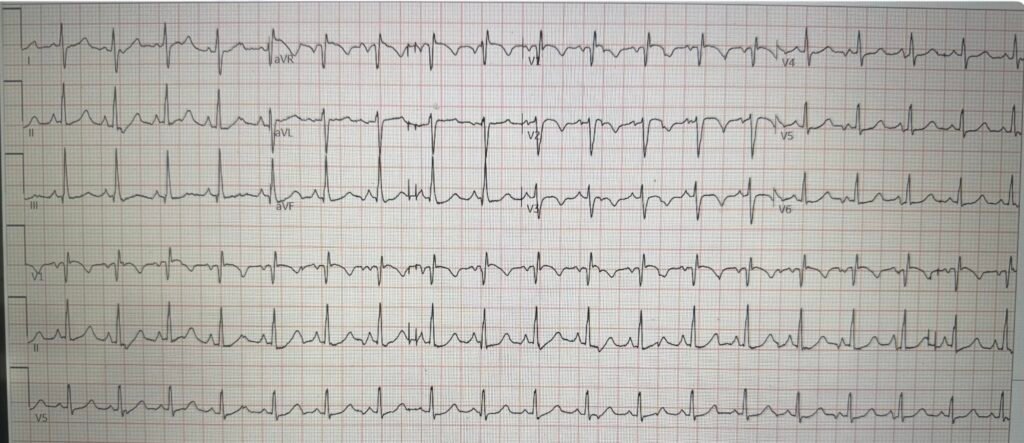
Do you see a difference?
On this one, the large R-wave in V1 is distinct. That is seen in RVH, and not in PE. I don’t know why it is different from the first ECG. In addition, there is no longer T-wave inversion in lead III.
This one is all but diagnostic of RVH.
See here for many ECG cases of right ventricular hypertrophy (RVH)
So this is exacerbation of right heart failure due to pneumonia and hypoxia.
The former resident wanted to treat the hypotension, but she knew that fluids can kill patients with RV failure (either acute or chronic). She started norepinephrine. She was admitting to the ICU and said “I called ICU and told them that I was worried about acute right heart strain and that giving the patient fluids could make the patient enter a ‘right sided death spiral.‘”
Nevertheless, the veteran ICU critical care physician told her to give fluids. She tried to object, saying fluids could kill a patient like this. The ICU doc insisted, and being “new on the block” (relatively recently graduated from residency), she complied.
After giving fluids, the patient became more hypotensive, quickly deteriorated, and died. Naturally she was very upset.
Can we prove that fluids killed this patient? No, but it might have.
I give a talk on acute RV failure in the ED, and here are some relevant slides for this case:
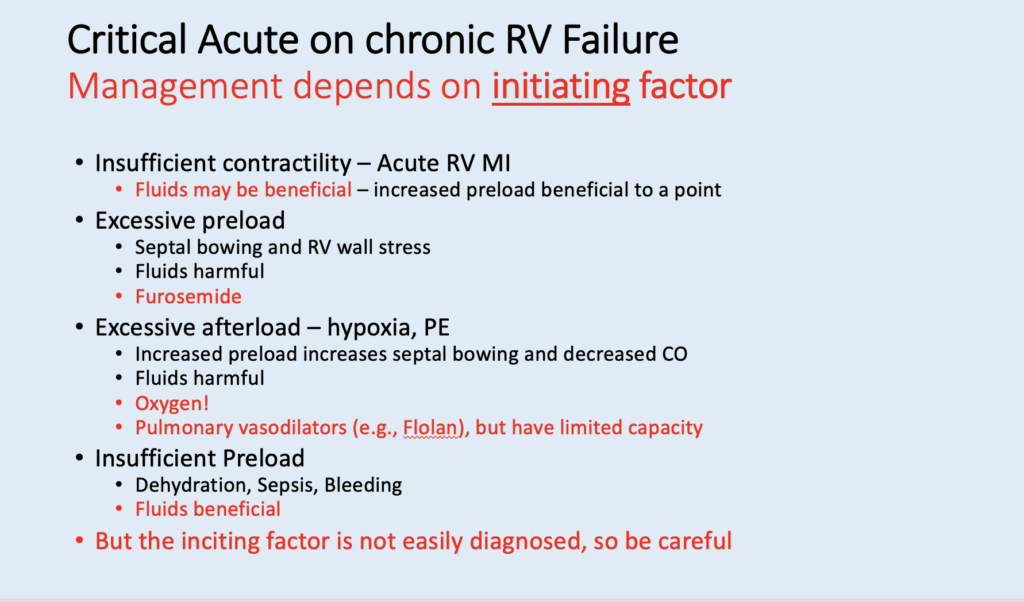
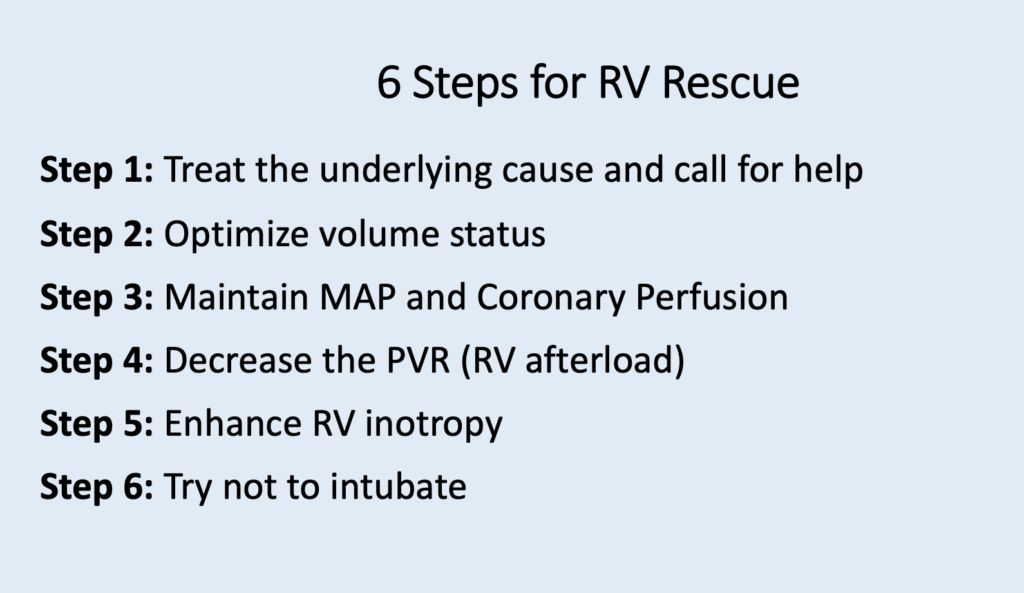
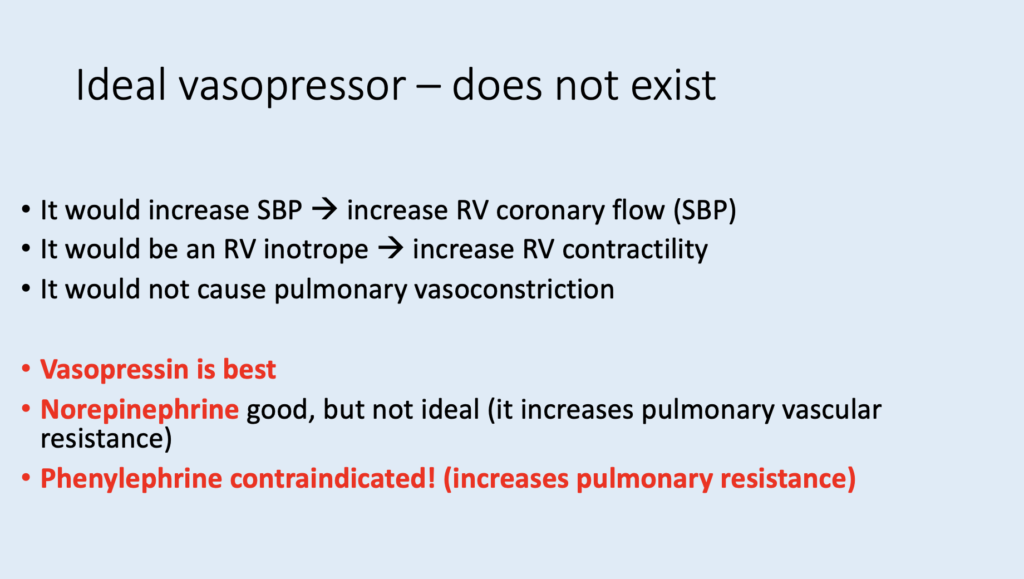
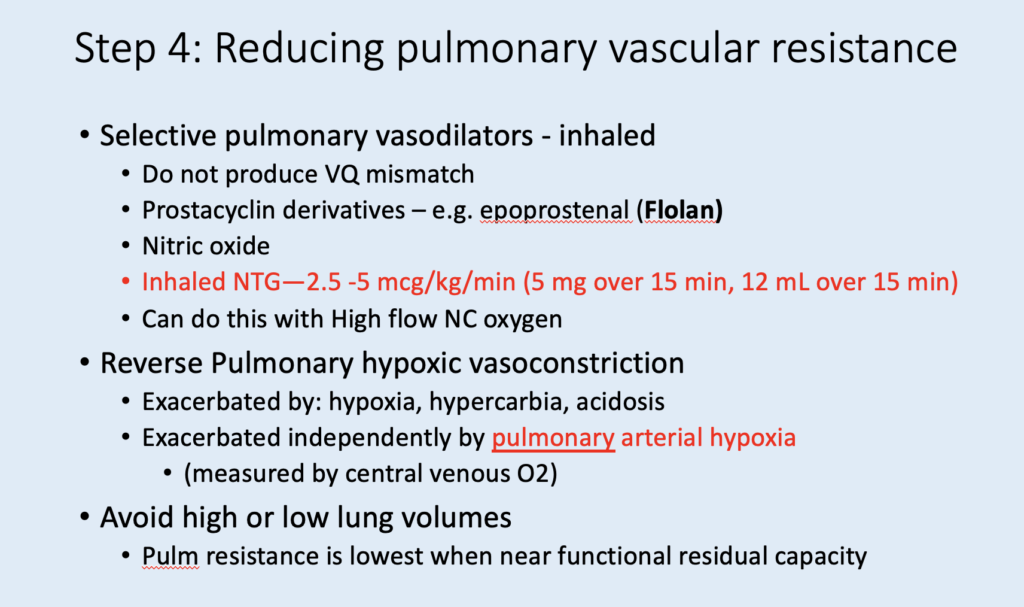
In this case:

In pneumonia initiates the vicious cycle:
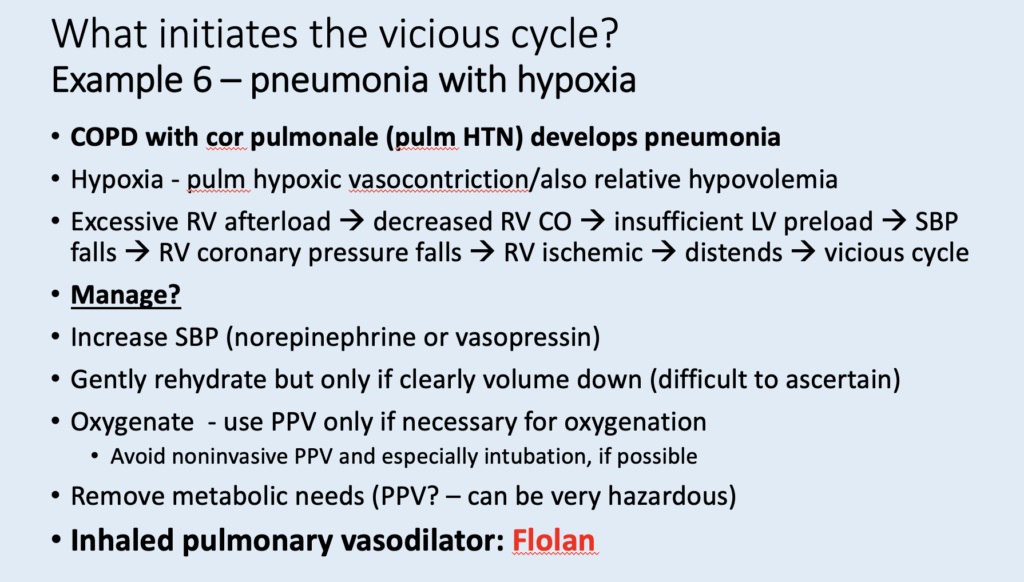
Don’t intubate unless absolutely necessary:
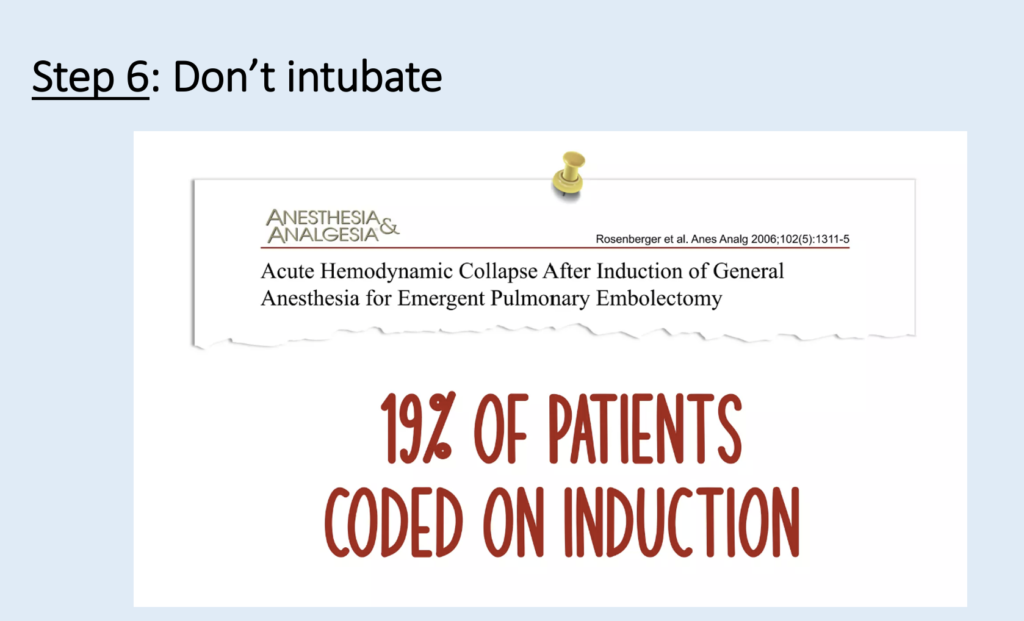
Intubate only if you absolutely must
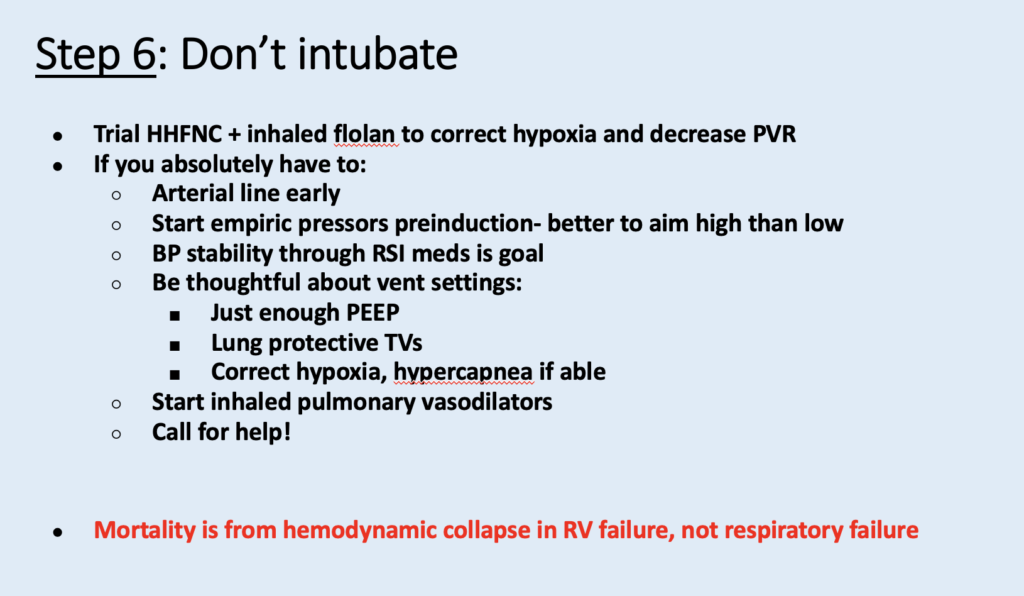
Learning points:
- Fluids can be very dangerous for patients in shock who have RV failure.
- A large R-wave in V1 is very specific for chronic RV hypertrophy (V1 is placed directly over the RV).
- RVH is missed on the ECG even by RV failure experts. See this post: COPD exacerbation, followed by cardiac arrest.
- RVH is rarely recognized on the ECG. The ECG is VERY useful for the differentiatial diagnosis of a large RV on bedside ultrasound, between PE and RVH, as PE shows only acute right heart strain, and RVH has a large R-wave in V1. (V1 is placed directly over the RV; it is only enlarged with chronic RVH, not with acute right heart strain).
- I once watched a lecture by one of the nation’s experts in RV Failure, Susan Wilcox. She presented a number of cases of RV Failure that went undiagnosed. In every case for which she showed the ECG (as I remember, it was 4 cases), the ECG showed RVH, but Dr. Wilcox had not been aware of it. I contacted her about this in order to call her attention to it, and she had indeed not been aware of it. She was very gracious and appreciative to learn about it.
= = =
==================================
MY Comment, by KEN GRAUER, MD (9/8/2026):
Today’s case by Dr. Smith is tragic in its conveyance of a painful lesson to learn, in which the patient died from ill-advised management of RV Failure. The Hows and Whys of treating this complex condition extend beyond the scope of this ECG Blog. For reference — I found the following sources thorough and insightful:
- Ventetuolo and Klinger — Ann Am Thorac Soc 11(5):811-822, 2014 —
- Levitt et al — J Clin Med 13:869, 2024 —
- Farkas — Internet Book of Critical Care (Updated on 8/30/2026).
- NIckson and Pearlman — Life In The Fast Lane (Updated on 3/22/2023).
In the interest of challenging reader astuteness in ECG interpretation — I focus my comment on a selected few beyond-the-core observations regarding the 2 ECGs in today’s case.
= = =
The 1st ECG that was done …
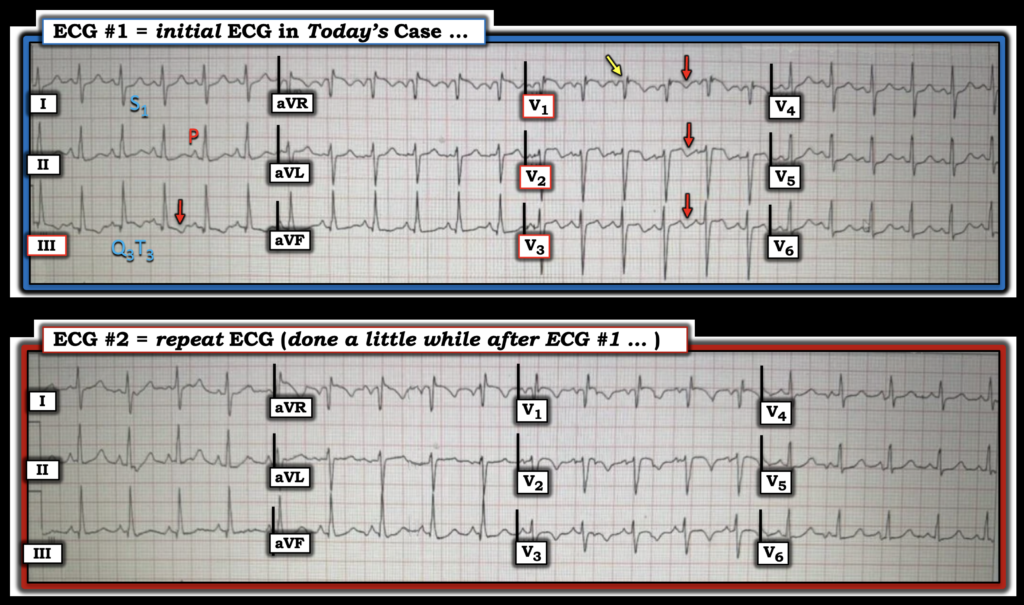
For clarity, and to facilitate comparison between todays’ 2 tracings — I’ve put them side-by-side in Figure-1.
- PEARL: As per Dr. Smith — awareness of the subtle change between these 2 ECGs is clinically relevant, because ECG #1 is more suggestive of the acute RV “strain” seen with acute PE — whereas ECG #2 looks more consistent with decompensated RVH. Isn’t it so much EASIER to assess subtle changes between 2 serial tracings when you put both ECGs together (as in Figure-1) — and then perform a systematic lead-by-lead comparison?
As per Dr. Smith — ECG #1 shows sinus tachycardia — T wave inversion in leads V1,V2,V3 and lead III (RED arrows in these leads) — with an S1Q3T3 pattern in leads I and III. Additional findings in ECG #1 include:
- Peaked and pointed P waves in inferior leads II and aVF. Although the 2.5 mm P wave amplitude criterion for RAA (Right Atrial Abnormality) is not satisfied — I’ve found this degree of distinct inferior lead P wave pointedness, even with lesser P wave amplitude — to be so commonly associated with acute pulmonary disease that I use it as a supportive finding.
- A Qr pattern in lead V1 (YELLOW arrow in this lead). Especially in a patient with pulmonary disease — a Qr (or qR) pattern in Lead V1 correlates well with pulmonary hypertension! (See Figure-2 in My Comment at the bottom of the page in the February 12, 2023 post for illustrated discussion of why this is so).
- ST coving and elevation in anterior leads V1,V2. In addition to acute RV infarction and LAD occlusion — anterior ST elevation (rather than anterior T wave inversion) can be seen as a sign of acute PE, especially in association with coving and ST elevation in leads III and aVR ( = the other right-sided leads). When seen, this finding tends to occur in patients with markedly compromised RV function (Zhan et al — Ann Noninvasive Electrocardiol 19(6):543-551, 2014 – and – Omar HR — Eur Heart J: Acute Cardiovasc Care 5(8):579-586, 2016).
- Although I don’t believe anterior ST elevation discriminates between acute PE vs RVH with acute RV failure — it’s good to be aware of the conditions in which this finding may be seen.
= = =
Figure-1: I’ve reproduced and labeled the 2 ECGs in today’s case.
= = =
The repeat ECG that was done …
As per Dr. Smith — among the subtle differences in appearance noted between ECG #1 and the repeat ECG #2 — are loss of the S1Q3T3 pattern (there no longer is T wave inversion in lead III) — and increased R wave amplitude in lead V1 (with this sudden new tall R wave in ECG #2 being much more suggestive of RVH). The question arises as to WHY this terminal tall R wave in lead V1 was not seen in ECG #1?
- Both ECG #1 and ECG #2 show a prominent initial Q wave in lead V1 — and ST coving with slight ST elevation in the anterior leads.
- Rather than a change in RV hemodynamics — I suspect the most plausible reasons for the increase in lead V1 R wave amplitude in ECG #2 are: i) The much faster heart rate in ECG #1 (~140/minute in ECG #1 — vs 115/minute in ECG #2) — as QRST appearance may occasionally be altered by tachycardia; — and, ii) A change in precordial lead electrode placement (Best appreciated in Figure-1 by comparing QRST appearance of lead V3 in both tracings — with more subtle change in S wave persistence in lateral chest leads V4,V5,V6).
- In support of an effect from altered precordial lead electrode placement — is the subtle finding of a negative notch after the tiny terminal r wave that was present in ECG #1.
= = =
= = =