This is a 3rd case written by Dr. Ahmed Marai, who just graduated from Medical School in Iraq.
A 65-year-old male presented to the ED at 5:50 am with breathlessness that had started 2 days earlier and worsened 1 hour before arrival. He had no chest pain or vomiting. His past medical history was significant for hypertension, ischemic heart disease, heart failure, and end-stage renal disease on hemodialysis 4 sessions per week. He had undergone CABG 1 year earlier.
In the ED, the patient was conscious and oriented but tachypneic. His blood pressure was 190/70 mmHg, pulse rate was approximately 130 bpm, and SpO₂ was 88%. Basal crepitations were heard on chest auscultation, and lower limb edema was present. Clearly the patient has pulmonary edema and associated hypoxia.
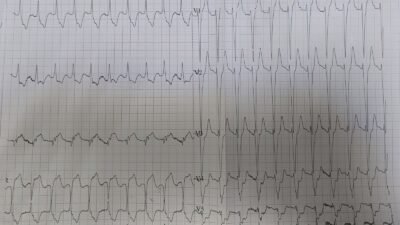
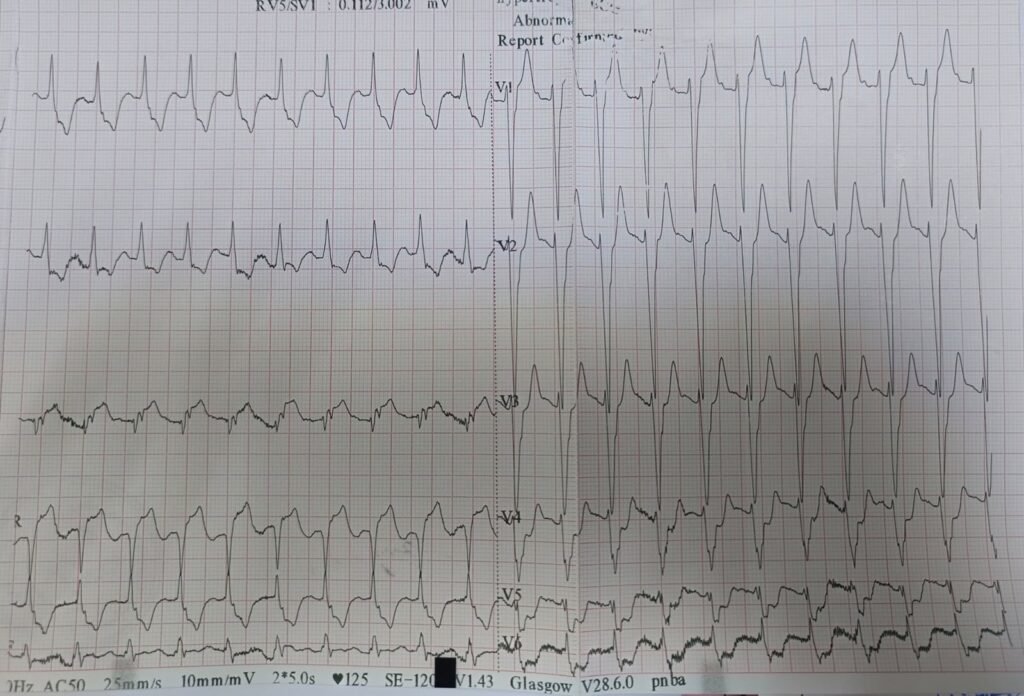
An ECG was recorded in the ED:
— What do you think? —
= = =
Smith: There is sinus tach with an wide QRS (133 ms), similar to LBBB but I would call it a nonspecific intraventricular conduction delay. There is STD in I, II, aVL, and then in V2 increasing all the way to V6. So there is an STD vector towards leads II and V5, with reciprocal STE in aVR. But there is ALSO STE in lead III.
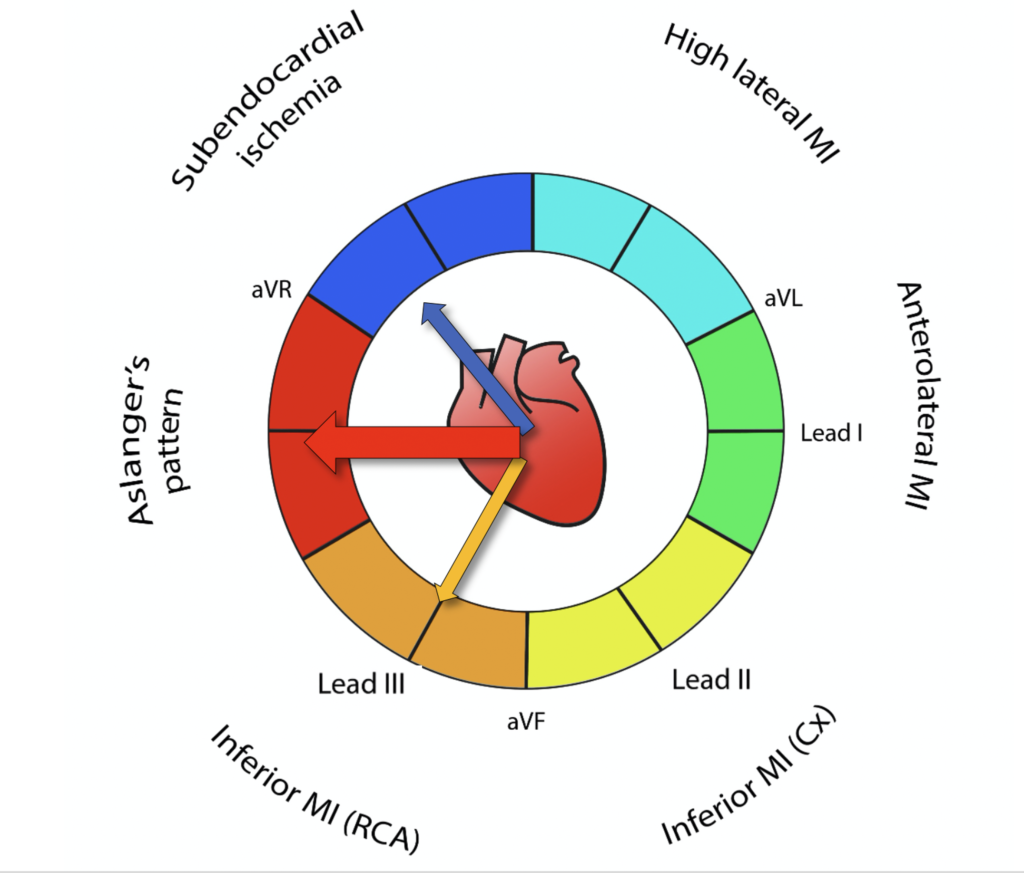
Thus, this is Aslanger’s pattern, in which there is BOTH 1) diffuse subendocardial ischemia resulting in an ST depression vector towards leads II and V5 (to the apex), AND 2) complete occlusion to the artery supplying the inferior wall with an ST Elevation vector towards lead III. The combination of these 2 vectors results in the cancellation of the STE of inferior MI in leads aVF and II, but not in lead III.
This results in an OMI pattern with STE in only one lead, and a very sick patient because of the addition of widespread ischemia, usually due to severe stenoses in other vessels, especially the LAD or left Main.
If there were ONLY subendocardial ischemia, one could blame it on hypoxia and tachycardia (supply demand mismatch). It would be quite possible or even likely that this patient with a history of renal failure and heart failure was simply having decompensated heart failure, possibly triggered by elevated blood pressure.
However, one must always keep in mind that acute pulmonary edema is often triggered by ACS, even when it appears to be triggered by something else such as hypertension. Even when the BP is very high, that can be a result of ischemia.
And, sure enough, in this case the STE in lead III tells you that there is also acute Occlusion (OMI).
This patient needs the cath lab emergently!
= = =
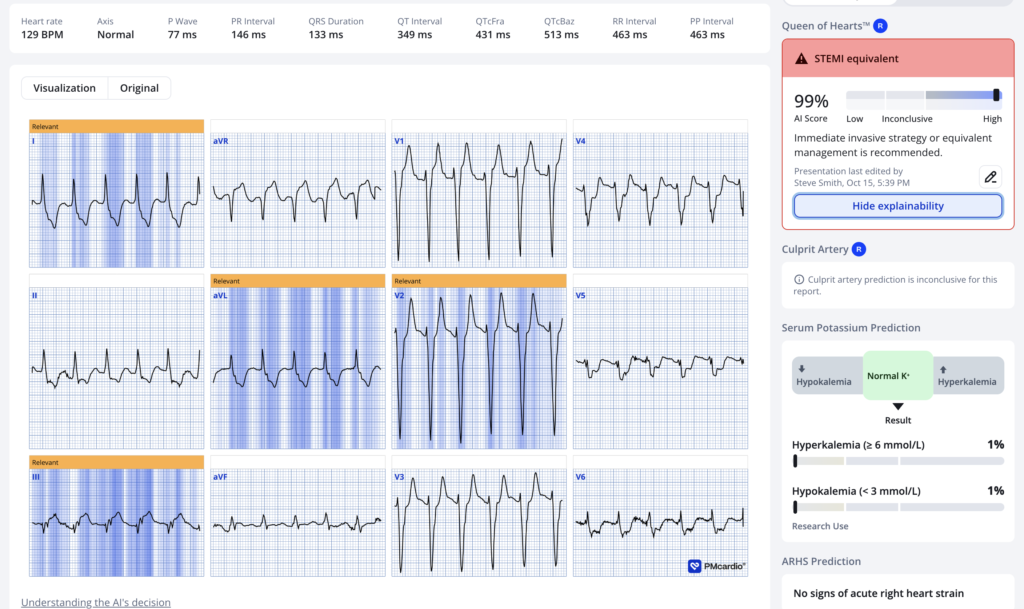
What does the PMcardio Queen of Hearts AI ECG Model think? (Now FDA approved)
= = =
Our experimental model Diagnoses subendocardial ischemia (SEI). Here is the result:
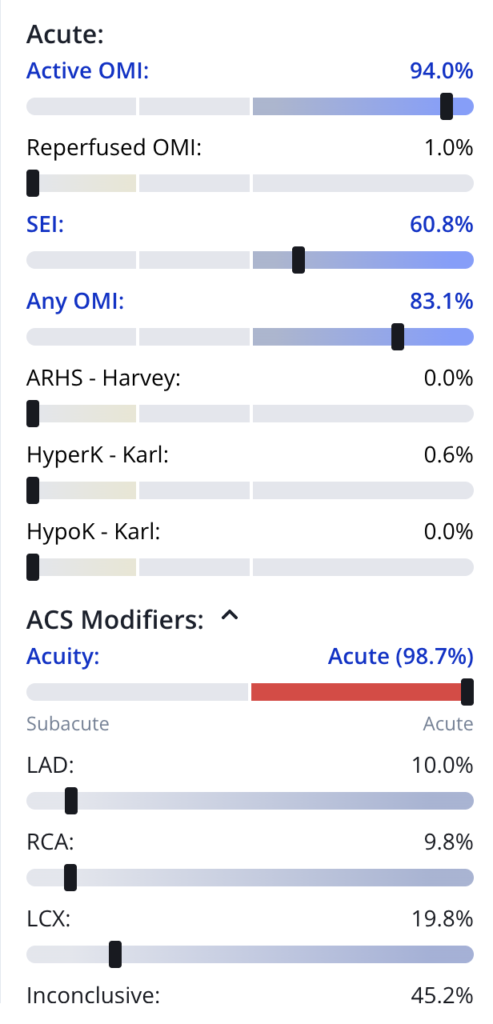
So she diagnoses BOTH SEI and OMI, exactly what Aslanger’s pattern means.
= = =
Case continued:
The ED physicians interpreted the ECG as sinus tachycardia with left bundle branch block (LBBB) and nonspecific ST-segment changes. This was the only ECG recorded.
The cath lab was not activated.
An oxygen mask was applied, and a Foley catheter was inserted. The patient received two ampoules of furosemide (20 mg each). 15 minutes later, he received two additional ampoules. However, there was still no urine output and no improvement in his symptoms. Lab results were availble by this time and significant for a Creatinine of 10 mg/dL and BUN of 123 mg/dL (renal failure).
After a while, the cardiac troponin I level returned at 0.334 ng/mL (laboratory reference range: 0–0.03 ng/mL). Based on this result, sublingual nitrates, aspirin, clopidogrel, and a heparin infusion were administered.
As there was still no urine output, 4 additional ampoules of furosemide were given, followed by another four ampoules 30 minutes later. Despite this, there was still no urine output.
The patient’s SpO₂ subsequently dropped to 70% despite the use of a non-rebreather oxygen mask, and he became disoriented. The internal medicine and anesthesiology teams were consulted. CPAP was recommended. After approximately 20 minutes on CPAP, there was no improvement in his symptoms or SpO₂.
In short, the patient deteriorated, needing intubation and arrested after intubation, and could not be resuscitated.
The final diagnosis by ED physcians was acute exacerbation of heart failure, with cardiac arrest occurring after intubation.
The OMI was never recognized, except by the recently graduated medical student.
Learning Points:
- Use the Queen of Hearts, as ECGs are simply too difficult for most humans
- Learn the OMI patterns, including Aslanger’s pattern.
- NSTEMI is a worthless diagnosis
- A provider’s level of training has little to do with their skill at reading OMI on the ECG. Some of the best interpreters are medics, EKG tech, and medical students. The skill requires active interest, lots of work, and some visual skills that may possibly are just inborn; it does not require completed training in any specialty.
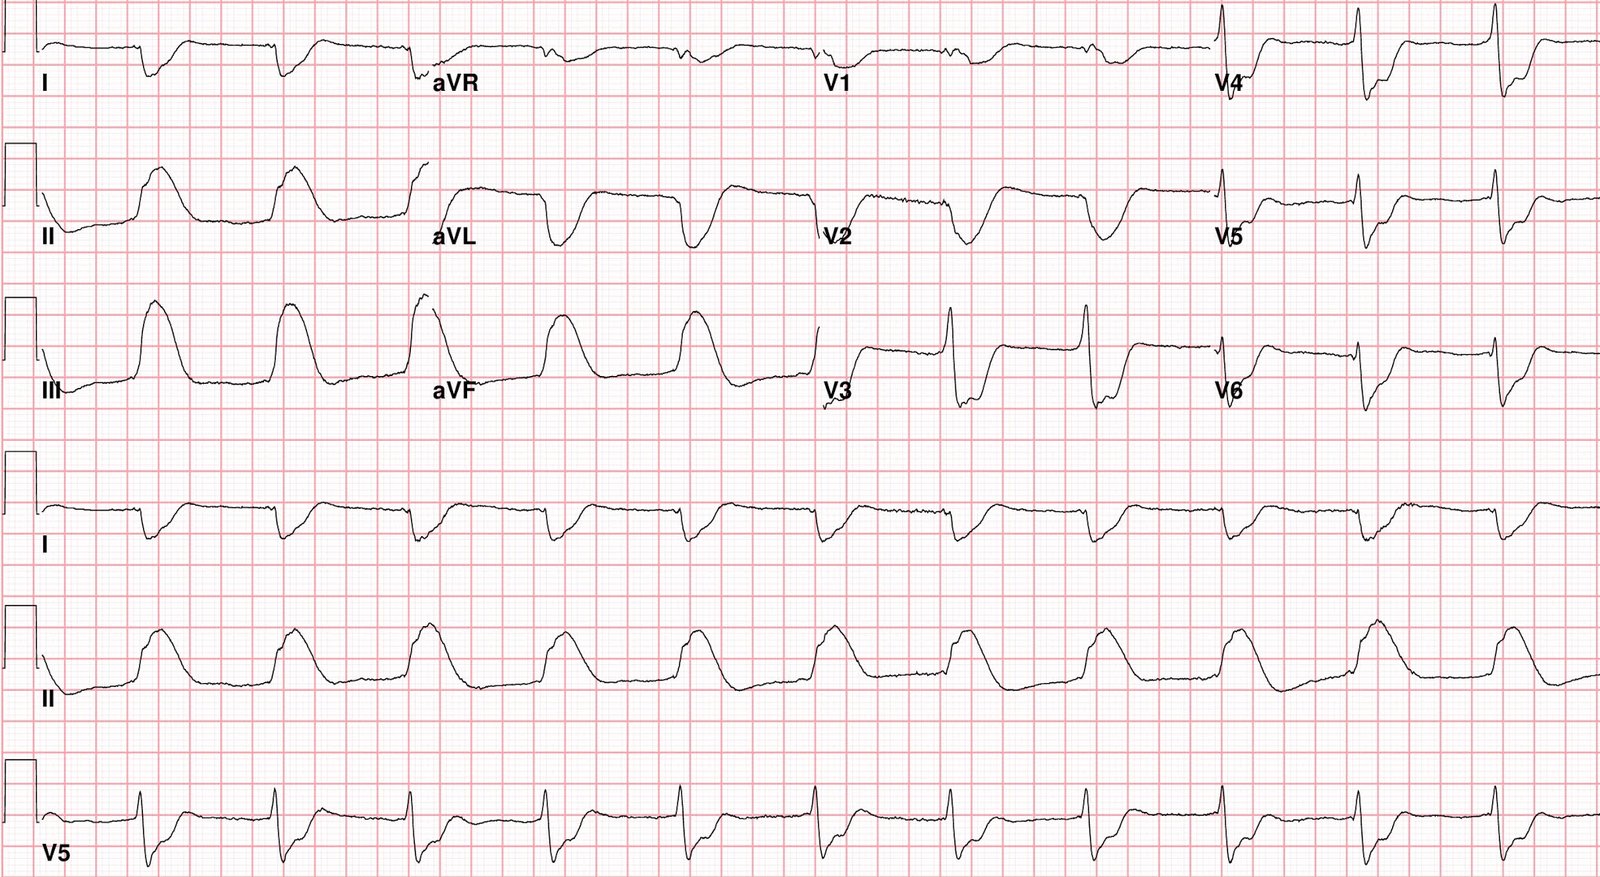
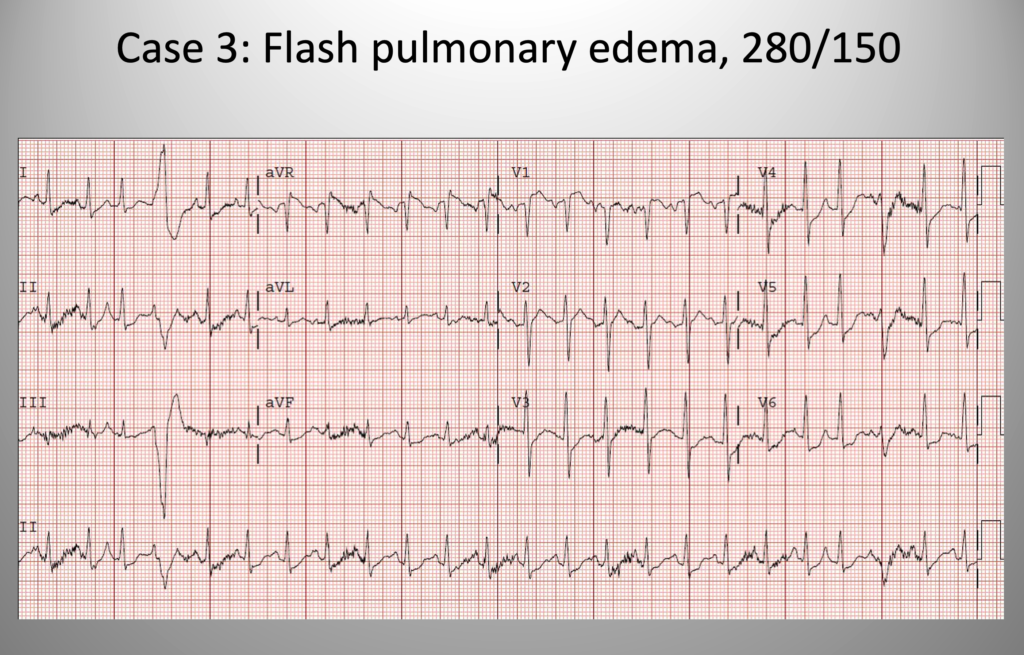
- Flash pulmonary edema with elevated BP may be initiated by a spike in blood pressure, or it may be initiated by ACS which results in high catecholamines, then high BP and a vicious cycle. Here is a case of acute pulmonary edema and very elevated BP:
= = =
The ECG shows sinus tach with widespread ST depression and ST elevation in aVR, diagnostic of subendocardial ischemia. Probably from supply demand mismatch from severe hypertension, right?
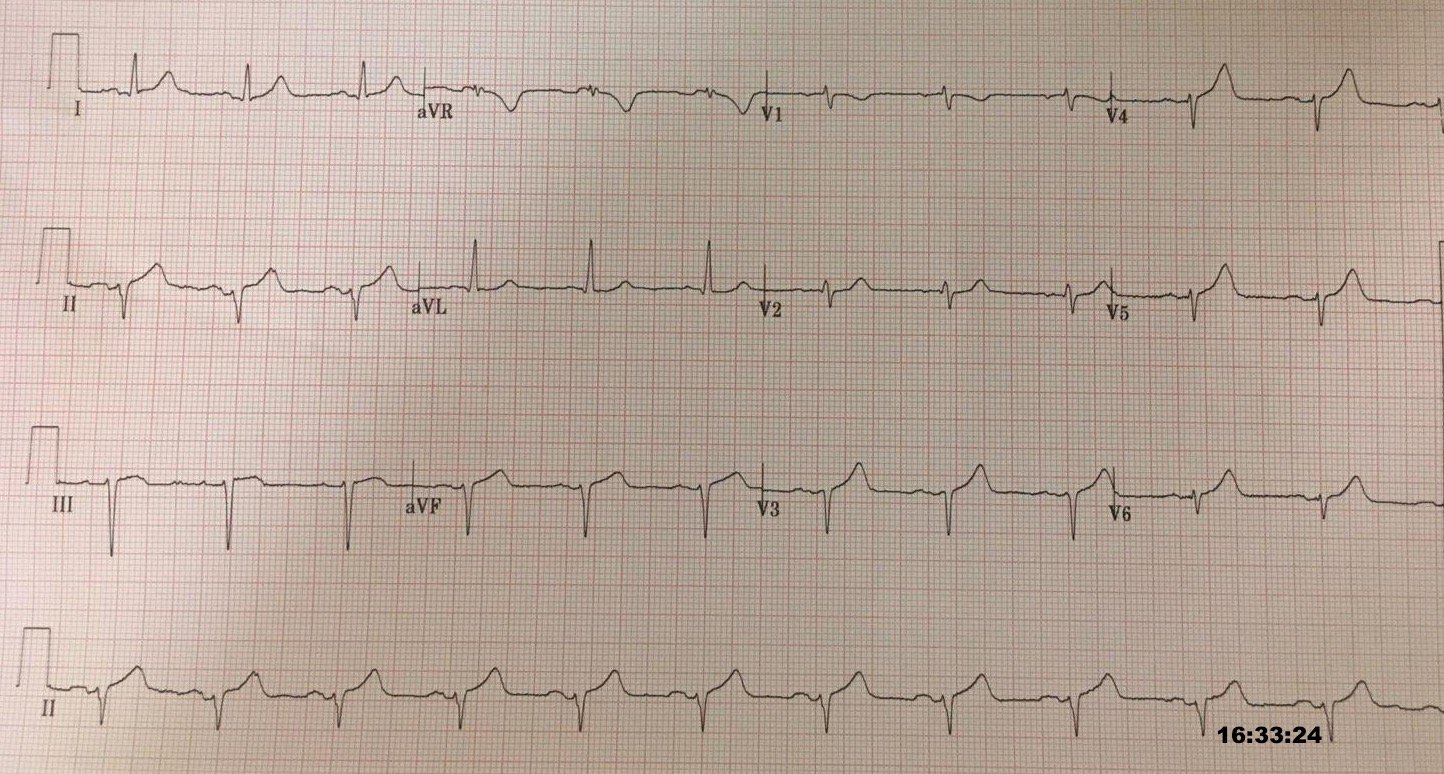
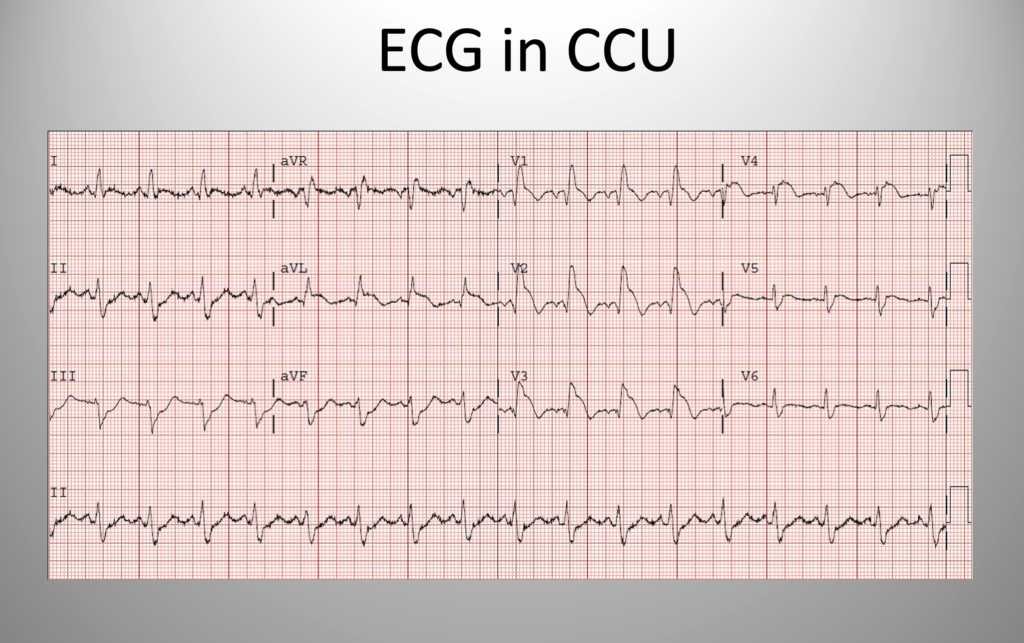
The patient was treated with BiPAP and high dose IV nitroglycerine and was MUCH better. Admitted to the ICU, where another ECG was recorded:
==================================
MY Comment, by KEN GRAUER, MD (10/18/2026):
Among the commonly misunderstood entities in clinical ECG interpretation of the emergency patient — is the concept of DSI (Diffuse Subendocardial Ischemia). As emphasized on many occasions in Dr. Smith’s ECG Blog (See My Comment in the December 30, 2025 post and the March 1, 2023 post, among many others) — DSI is an ECG pattern that should immediately prompt the following diagnostic considerations:
- Severe Coronary Disease (due to LMain, proximal LAD, and/or severe 2- or 3-vessel disease) — which in the right clinical context may indicate ACS (Acute Coronary Syndrome).
- Subendocardial Ischemia from another Cause (ie, sustained tachycardia — sinus tachycardia, or some other tachyarrhythmia; shock/profound hypotension; GI bleeding; anemia; electrolyte imbalance, etc.).
= = =
Why DSI is still Commonly Misunderstood …
DSI is diagnosed on ECG by the presence of ST depression in multiple leads — that occurs in association with ST elevation in lead aVR. Reasons this entity is still commonly misunderstood include:
- Many providers assume that seeing DSI on ECG automatically indicates severe coronary disease — thereby ignoring otherpotential causes of this entity (ie, sustained tachycardia — sinus tachycardia, or some other tachyarrhythmia; shock/profound hypotension; GI bleeding; anemia; electrolyte imbalance, etc.).
- Many providers also falsely assume that seeing DSI on ECG in a patient with CP (Chest Pain) or other acute symptom suggestive of ACS (Acute Coronary Syndrome) — automatically indicates infarction from coronary occlusion (ie, an OMI ). While possible that the cause of DSI is acute coronary occlusion — the ECG finding of diffuse ST depression (usually in 6 or more leads) in association with ST elevation in lead aVR often is not the result of acute coronary occlusion.
- Many providers remain unfamiliar with Aslanger’s Pattern — in which both DSI and an acute inferior OMI are present. As is shown in today’s case — DSI plus inferior OMI is diagnosed by the presence of diffuse ST depression with ST elevation in both lead aVR and in lead III, even when there is no ST elevation in the other 2 inferior leads.
- Many providers remain unfamiliar the other KEY diagnostic “asterisks” to DSI — which are: i) Distinction between DSI vs acute posterior OMI (in which the amount of ST depression is clearly maximal in leads V2 and/or V3 and/or V4); —ii) The presence of LVH may pose confusion trying to distinguish between DSI vs LV “strain” patterns; — iii) Forgetting to consider multi-vessel disease in patients with CP in whom ST depression is seen in more leads than you otherwise expect; — and, iv) In the midst of other potential reasons for ST-T wave abnormalities — Hyperkalemia can easily pass unnoticed …
- NOTE: Acute infarction is usually not associated with sinus tachycardia unless “something else” is also going on (ie, heart failure, shock, pulmonary disease, multi-system failure, etc.). If sinus tachycardia is present in your patient in whom you suspect ACS ==> We need to find out WHY …
= = =
Another Look at Today’s ECG …
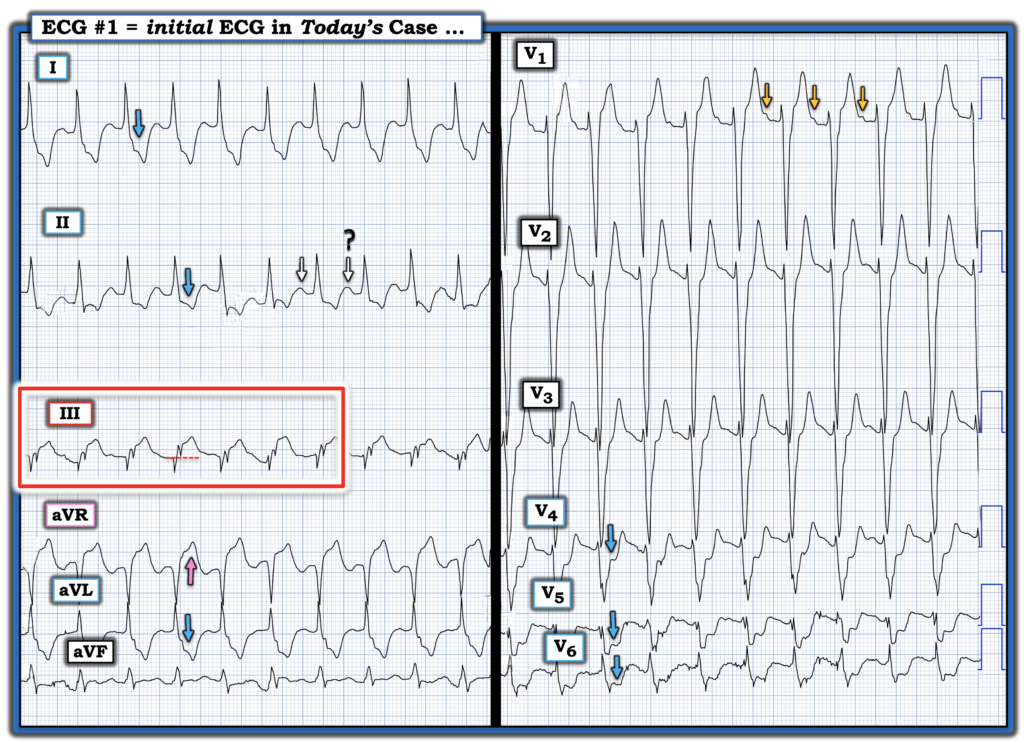
The patient in today’s case is a 65-year old man with known hypertension, coronary disease, heart failure and end-stage renal disease, who is on longterm dialysis. Increasing dyspnea (but not CP) was the chief complaint. I’ve reproduced this patient’s ECG in Figure-1. It’s worthwhile taking another LOOK at today’s tracing while contemplating the above considerations:
- The rhythm in Figure-1 is a regular SVT ( = the QRS is wide, but “looks” supraventricular). That this rhythm is sinus tachycardia is not initially obvious — because as per the WHITE arrows, it’s difficult (impossible) to determine from lead II if the rounded upright deflections seen after the ST depression in this lead represents upright T waves? — sinus P waves? — or both upright T waves with underlying sinus P waves that are hidden by the upright T waves?
- Fortunately — a distinct sinus P wave is seen in lead V1, which confirms sinus tachycardia. However, the rate of this sinus tachycardia is fast! ( ~125-130/minute) ==> We need to find out the cause of this fast sinus tach!
- There is obvious LVH (S waves of ≥25-30 mm in leads V1,V2,V3). Perhaps this LVH is the cause (or at least contributing) to the tall, upright T waves in the anterior leads (LV “strain”? ), as well as to the ST depression in lateral leads I,aVL; V4,V5,V6?
- But these tall, upright T waves in leads V1,V2,V3 have a pointed peak and a very narrow base in this longterm dialysis patient with no urine output and a Creatinine of 10 mg/dL ==> I suspect hyperK (and wonder about the need for emergency dialysis … ) .
- ST depression is extremely deep in 6 leads (BLUE arrows) — in association with equally marked ST elevation in lead aVR (PINK arrow in aVR) ==> criteria consistent with DSI (especially given the amount of ST segment deviation being more than expected from sinus tachycardia alone).
- Marked ST elevation is also seen in lead III — but not in the other 2 inferior leads (leads II and aVF both showing dramatic ST depression) ==> strongly suggesting Aslanger’s Pattern (as described above by Drs. Marai and Smith) ==> which strongly suggests that in addition to DSI and whatever else may be going on, that there is also acute inferior OMI.
= = =
Figure-1: I’ve labeled the initial ECG in today’s case. (To improve visualization — I’ve digitized the original ECG using PMcardio).
= = =
= = =