Case by Willy Frick
Details from this case are limited, so we will keep it short and sweet for the purposes of ECG learning.
Case Presentation
A 97 year old man had been feeling unwell for a few days. His son was concerned about his lethargy and called EMS. They obtained the following ECG en route and activated code STEMI prior to hospital arrival. Unfortunately no better quality tracing is available, but the diagnosis is beyond question.
ECG 1
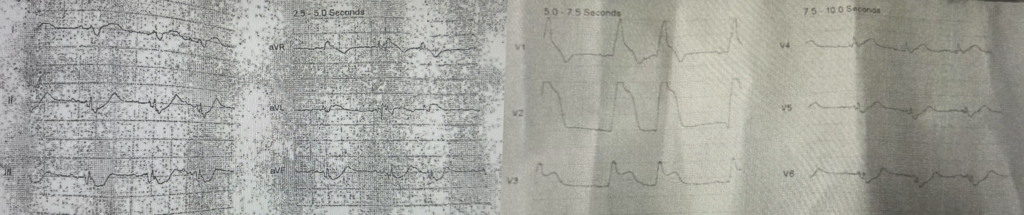
Obvious anterolateral STEMI (+) OMI
In the ER, he was intubated for airway protection and started on norepinephrine. Bedside echocardiogram showed “reduced ejection fraction.” He then developed a wide complex tachycardia (no ECG recorded), and was shocked with 200 J. Repeat ECG was obtained.
ECG 2
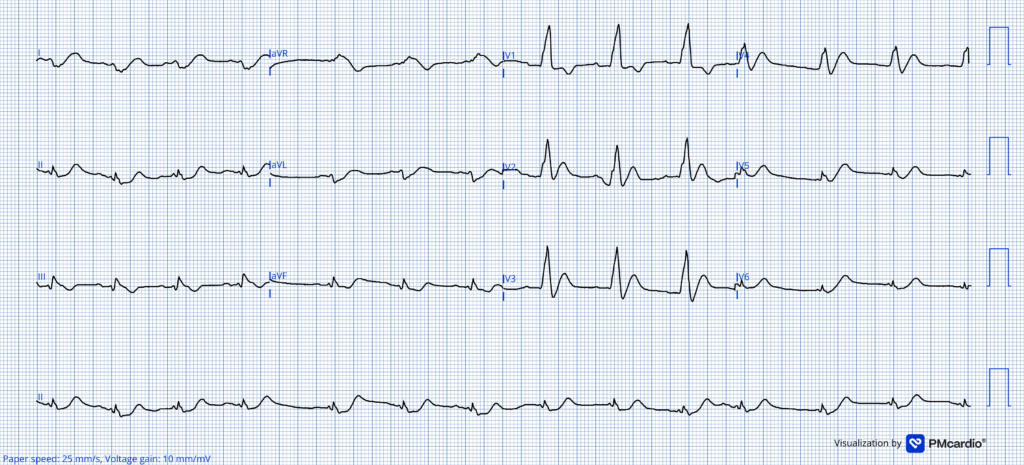
“EKG with diffuse ischemic change but no STEMI per cards. Heparin drip started because of concern for NSTEMI.” High sensitivity troponin I (hsTnI) trend: 66, then 100, then 10000.
Here are some excerpts from the cardiologist’s note:
- His initial EKG was abnormal. It was not consistent with STEMI.”
- “On examination blood pressure is 88/40 on Levophed; heart rate is 110.”
- “Assessment and plan: Patient presents to the ER with lethargy and hypotension requiring vasopressors. His troponin is markedly elevated. Echocardiogram reveals significant impairment of LV function. His previous echocardiogram in the office revealed much better LV function.”
The cardiologist titles the final paragraph as assessment and plan — but it is more accurately described as a perfunctory recitation of disconnected observations.
The next day, the cardiologist’s note is updated. “Status post myocardial infarction. Troponin elevated significantly. Echocardiogram reveals significant overall LV dysfunction. EKG is abnormal, consistent with anterolateral MI. Discussed the possibility of an angiogram with the family once the patient is more stable.”
Metaphors: Let’s put out the fire after it’s already burned the house down? Let’s close the barn door after the horse is gone? Let’s fix the artery after the myocardium is already dead? (This is what diagnosing MI with troponin does, by the way — Use the ECG to diagnose BEFORE troponin shows myocardium is dead!)
Repeat ECG shows nearly completed extensive anterolateral and inferior infarct (likely due to distal LAD supplying the inferior wall), and interestingly resolution of the RBBB.
ECG 3
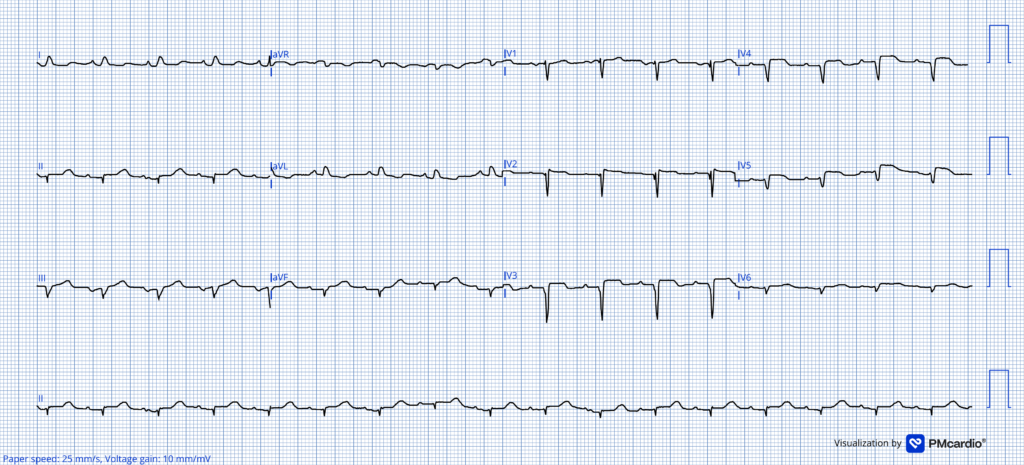
There is limited information about the hospital course, but the patient was eventually discharged alive without ever having received a coronary angiogram.
Discussion
Let’s set aside what we know about the superior performance of the OMI paradigm in classifying and triaging patients with acute MI. (DOI: 10.1016/j.jcin.2025.10.018, 10.3390/jcm13175201, 10.1186/s12872-026-05612-3, 10.1016/j.jemermed.2020.10.026).
Let’s set aside the fact that ECG 2 is still diagnostic for acute LAD occlusion to a skilled interpreter, or to anyone with access to the Queen of Hearts.
I shared this ECG with some friends with no context. Nanashī and Javier both immediately replied that the ECG was consistent with LAD OMI, showing de Winter T waves in the presence of right bundle branch block.
Here is the PMCardio Queen of Hearts AI ECG Model interpretation: she diagnoses OMI with output 1.0, maximal likelihood.
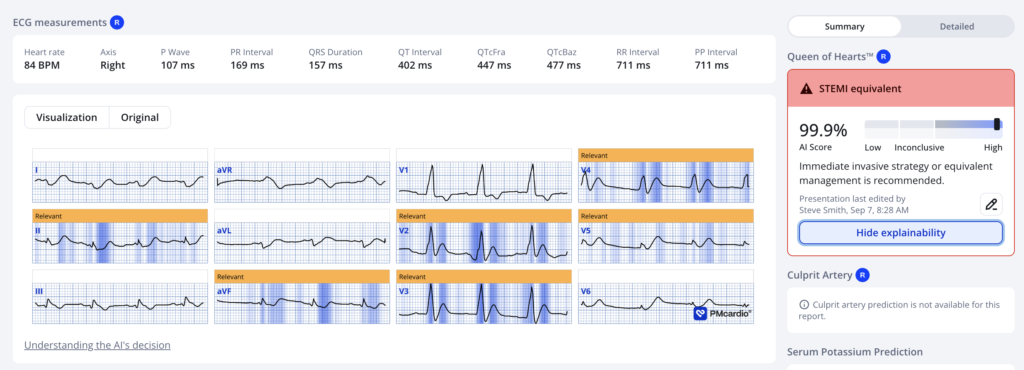
Let’s instead focus on what someone with no knowledge of OMI should be expected to do.
Here are the facts of the case as acknowledged by the cardiologist:
- Electrical instability (shocked for wide complex tachycardia)
- New onset left ventricular systolic dysfunction
- “Ischemic” ECG
- (Cardiogenic) shock
Does the STEMI paradigm take any of these things into consideration? Let’s review the 2025 ACS guidelines, section 6.1 “NSTE-ACS: Routine Invasive or Selective Invasive Initial Approach.”
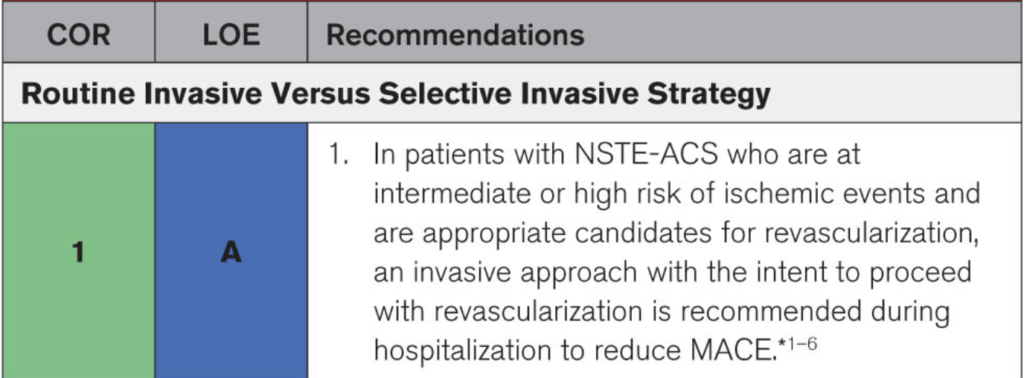
So our task is to decide if this 97 year old patient in cardiogenic shock after defibrillation for sustained wide complex tachycardia is “intermediate or high risk of ischemic events.” In fact, it is actually hard to think of almost anything that would make this patient higher risk. He is at extreme risk!
Reference number 4 in the guideline statement describes the GRACE score and characterizes a score greater than 140 as favoring earlier invasive treatment. What is this patient’s GRACE score? Using the vital signs from the cardiologist’s note:
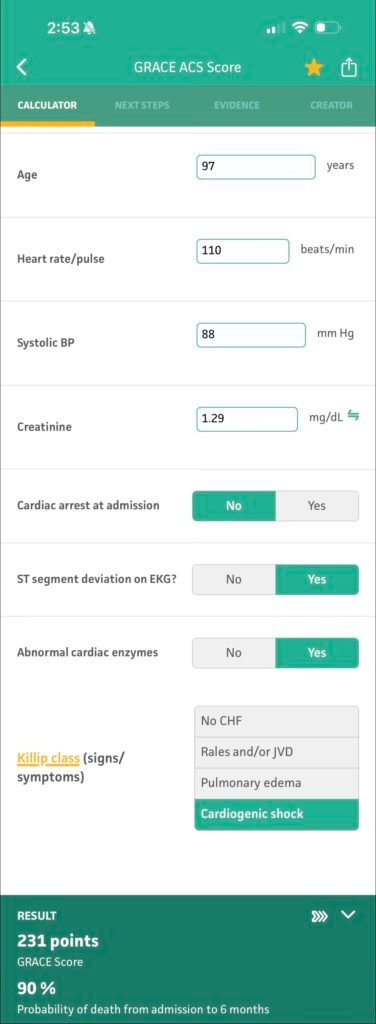
The 90% probability of death in the next 6 months is likely an underestimate, since the systolic blood pressure of 88 reflects norepinephrine.
With this, we have established that the guidelines recommend invasive management for this patient. Are there any other recommendations on timing?
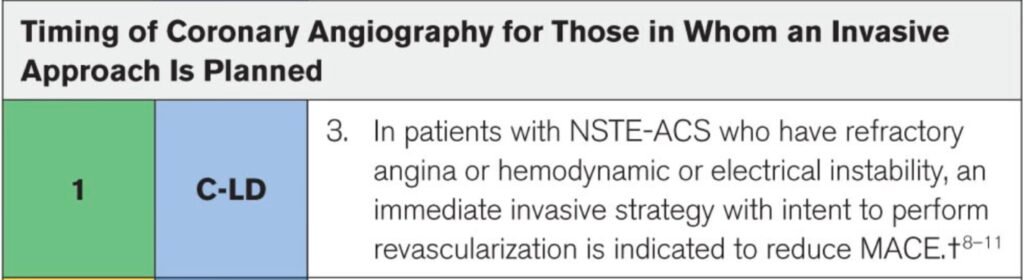
Immediate invasive strategy is recommended for patients with refractory angina, hemodynamic instability, or electrical instability. Immediate means within 2 hours, not to be confused with early invasive which is generally within 24 hours. If we could extubate the patient following the sedation we gave him to shock his wide complex tachycardia, then maybe we could ask about angina to see whether he satisfies all three criteria.
A 97-year-old patient with a OMI, cardiogenic shock, and electrical instability has a poor prognosis regardless of the intervention. If the treating clinicians had decided against catheterization based on frailty or overall goals of care, that could be defended. But that is not what happened here. The chart shows they explicitly wanted to cath him, but decided to wait for some imaginary “clinical stability” first. The terrifying reality of the STEMI paradigm is that this exact same logic is routinely applied to 57-year-olds.
Conclusion
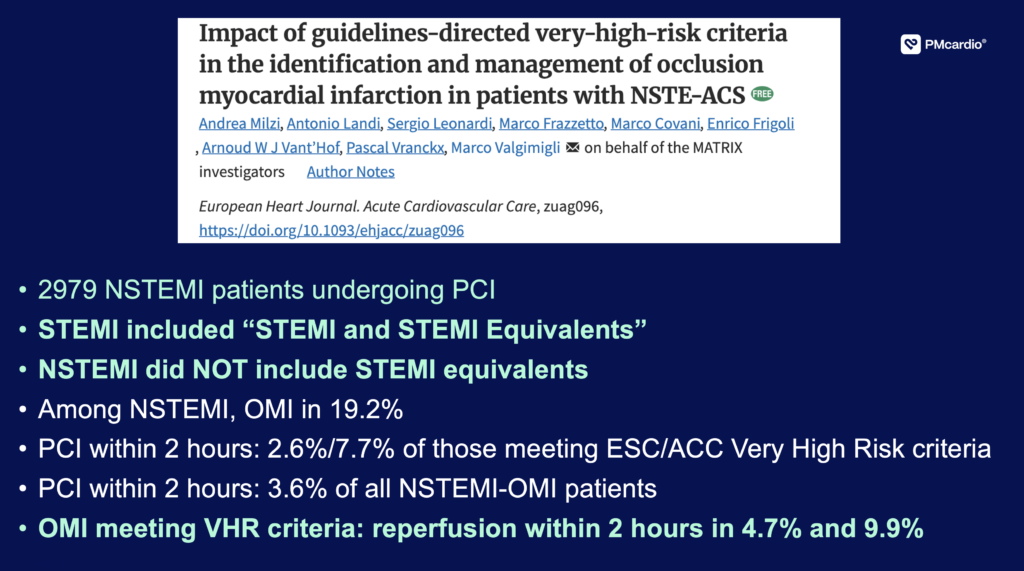
This case is highly representative of ACS care. Even though the guidelines recommend immediate invasive management for this patient clear as day, in the real world this only happens on rare occasion for patients without (persistent) STEMI, 6.4% of the time.
Smith: Beyond Lupu et al. we now we have much more evidence that the Non-STEMI Guidelines are awful and are not followed. They are a terrible subsitute for the OMI paradigm.
See this article: Milzi A, Landi A, Leonardi S, et al. Impact of guidelines-directed very-high-risk criteria in the identification and management of occlusion myocardial infarction in patients with NSTE-ACS. Eur Heart J Acute Cardiovasc Care [Internet] 2026;(zuag096). Available from: http://dx.doi.org/10.1093/ehjacc/zuag096/8764093
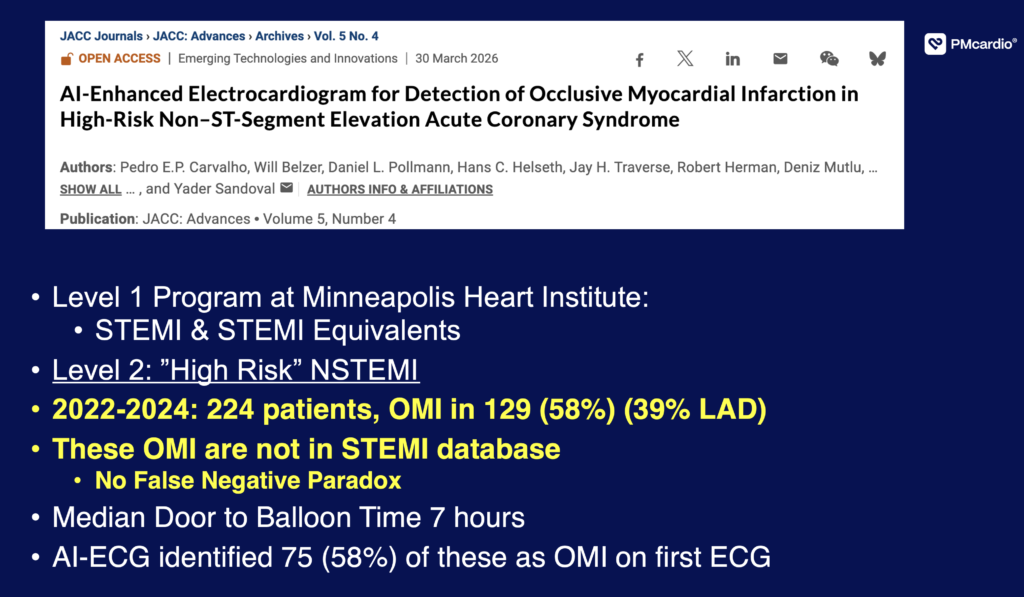
Carvalho et al. published this one: Carvalho PEP, Belzer W, Pollmann DL, et al. AI-enhanced electrocardiogram for detection of occlusive myocardial infarction in high-risk non-ST-segment elevation acute coronary syndrome. JACC Adv [Internet] 2026;5(4):102663. Available from: http://dx.doi.org/10.1016/j.jacadv.2026.102663
2 more articles we will discuss after publication. They both show how terrible the NSTEMI guidelines are and how important it is to change to OMI/NOMI.
DIFOCCULT-3 is In Press. A randomized trial that shows that NSTEMI-OMI is diagnosed within 2 hours twice as often in OMI/NOMI paradigm, using the Queen, as in NSTEMI guidelines. Aslanger EK, Aggül B, Yıldırımtürk Ö, Karabay CY, Meyers HP, Smith SW, Değertekin M; DIFOCCULT-3 Study Investigators. Occlusion-Focused Triage Versus Very-High-Risk NSTEMI Criteria: A DIFOCCULT-3 Substudy. JACC Cardiovasc Interv. 2026 (In press)
This article is also in Press. Acute coronary occlusions in NSTEMI undergoing PCI: Insights from the CathPCI registry. JACC Cardiovasc Interventions. In Press. A huge database that shows that in a system that activates both STEMI and NSTEMI, NSTEMI-OMI is 24% of NSTEMI, and has a 2.8 odds ratio of cardiovascular death compared to NSTEMI-NOMI.
Instead this patient had supervised, in-house anterolateral infarction. Clearly the treating clinicians thought catheterization was clinically appropriate, as they discussed doing this when the patient was clinically stable. This is like a fire department getting called about a burning building and waiting a few days before dumping a bucket of water on the smoldering ashes that remain.
“We can’t put the fire out until the house is stable and not burning any more.”
Learning Points
- Nothing stabilizes acute coronary occlusion quite like opening up the artery. Waiting for stability before intervening serves no one.
- Academics love to defend the STEMI paradigm by citing guideline carve-outs for unstable patients, but in practice, the “NSTEMI” label blinds clinicians so thoroughly that the safety net never actually deploys.
= = =
==================================
MY Comment, by KEN GRAUER, MD (9/7/2026):
Today’s case is disturbing for multiple reasons, as lamented by Dr. Frick. That said — I limit My Comment here to review of selected points regarding the first 2 ECGs in this case.
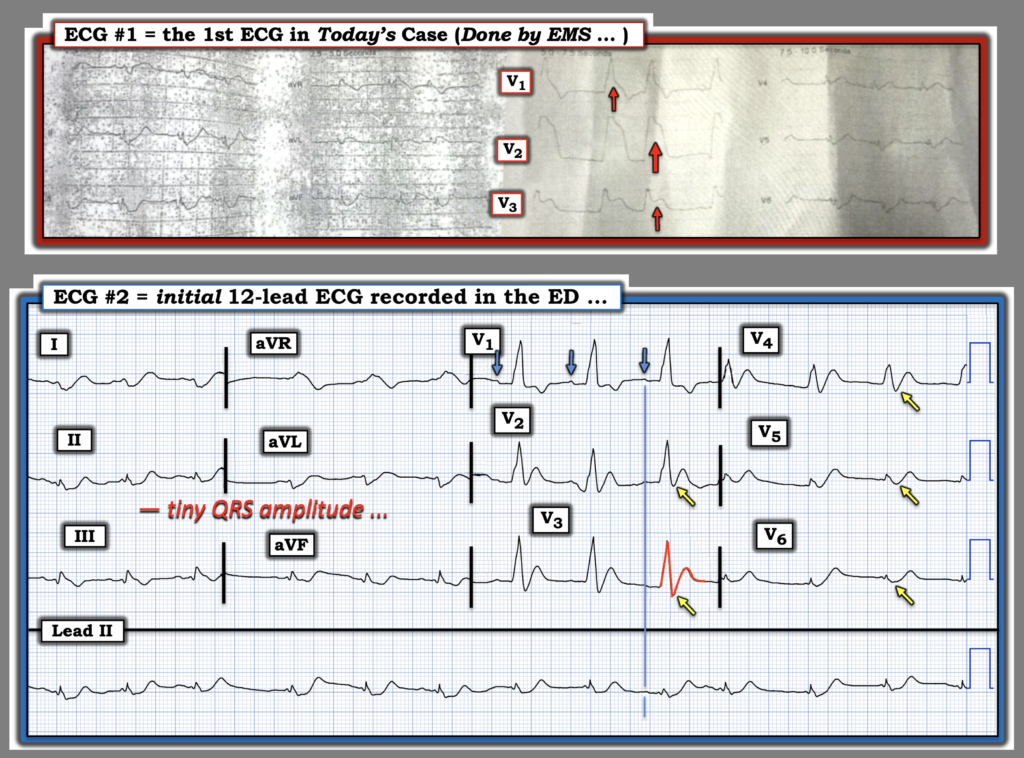
- For clarity and ease of comparison in Figure-1 — I’ve put these 2 tracings together.
= = =
The 1st ECG in Today’s CASE . . .
EMS was called to the home of today’s 97-year old patient — who the son reported, had been lethargic for the past several days. The patient’s concerning condition prompted EMS to immediately transport the patient to the hospital. En route — ECG #1 was recorded.
- As acknowledged by Dr. Frick — the poor technical quality of ECG #1 made this tracing extremely difficult to interpret. That said — there appears to be RBBB (predominant tall R wave in lead V1) — and there can be no doubt about the very marked ST elevation in leads V1,V2,V3 (as highlighted by the RED arrows in these leads).
- As a result, before discussing ECG #2 — I have to wonder about the description in the ED note by the treating cardiologist, which said: “Abnormal ECG” but “not consistent with STEMI”. Presumably, as sometimes happens — the cardiologist had not yet seen the EMS ECG. But the diagnosis of “STEMI” was apparently not declared in this patient’s chart.
- Realizing that we have limited information about today’s case, I still find it hard in 2026 to understand how the obviously abnormal findings in ECG #1 somehow never got integrated into Cardiology’s assessment and plan for this patient — when this initial EMS tracing (albeit of very poor technical quality) clearly showed marked ST elevation in leads V1,V2,V3 (with more than 10 mm of ST elevation in lead V2!).
= = =
Figure-1: The ECG recorded on patient arrival in the ED. (To improve visualization — I’ve digitized the original ECG using PMcardio).
= = =
My Thoughts on ECG #2 …
The above said, even if we discount the nonuse of ECG #1 — I find it hard to accept the Cardiology opinion that despite development of a wide tachycardia requiring electrical cardioversion shortly after arrival in the ED, with subsequent hypotension requiring vasopressors in association with the bedside Echo finding of new depressed LV function + elevated Troponin and the initial 12-lead ECG that was recorded in the ED (= ECG #2) — the Cardiology opinion in the chart of this case read, “concern for NSTEMI”.
- ECG #2 is not an easy tracing to interpret. Perhaps the main reason for this — is the extreme low voltage present in no less than 8 of the 12 leads. As emphasized often in Dr. Smith’s ECG Blog — highest concern for such diffuse low voltage in a patient like this one, should be as the sequelae of a large acute infarction, now with cardiac “stunning” potentially evolving to cardiogenic shock (See this reminder of the Causes of Low Voltage — that is readily available from the MENU at the TOP of every page in this Blog).
- The rhythm in ECG #2 — is not easy to assess because of: i) The very low voltage; — ii) The irregularity of the rhythm in the long lead II rhythm strip at the bottom of the 12-lead; — and, iii) The tiny size of P waves that are not readily apparent in the long lead II. We do see sinus P waves in lead V1 ( = the 3 BLUE arrows in that lead) — but as per my vertical BLUE time line — even knowing where sinus P waves should be in the long lead II, we have trouble seeing them. Based on those BLUE arrows in lead V1 — I interpreted the rhythm as sinus arrhythmia with PACs.
- We again see RBBB — in the form of the amorphous but all upright R wave in lead V1 with suggestion of terminal wide S waves in the tiny QRS complexes seen in leads I and V6.
- There may be LPHB (Left Posterior HemiBlock) — as suggested by what looks like an rS complex in lead I and a qR complex in lead III (albeit the tiny voltage makes it hard to be certain of this).
- Of most concern — is what appears to be the pattern of deWinter T waves beginning in lead V2. Although assessment is again rendered more difficult because of the tiny QRS amplitude — it is hard to negate the J-point ST depression that begins in lead V2 (YELLOW arrows in leads V2-thru-V6) — and which then steeply rises to disproportionately large, upright T waves in all chest leads after lead V1 (BEST seen in lead V3 — as suggested by the RED outline of the QRST in this lead).
- Given the clinical presentation of this patient — I find it hard accept any interpretation by Cardiology other than acute LAD occlusion in need of prompt cath for PCI.
= = =
= = =