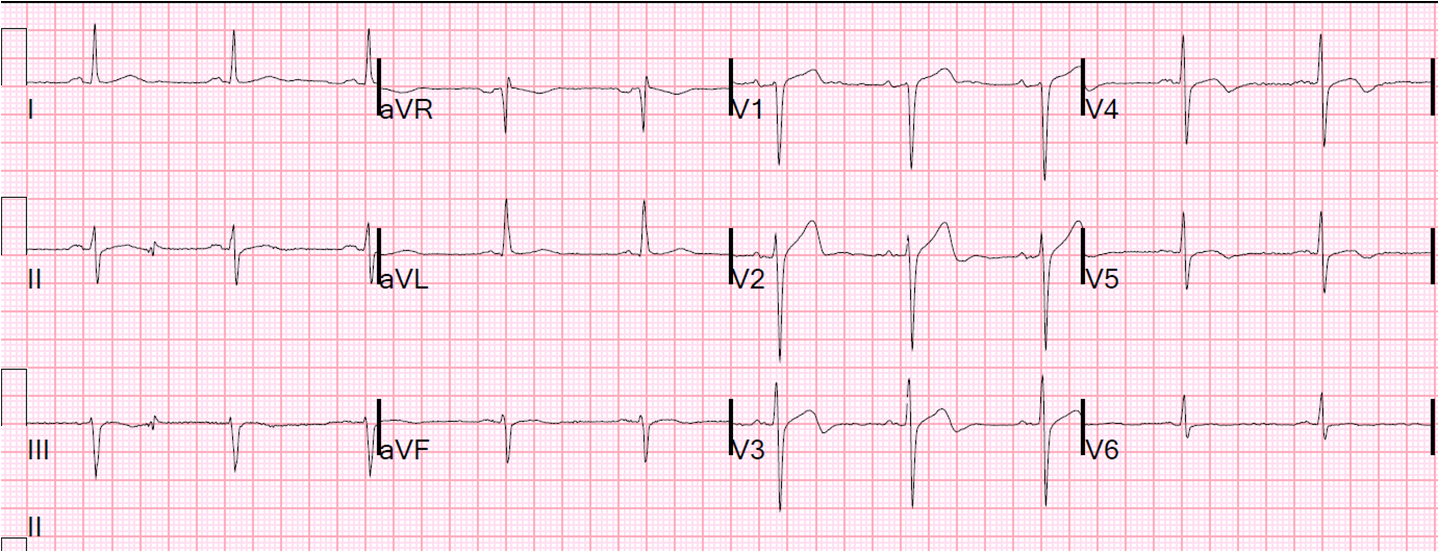
I was reading a stack of ECGs yesterday, and saw this one, with no clinical information:
 |
| What do you think? (computerized QTc is 429 ms)
See followup below. |
My thought was: “This is an acute LAD occlusion, and I am afraid it would have been missed.”
Why did I think that this apparently benign looking ECG represents LAD occlusion? It is an ECG that does not meet any millimeter “criteria” for STEMI.
I am sorry if I repeat myself too often, but there are many LAD occlusions which are missed at initial presentation because it is thought to be normal variant ST elevation. That is why I studied it and produced the formula for differentiating benign from ischemic ST elevation in “anterior” leads. Many are not diagnosed until the patient “rules in” by biomarkers, goes to cath later, and has the artery opened only after the damage is done. And these get a final diagnosis of “NonSTEMI” because they do not meet “criteria” for STEMI and yet they are due to complete occlusion of the artery. You don’t get a message from anyone that you “missed a STEMI.” And yet the patient lost a lot of myocardium unnecessarily.
See these references:
Wang T et al. Am Heart J
2009;157(4):716-23.
From AM, et al. Am J Cardiol 2010;106(8):1081-5.
Pride YB et al.
JACC: Cardiovasc Interventions 2010;
3(8):806-11.
Almost all of these occlusions can be diagnosed, but only with a high suspicion and with careful investigation, serial ECGs, and high quality echocardiography.
On this ECG there is ST elevation in lead V2, and it must be explained. Is it benign? If it were benign, then there should be excellent R-wave progression. There is not. In fact, the R-wave gets smaller from V2 to V3. Furthermore, the T-waves are much more symmetric than the T-waves of early repolarization. If you plug these numbers into the excel applet on the sidebar:
–ST elevation at 60 ms after the J-point in lead V3
–computerized QTc
–R-wave amplitude in V4
The resulting value is 25.0. Any value greater than 23.4 is LAD occlusion until proven otherwise. Less than 4% of LAD occlusion have a value < 22.0.
So I went to the chart:
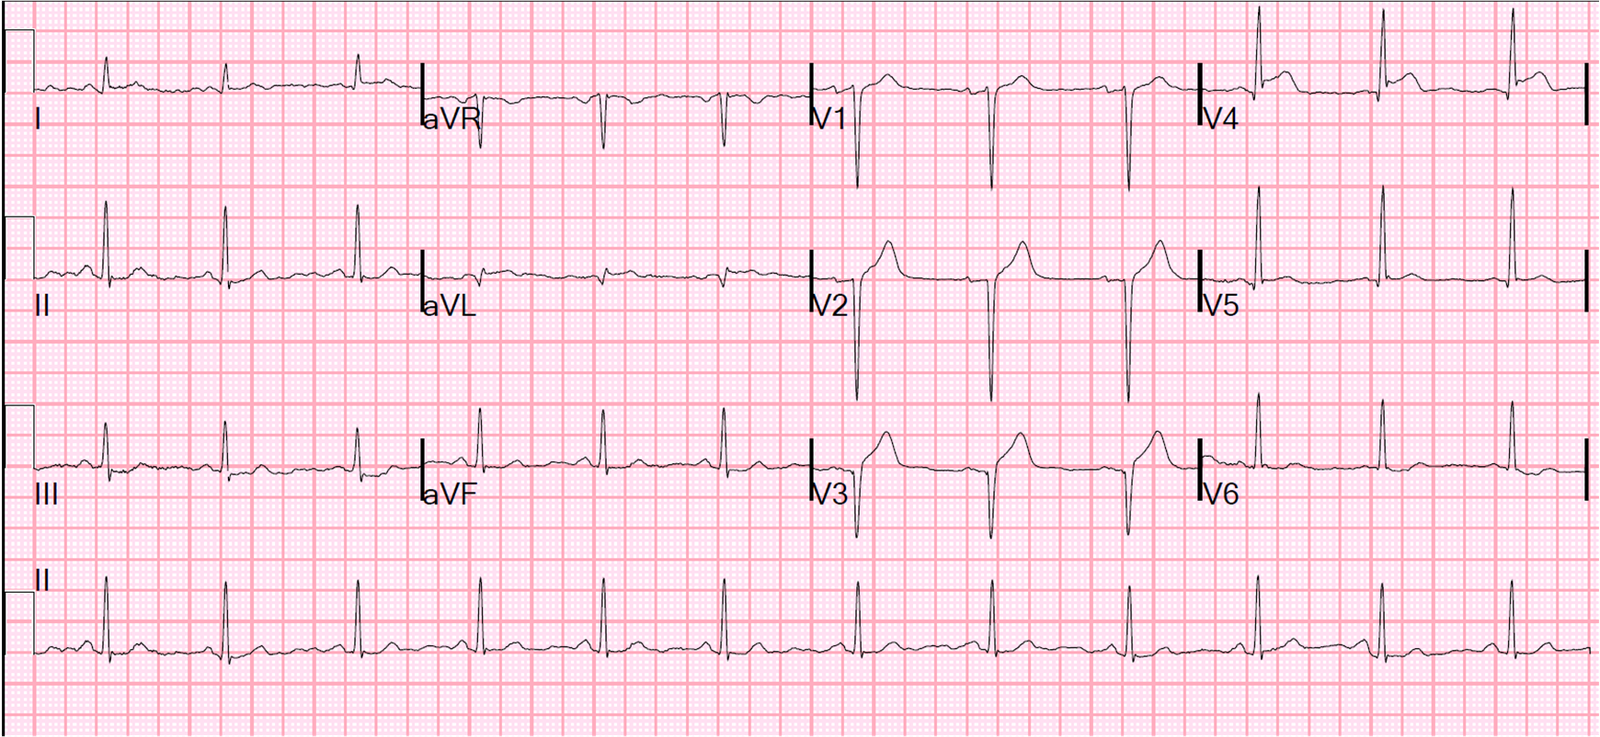
The patient had acute onset of chest discomfort, called 911, and had this prehospital ECG approximately 15-20 minutes prior:
 |
| Besides a PVC, there is no evidence of ischemia. But the fact that it is so different from the one above tells us that the one above one has evolved injury (ischemic ST elevation). |
It turns out that the clinical information made this case much easier than the ECG: the patient looked distressed, was diaphoretic, vomiting, and ill appearing.
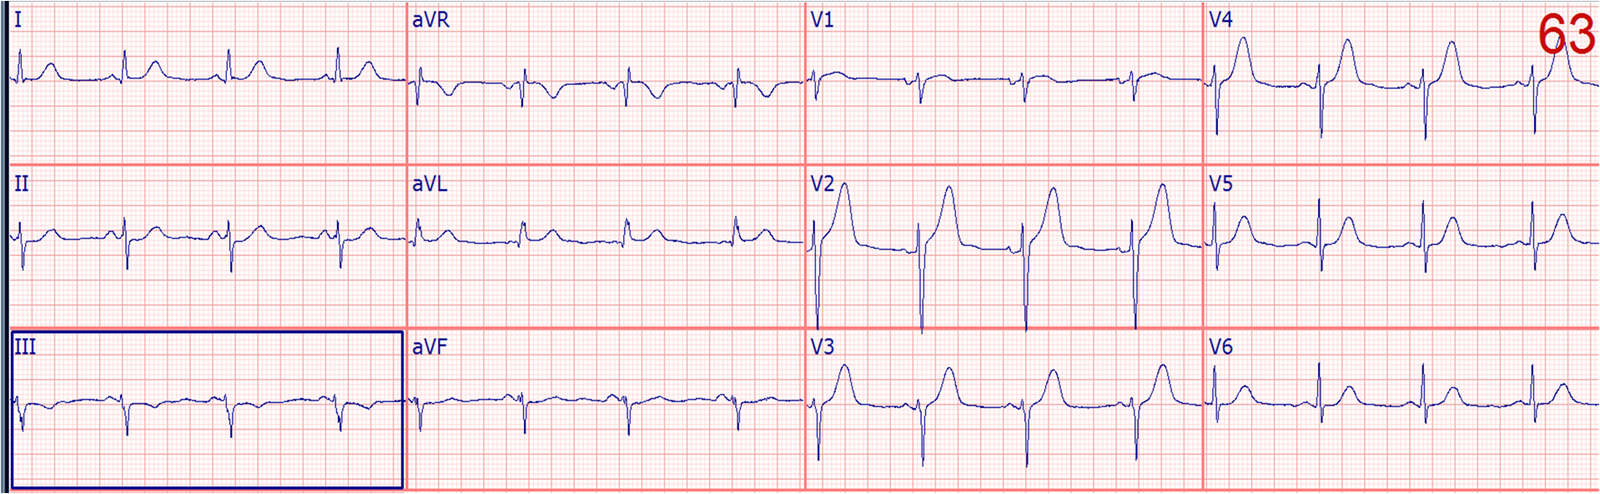
The clinicians looked at this first ECG and the prehospital one and did not think much of it. So they recorded another one shortly thereafter:
 |
| The ST elevation has evolved into a definite STEMI. |
The cath lab was activated.
There was a 100% occlusion of the mid-LAD.
Here is the post cath ECG:
 |
| This is a normal amount of ST elevation, and normal T-waves in V2-V4. There is some T-wave inversion in V5 and V6. |
The management was so fast that the peak troponin I was only 9.2 ng/mL.
Subsequent echo showed:
Left ventricular hypertrophy concentric .
Regional wall motion abnormality-distal inferior wall .
Regional wall motion abnormality-apex.
I suspect there will be nearly full recovery of wall motion because the post cath ECG is nearly normal.
Here is another identical case that did not turn out so well.
Learning Point:
ST elevation must be adequately explained, even if it appears benign. This case was relatively easy because of the clinical presentation.
Many others are not so easy and require subtle ECG diagnosis.
People often think that I read these with a retrospectoscope. I do not. I found this in a “stack” (reading through a list on the computer) of undifferentiated ECGs. And I do this often. There are ways to make the diagnosis from the ECG. They can be learned. And the LAD occlusion, early repol formula can greatly help.