Post by Dr. Mark Hellerman.
= = =
Two octogenarians with known extensive CAD presented to our ED the same afternoon with chest discomfort. In both cases, a “Heart Alert” was activated — prompting emergent cardiology evaluation for consideration of cath lab activation — based on the following ECG findings:
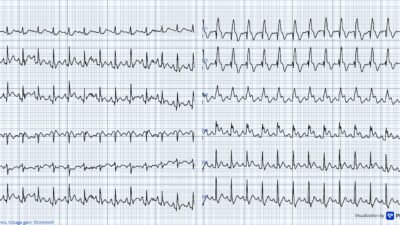
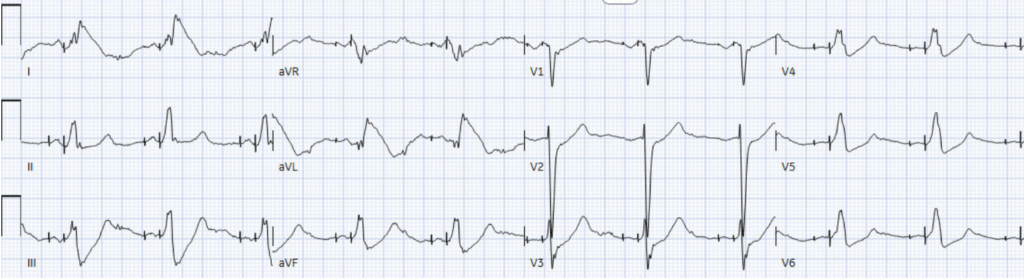
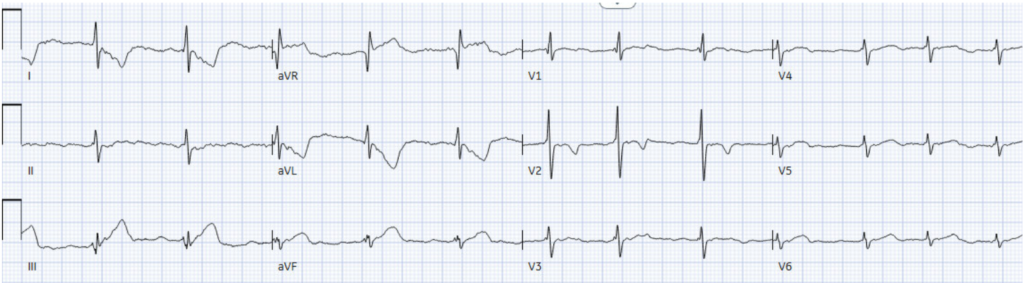
Patient A:
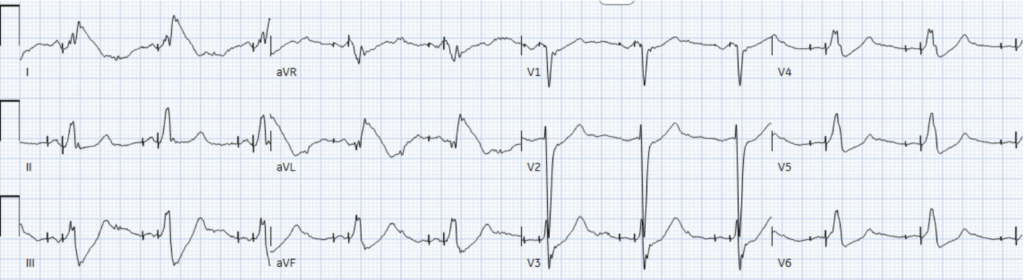
Patient B:
— Would you activate the cath lab for both patients, neither patient, or only one of them?
= = =
Taking a closer look at each case we find that:
Patient A — is an 80-something year old woman w/ extensive CAD who developed 6/10 chest pain during cardiac rehab.
At first glance, the dramatic T waves might immediately raise concern for a +STEMI OMI — even evoking the “Shark Fin” sign (an ECG pattern in which the QRS complex, ST segment, and T wave merge into a giant triangular waveform associated with severe transmural ischemia and high-risk coronary occlusion).
Experienced readers of this blog, however, would quickly recognize that the next best step in management is not heparin or cath lab activation, but repositioning of the limb lead electrodes!
I sent the ECG to a group of ECG enthusiasts — including Steve Smith and Pendell Meyers — who immediately recognized the pattern as APTA (Arterial Pulse-Tapping Artifact).
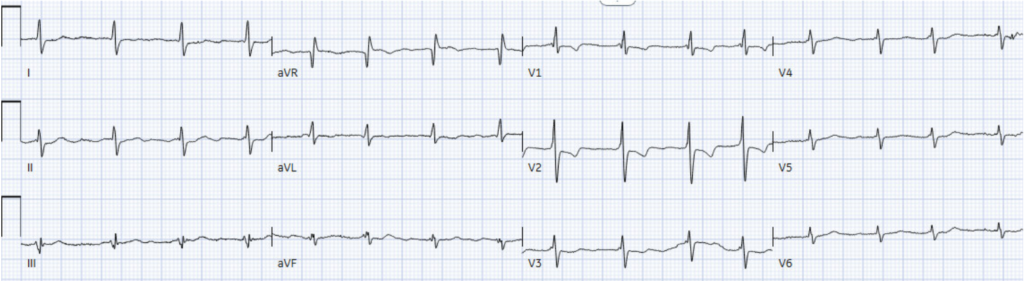
Fortunately, the responding fellow was a reader of the blog. After requesting lead repositioning — the suspected diagnosis as arterial pulse-tapping artifact was confirmed:
The telltale sign was the presence of bizarre, nonphysiologic ST-T wave distortion that did not fit a coronary distribution and spared a single lead, and only a single lead, of leads I, II, and III. With simple repositioning of the culprit electrode away from a pulsatile vessel, the artifact vanished.
High-sensitivity troponin I remained essentially flat at 24 –> 30 –> 28 ( in the setting of chronic kidney disease with an admission creatinine of 2.5). TTE similarly showed no significant interval change from prior study, with low-normal LV systolic function (EF 52%) and chronic regional wall motion abnormalities, including severe basal inferior and moderate septal apical hypokinesis.
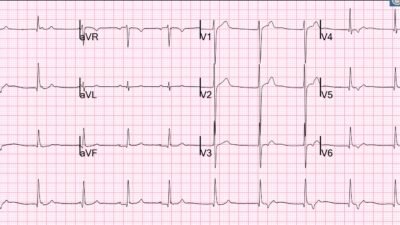
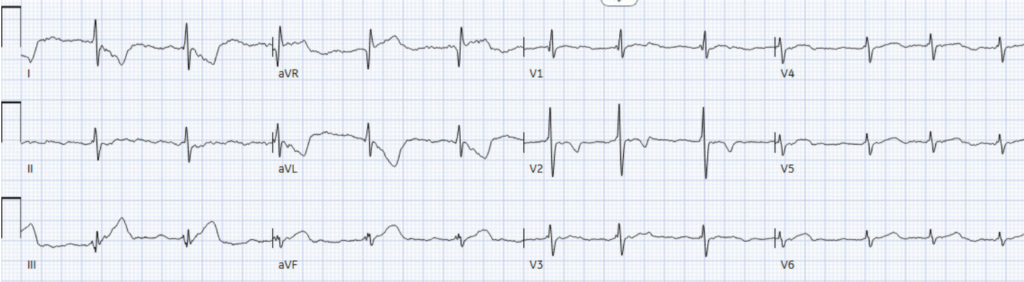
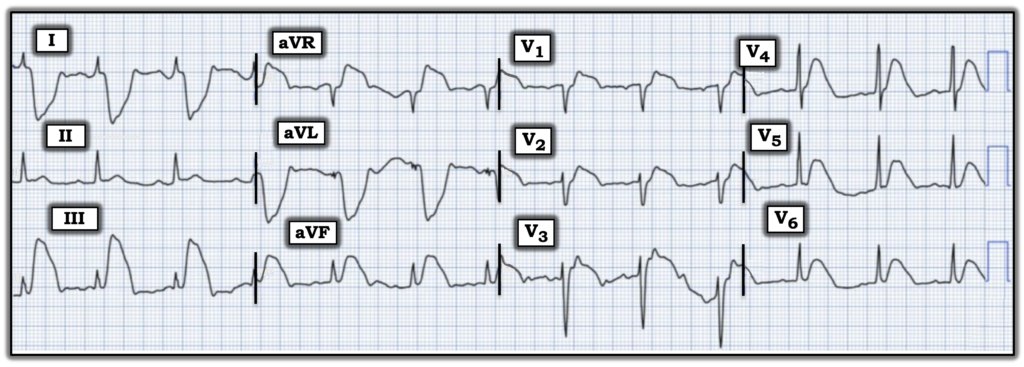
Six hours later, during the same call shift, the cardiology fellow was again called for emergent evaluation for consideration of cath lab activiation — this time for Patient B, an octogenarian with extensive CAD, s/p CABG — who presented with shortness of breath associated with chest discomfort.
At first glance, this ECG appears to demonstrate hyperacute inferior T waves with reciprocal ST depression in aVL — raising concern for an acute inferior OMI.
This one is tricky for at least 2 reasons:
- 1) Those really do look like hyperacute T waves in the inferior leads — enough so that even the Queen of Hearts supported concern for acute OMI.
- 2) Cognitive bias might lead one to dismiss the possibility of arterial pulse-tapping artifact in a second patient only hours later — reasoning that such a “rare” diagnosis could not plausibly occur twice in a single shift. In reality, this ECG artifact is likely unrecognized rather than truly rare — and once you learn to recognize it, you’ll start seeing it far more often in daily practice.
- Smith: this is my experience also: APTA is VERY common, but sometimes it is so subtle that providers don’t look for an explanation of the ECG findings.
= = =
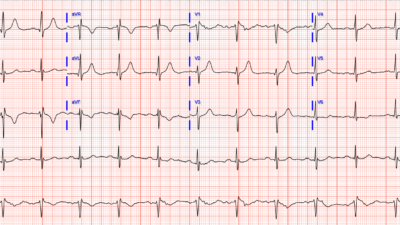
Once again, I sent this ECG to the same group of ECG enthusiasts. Pendell — recognizing the unusually spared single limb lead ( = lead II) — immediately replied: “Try changing leads, just in case”.
Sure enough, after lead repositioning — the apparent hyperacute T-wave abnormalities completely resolved:
Smith: the ECG is, however, diagnostic of right ventricular hypertrophy (RVH). There is right axis deviation and a very large R-wave in V1, with R/S ratio in V2 that is nearly equal to 1. There are the typical repolarization abnormalities of RVH in lead V2. That ST depression and T-wave in V2 might make you think there is posterior OMI, but the findings of RVH would keep you from making that diagnosis because these are typical ST-T of RVH!
Ultimately, the patient’s dyspnea/chest discomfort was attributed to acute-on-chronic hypoxic respiratory failure from RSV infection with acute exacerbation of COPD. High-sensitivity troponin I remained essentially flat (39 –> 41) — and repeat TTE demonstrated interval improvement in LV systolic function compared with the prior study (30% to 50%), along with chronic regional wall motion abnormalities.
= = =
Discussion: Arterial Pulse-Tapping Artifact
So what exactly is arterial pulse-tapping artifact, and how can we recognize it on the ECG?
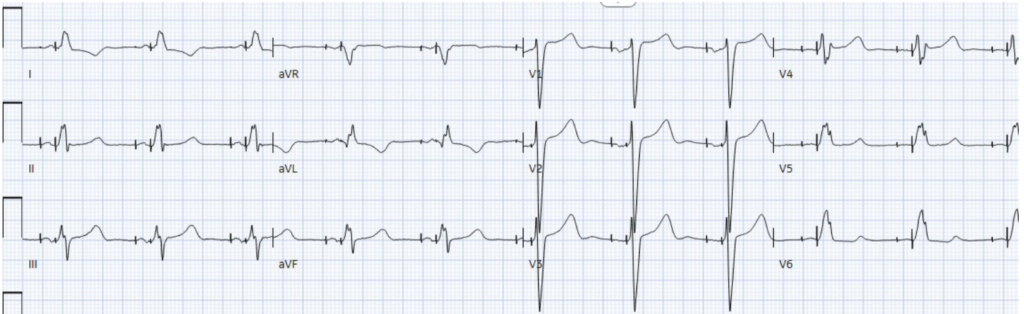
The best way to explain the answer— is through a 3rd case that I encountered just a few weeks earlier.
- This 3rd case was recently published (Nerkar M, Rainer K, Frye J, Zhang DT, and Hellerman MB — JACC Case Rep: 31(20): May, 2026).
- The ECG below is the initial ECG from this JACC Case Reports article. The 2-minute Video Explanation of this case (also from this JACC manuscript) — then reviews the physiology used to recognize the “culprit” extremity within seconds!
= = =
Take-Home Points
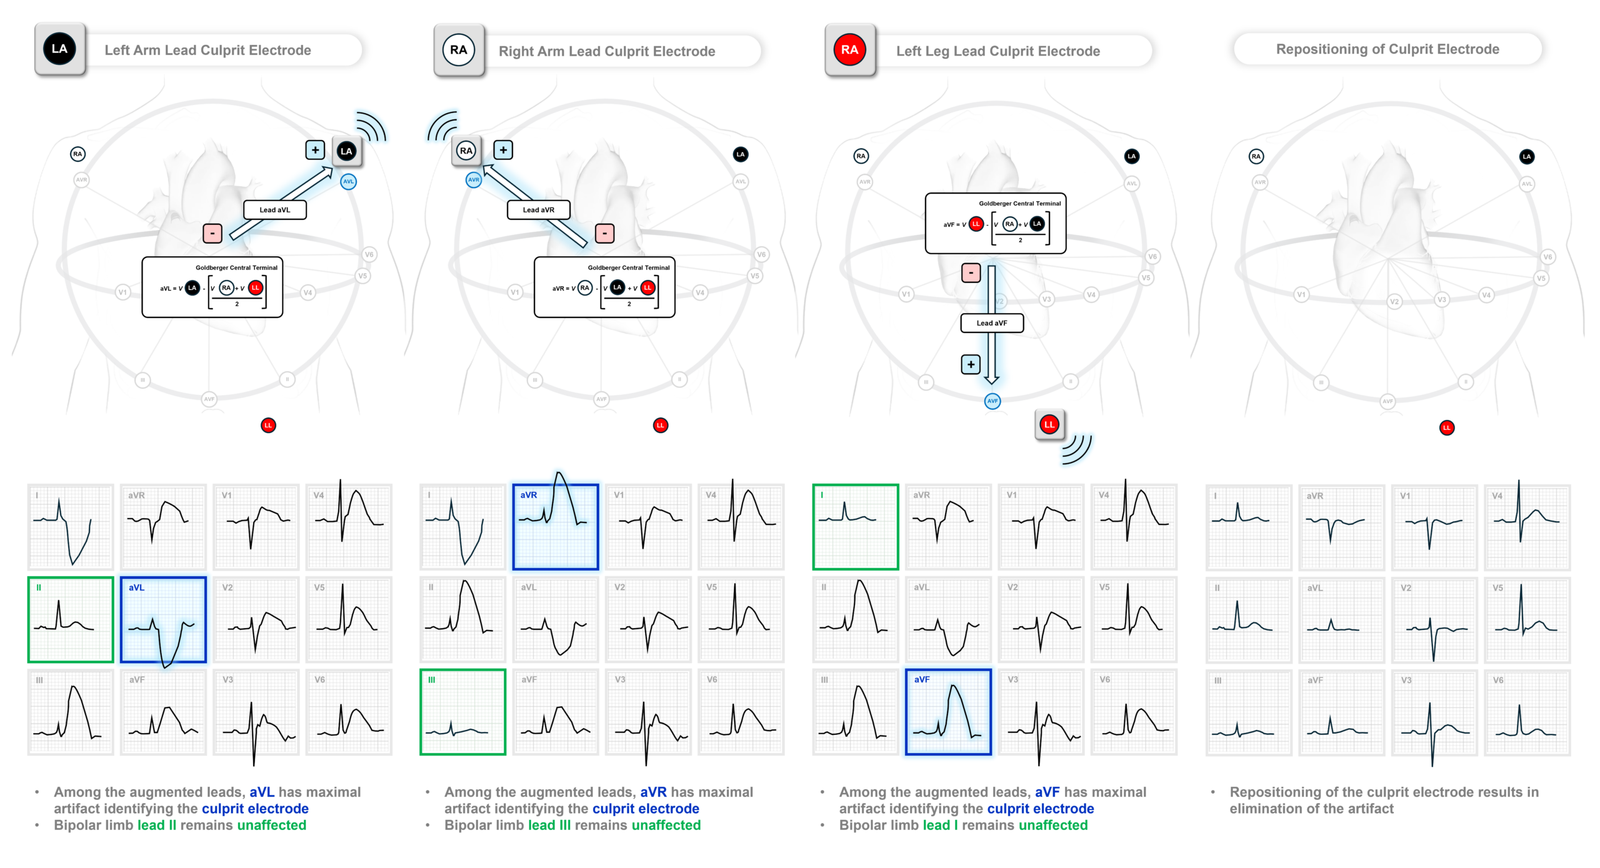
- Suspect arterial pulse-tapping artifact when bizarre ST-T abnormalities spare one of the 3 standard limb leads.
- The single lead of I, II and III which is not bizarre identifies the 2 electrodes that are not affected
- The augmented lead (aVR/aVL/aVF) with maximal artifact identifies the “culprit” electrode.
- Confirmation of arterial pulse-tapping artifact is simple: Reposition the electrode and repeat the ECG before activating the cath lab.
- APTA is more common than most clinicians realize! As the above cases demonstrate — you may encounter multiple examples in a single shift. Prompt recognition can prevent unnecessary cath lab activation!
Remember:
Identification of the “culprit” electrode is simple — as elegantly described multiple times on Dr. Smith’s ECG Blog by Drs. Smith, Meyers, Grauer, and Frick [08/26/2022, 11/08/2022, 12/05/2022, 01/17/2023, 03/17/2023, 02/18/2024] ==> the augmented lead (aVR/aVL/aVF) with maximal artifact identifies the culprit electrode:
= = =
= = =
==================================
MY Comment, by KEN GRAUER, MD (6/2/2026):
As recently as a few years ago — I had never heard of PTA (Pulse-Tap Artifact — also called APTA= Arterial Pulse-Tap Artifact). By now — I’ve gained “expertise” in recognizing this surprisingly common entity that you will doubtlessly impress your colleagues with, by providing instant reassurance that the cath lab need not be activated for cases like Patients A and B (from Dr. Hellerman’s brilliant discussion above of the Hows and Whys for recognizing PTA). You’ll then confirm for your colleagues how simply repositioning the electrode leads results in the magical disappearance of the worrisome deflections.
- The beauty of this PTA phenomenon — is that you’ll also instantly be able to tell your colleague which extremity electrode is the “culprit” causing PTA.
- And magically, your colleague within a surprisingly short period of time will get back to you — telling you of the several additional PTA cases that they’ve just discovered, now that they know what to look for!
- And eventually (Hopefully! ) — the news will spread to enough providers such that PTA will be readily recognized not only by emergency providers — but also by technicians and others who do the ECG recordings, such that they will instantly recognize and correct faulty electrode lead placement on a pulsating artery without having to return to the patient to record a 2nd ECG.
- I encourage all readers of Dr. Smith’s ECG Blog to watch the enlightening 2-minute Video Explanation in Dr. Hellerman’s above discussion (This video taken from Drs. Nerkar, Hellerman et al’s recent publication in — JACC Case Rep: 31(20): May, 2026).
- For EASY reference — you can find ready access to multiple Technical Misadventures (lead reversals, various forms of artifact — including a series of PTA cases) — from the Menu at the TOP of every page in Dr. Smith’s ECG Blog.
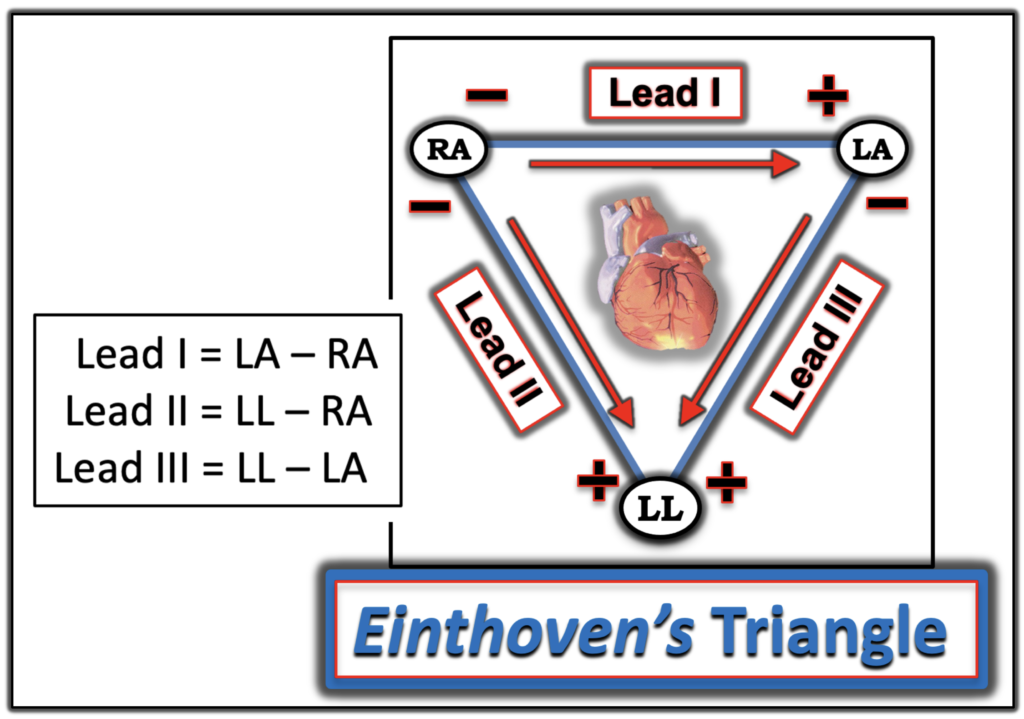
- My “Go-To” Figure: No matter how many times I discover a PTA “misadventure” — I find myself returning to Einthoven’s Triangle as a visual aid to help me determine which leads are recorded by electrical activity deriving from which of the extremity electrodes (Figure-1).
= = =
Figure-1: Einthoven’s Triangle — first proposed by Willem Einhoven in 1912, remains my “Go-To” figure for visualizing the relationships between ECG leads and the limb lead recording electrodes.
= = =
Another Look at the ECGs from Patients A & B …
Dr. Hellerman artfully dissected the Hows & Whys for recognition of PTA tracings. But did you catch the other important ECG findings in the cases he presented?
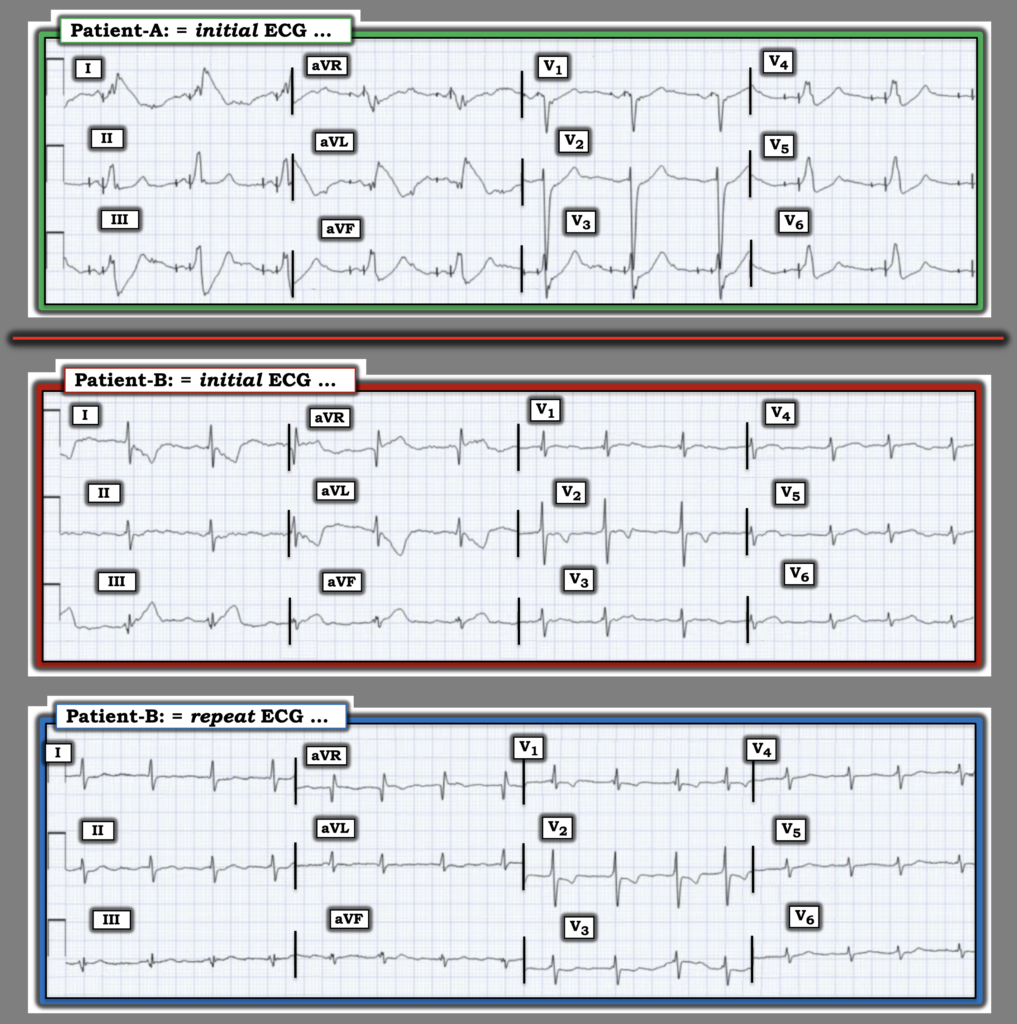
- Take another LOOK at the tracings for Patients A and B (that I’ve reproduced in Figure-2) …
= = =
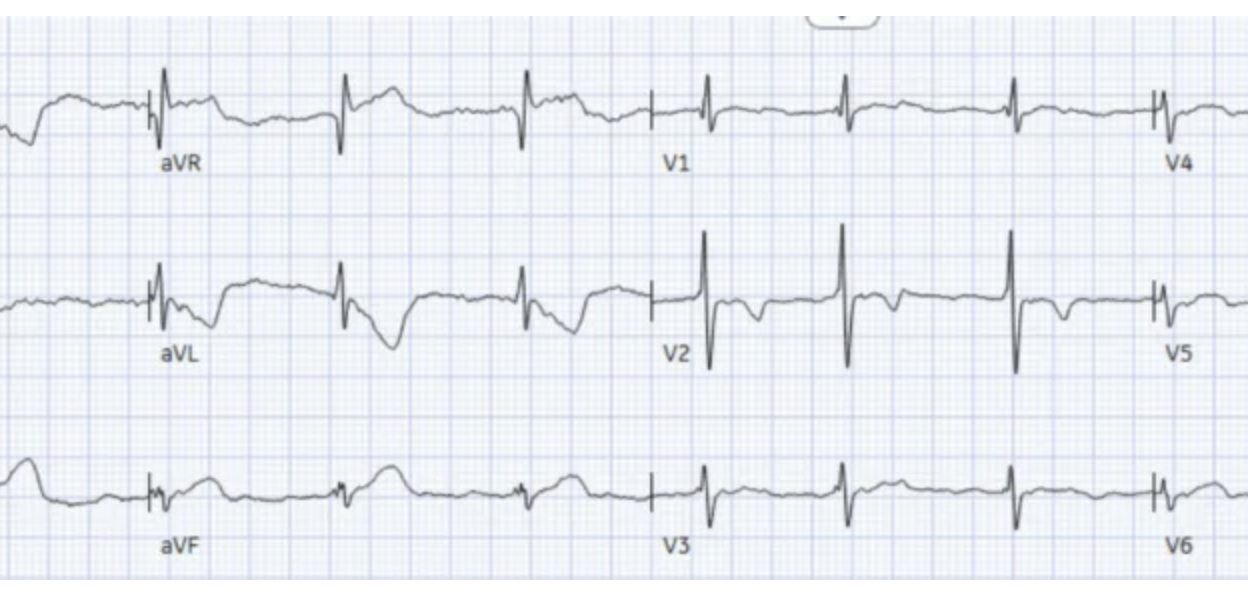
Figure-2: I’ve reproduced the initial ECGs from Patients A and B — as well as the repeat ECG from Patient B. What additional findings do you see?
= = =
Answers:
- Patient-A: There is both atrial and ventricular pacing in the ECGs from Patient-A. Assessment of acute ST-T wave changes will often be more difficult, though definitely possible with many paced tracings. This case provides a nice example of how the same principles are used for detecting PTA and the “culprit” extremity with paced as well as non-paced tracings.
- Patient-B: After repositioning the LA recording electrode and repeating the ECG in Patient B — there are 2 important findings that should be noted: i) The rhythm is not sinus. Instead — the R-R interval is subtly irregularly irregular without P waves = Atrial Fibrillation, here with a controlled ventricular response; — and, ii) There is marked RVH — as suggested by the predominant R wave in lead V1 + the finding of RV “strain” (T wave inversion in leads V1,V2). In addition — some beats in lead V1 appear to manifest a qR pattern — which is usually associated with significant pulmonary hypertension. Other ECG findings associated with longstanding and severe pulmonary disease include low voltage in a number of leads (paticularly in left-sided chest leads V5,V6) — and S waves in no less than 10/12 leads! Appreciation of how severe this patient’s longstanding COPD is, is an important factor for deciding on optimal management — and this can be readily determined from a quick look at this tracing!
= = =
= = =