This patient called 911 for chest pain. The medics did an amazing job of recording serial ECGs.
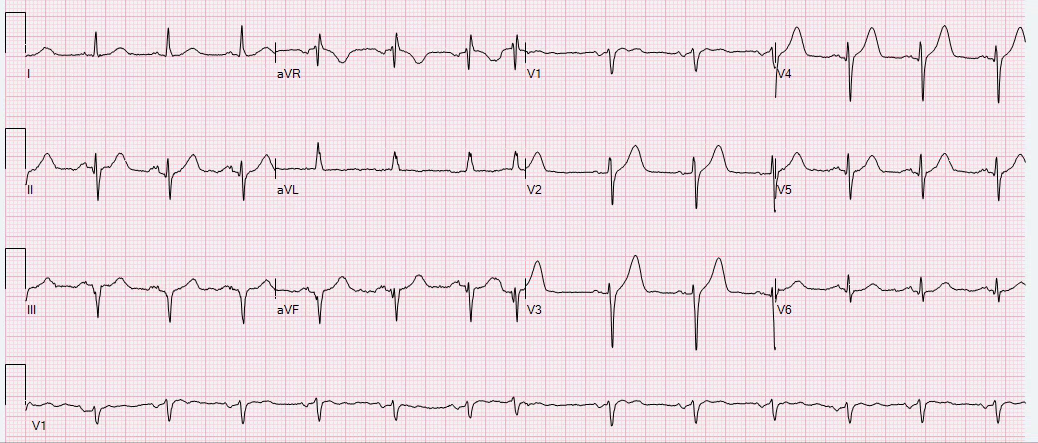
Time zero
 |
| Hyperacute T-wave and subtle STE in aVL with Reciprocal ST depression (with reciprocally hyperacute T-waves!) in inferior leads. ST depression in V3-V6 typical of diffuse subendocardial ischemia. High lateral STEMI [typical of circumflex or first diagonal (D1) occlusion]? In any case, it is diagnostic and the cath lab was activated prehospital This looks like there is a thrombus in the LAD at the ostium of D1. It is occluding enough of the LAD to result in diffuse subendocardial ischemia. This is sub epi cardial ischemia. |
1 minute
 |
| Not much change |
3 minutes
 |
| Still not much change |
5 minutes
 |
| Slightly less ST depression Is the subendocardial ischemia diminishing? |
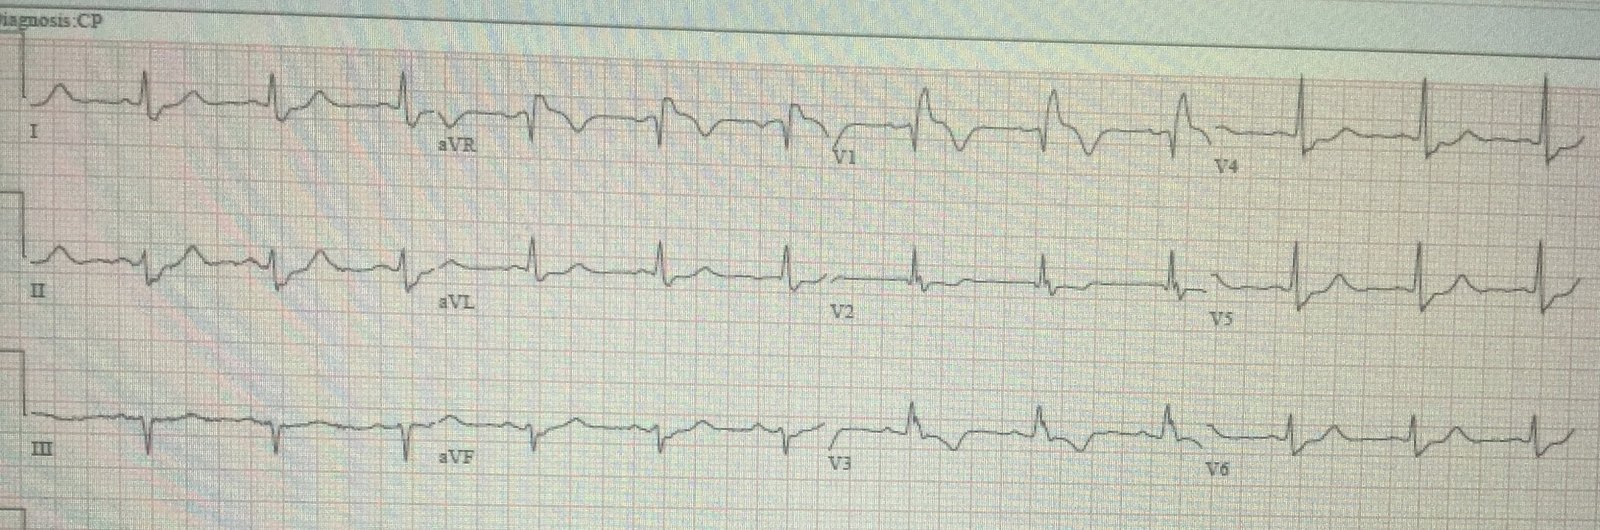
14 minutes
 |
| Significantly less precordial ST depression More inferior ST depression |
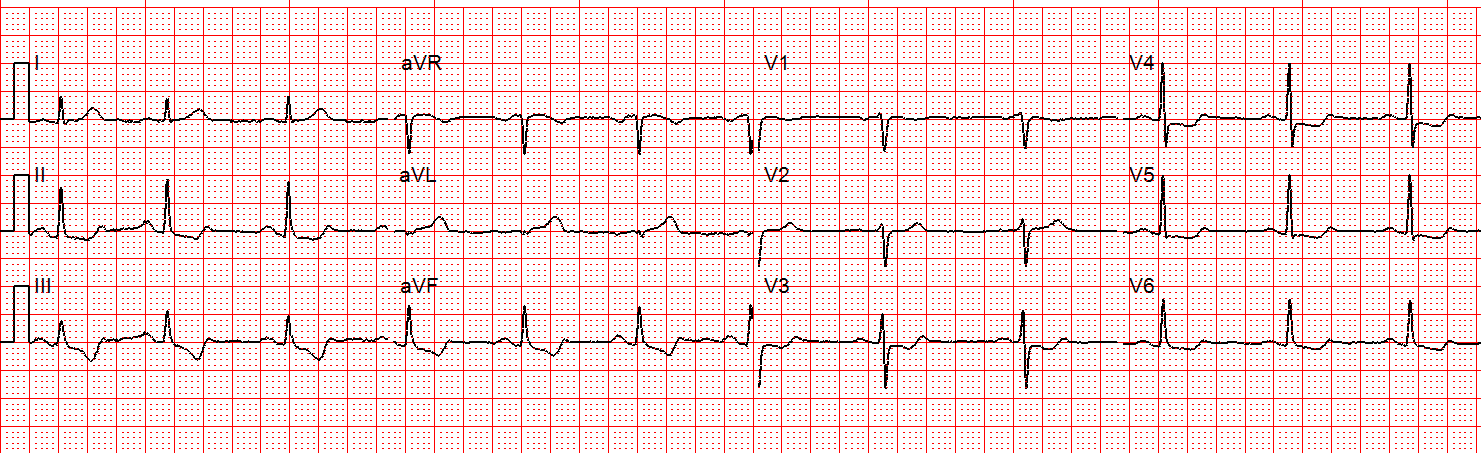
17 minutes
 |
| New ST Elevation in V2 New ST Elevation in aVL More reciprocal ST depression in inferior leads
|
Midanterolateral MI:
STEMI: Which coronary artery is occluded?
Is this acute coronary occlusion? Simple ACS? Where is the culprit lesion?
Recordings continue
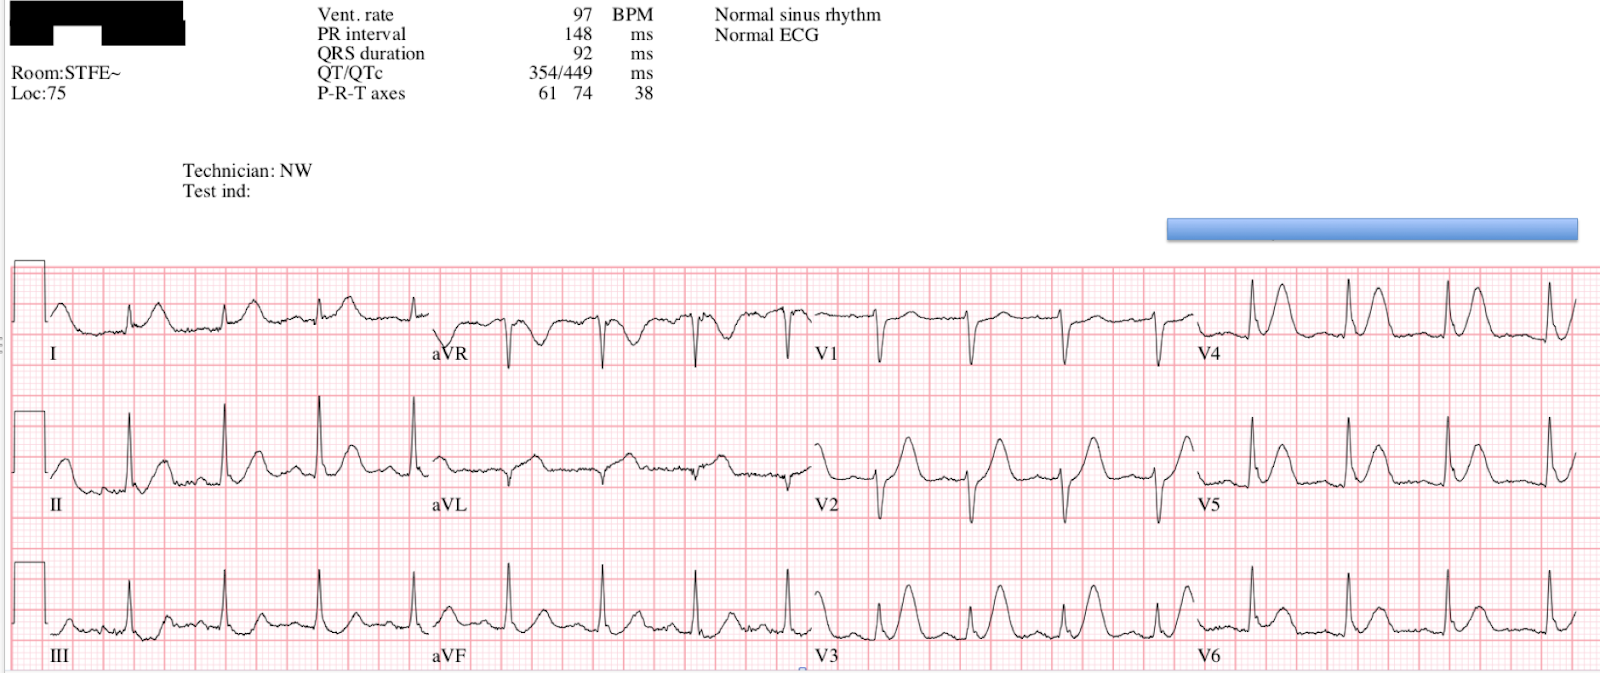
19 minutes
 |
| QRS is widening, with New Left Anterior Fascicular Block Lots of precordial ST Elevation, now diagnostic of LAD occlusion. What is happening? The thrombus in the LAD which was initially obstructing enough flow to result in subendocardial ischemia has propagated and is now completely occluding the LAD, resulting in STEMI (full subepicardial ischemia). |
23 minutes
 |
| About the same |
24 minutes
 |
| More ST Elevation/Depression |
26 minutes

The patient was taken to the cath lab.
A proximal thrombotic LAD occlusion was found. There was no detail about whether it was directly at the ostium of the first diagonal or not.
![]()
==================================
Comment by KEN GRAUER, MD (11/15/2018):
==================================
It’s hard to imagine a better post than this one for the recording of serial ECGs to illustrate the evolution of an extensive acute STEMI. I focus my comments on some additional teaching points to the excellent discussion by Dr. Smith.
- For clarity and ease of comparison — I’ve selected just 4 of the 10 tracings to highlight important serial changes (Figure-1).
==========================
ECG #1: ( = the Initial Tracing @ Time = Zero):
As per Dr. Smith — the KEY to assessment of ECG #1 lies with the appearance of the ST-T wave in lead aVL. That’s because without lead aVL — the picture would essentially be that of diffuse ST-T wave depression, with slight ST elevation in lead aVR. In a patient with new chest pain — this would suggest probably significant coronary disease — but not acute occlusion!
- Adding lead aVL to this picture in ECG #1 adds urgency to the situation. Despite no more than subtle ST elevation in aVL — the disproportionately tall, peaked and fatter-than-they-should-be T wave in lead aVL clearly suggests that this is an acute change.
- Confirmation that what we see in lead aVL is acute — is forthcoming from the mirror-image opposite picture of the ST-T wave in lead III. In association with similar-looking (though not quite as marked) ST-T wave depression in the other 2 inferior leads (leads II and aVF) in this patient with new chest pain — there should no longer be any doubt that the hyperacute appearance in lead aVL of ECG #1 is real.
 |
| Figure-1: Comparison between 4 of the 10 serial ECGs recorded in this case (See text). |
==========================
Question A — Why is there is less ST depression in the chest leads for ECGs #5 and #6 — compared to the amount of ST depression seen in the chest leads for initial tracing ECG #1?
- HINT — Be sure to review ECG #8 before answering.
================
Answer — If one simply looked at the 6 chest leads in ECG #5 alone — one would never guess this patient was in process of evolving an extensive anterior STEMI. That’s because the ST-T waves in the chest leads of #5 offer a transition look between more prominent chest lead ST depression in ECG #1 — and, progressive T wave peaking, leading to frank chest lead ST elevation in ECGs #6 and 8.
- MORAL — If you happen to “catch” the patient at a moment in between evolution from ST depression on-the-way-to ST elevation — the temporary result might be minimal ST segment deviation. That’s why serial tracings are needed.
==========================
Question B — What happens to the frontal plane axis during the course of 23 minutes as one follows the sequence of ECG changes from ECG #1 until ECG #8?
================
Answer — The frontal plane axis progressively shifts to the left as one follows serial tracings, especially from ECG #5 until ECG # 8.
- Note development of an S wave in leads III and aVF in ECG #6.
- S waves deepen, and the QRS complex becomes predominantly negative in all 3 inferior leads by the time ECG #8 is recorded. This is consistent with a frontal plane axis more negative than -30 degrees — which satisfies criteria for LAHB (Left Anterior HemiBlock).
- Support that this leftward axis shift truly indicates development of a new conduction defect is forthcoming from the ~0.02msec of additional QRS widening now evident in ECG #8.
- NOTE — New hemiblock is another indicator of the extent and severity of this acute STEMI.
==========================
Question C — Going back to ECG #1, what findings in this initial ECG should alert us that this picture might soon evolve to the anterior STEMI seen in ECG #8?
================
Answer — As emphasized by Dr. Smith — the hyperacute ST-T wave in lead aVL of this patient with new chest pain suggests possible LCx (Left Circumflex), 1st or 2nd Diagonal branch, or LAD (Left Anterior Descending) occlusion in ECG #1 — depending on what other leads on the ECG will evolve to show.
- Dr. Smith highlighted the finding of ST depression in multiple leads in ECG #1 — which suggested diffuse subendocardial ischemia. In this context — I would not have expected to see a straight, isoelectric ST segment with a clearly upright T wave in lead V2 unless the picture in ECG #1 was about to transition to ST segment elevation in this V2 lead. While impossible at this point to be certain of what was soon to come — lead V2 was clearly a lead to watch!
==========================
BOTTOM LINE —There is MUCH to be learned from careful review of serial tracings. Retrospective self-analysis after all the ECGs in a case have been recorded and the end-result is known — is perhaps the best way to hone our skills for prospectively recognizing changes the next time a similar case is encountered.
- SUGGESTION — It may be worthwhile to spend a final moment revisiting the serial changes in each of the leads for the 4 ECGs sequentially shown in Figure-1.
![]()