By Jesse McLaren
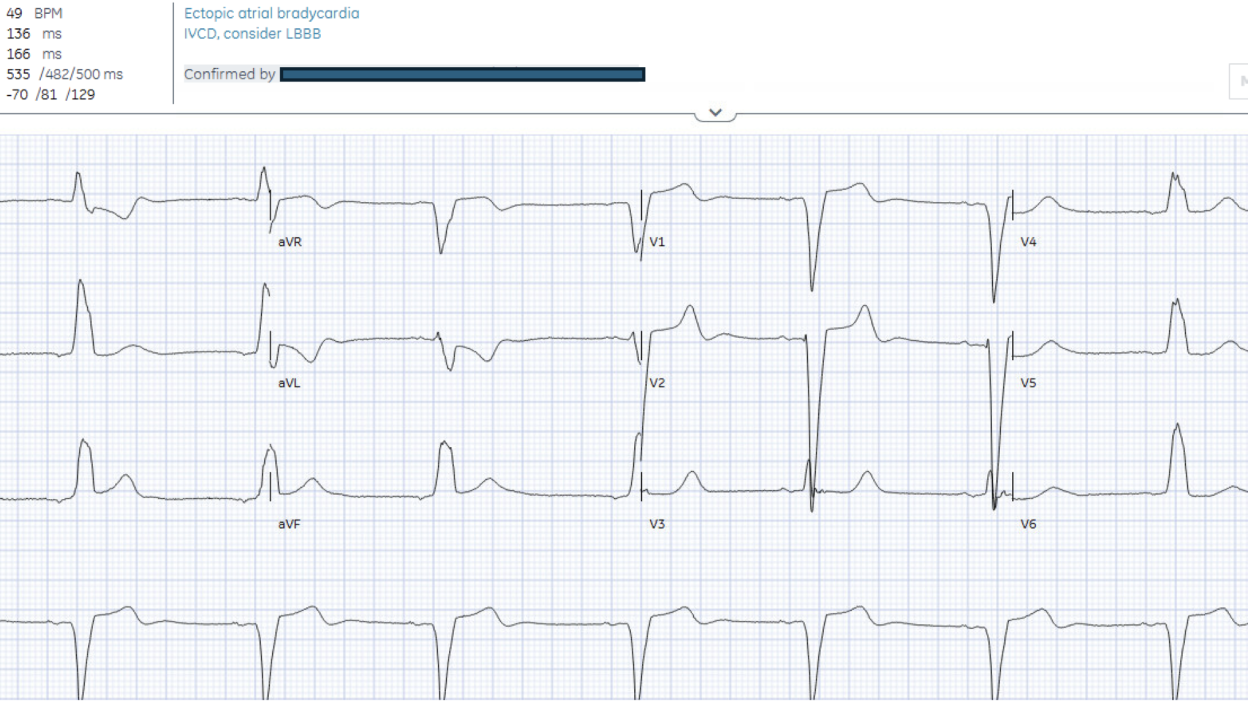
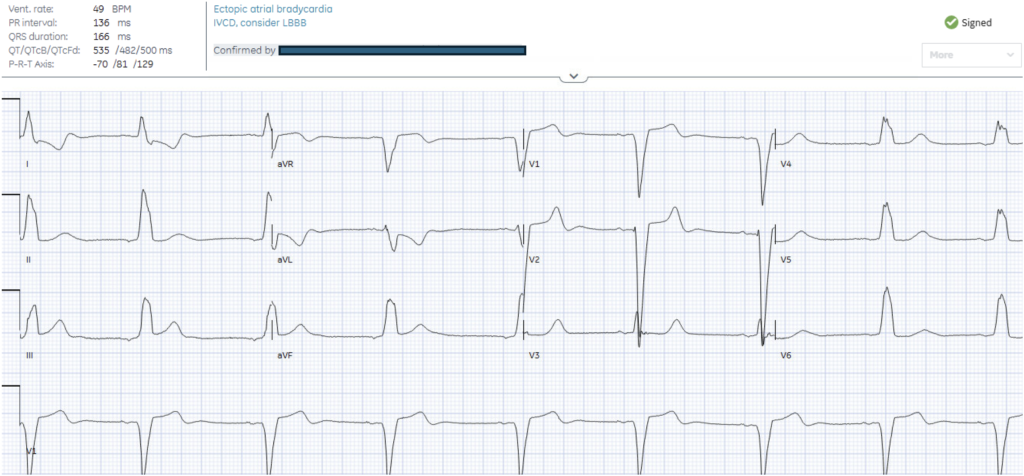
An 80 year-old female with a history of diabetes and CABG called paramedics for 2 hours of epigastric burning that did not resolve after nitro. Blood pressure was 130/60 and heart rate was 50. Paramedic ECG machine read ‘STEMI’ so the patient was transferred to the nearest cath lab. On arrival the ECG was noted to have LBBB. What do you think?
What do you think?
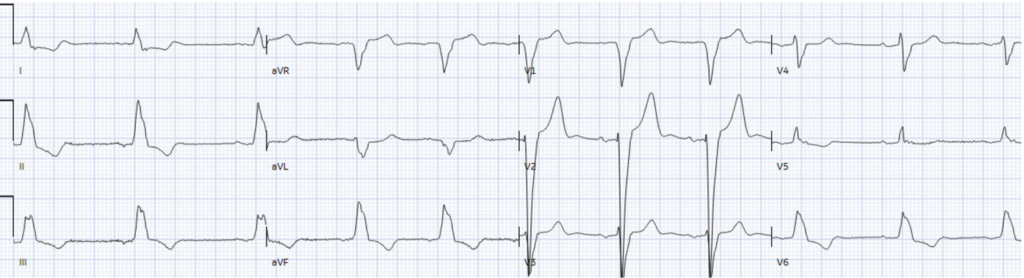
There’s ectopic atrial bradycardia (inverted P wave inferior leads) and LBBB as stated in the final interpretation. But there’s also concordant STE in lead III (with reciprocal change in aVL) = Sgarbossa positive.
There was difficulty gaining vascular access in the cath lab, so the procedure was reconsidered. The patient was noted to have a 1) no chest pain, 2) history of a LBBB, 3) only mild STE in one lead in the context of wide QRS, and 4) no obvious regional wall motion abnormality on POCUS. So they were deemed ‘low suspicion for STEMI’ and transferred to CCU for monitoring.
But:
- ACS without chest pain is a very typical presentation in elderly, diabetic, females
- POCUS can miss subtle new regional wall motion abnormalities, especially in a patient with prior CABG and LBBB
- LBBB chronology is not relevant to ECG interpretation for OMI. The question is whether there is Modified Sgarbossa Criteria, which has high (80%) sensitivity and very high (99%) specificity only requiring one lead. As the QOH shows, there’s only lead with STE, but there’s also reciprocal STD in aVL and excessive discordant STD in lead I. So there’s three leads pointing to inferior OMI, which could also explain the bradycardia (from LCX or RCA occlusion)
- So it looks like inferior OMI and that is very consistent with epigastric burning. Approximately 1/3 of inferior OMI present with epigastric discomfort. So epigastric discomfort is a high pretest probability symptom, especially if no epigastric tenderness.
- Here is the PMCardio Queen of Hearts AI ECG Model:
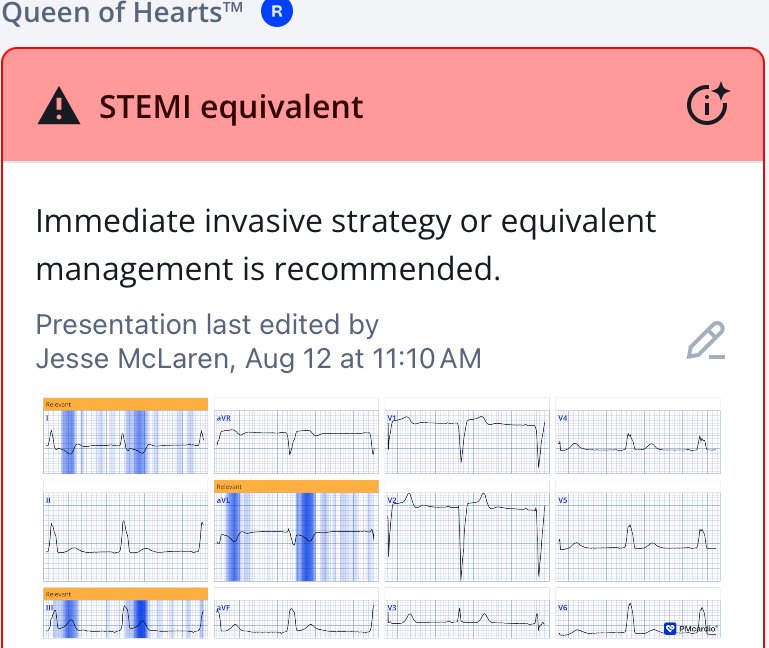
The first version of the Queen was 61% sensitive and 93% specific for OMI in the setting of LBBB. The latest versions are far better.
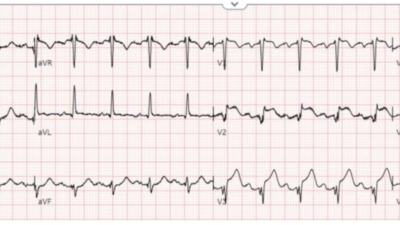
In CCU the initial serial hs-troponins I were 130 and 280 ng/L (normal <16 in females), with repeat ECG:
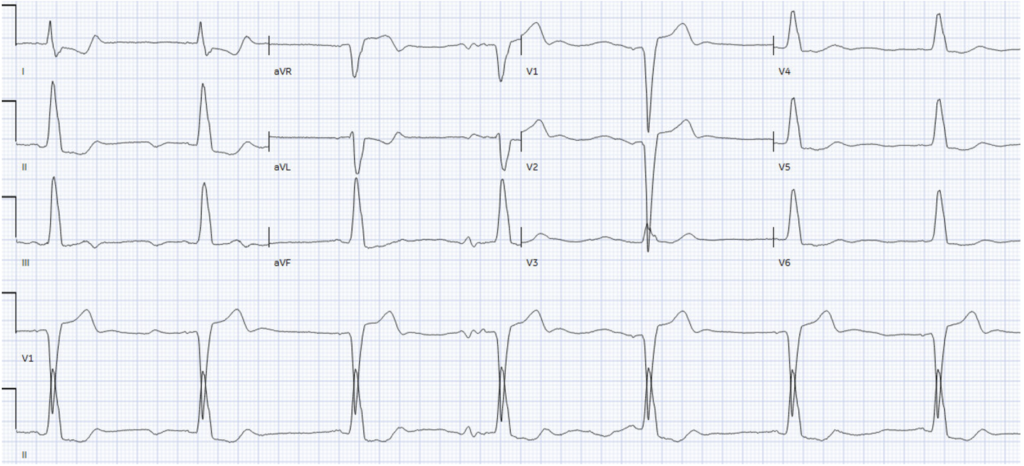
There’s been improvement the inferior STE, with terminal T-wave inversion (biphasic) in lead III, both suggesting reperfusion (or prolonged occlusion with completing MI!), and proving this is dynamic ischemia – but QOH still calls it OMI based on III/aVL/I.
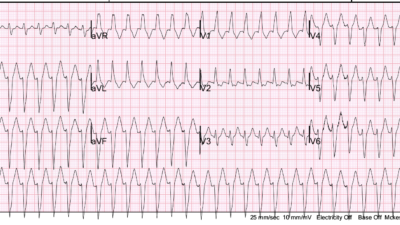
Repeat troponin rose to 2,100 and repeat echo showed inferior regional wall motion abnomality. The patient developed worse bradycardia from sinus pauses alternating with ectopy:
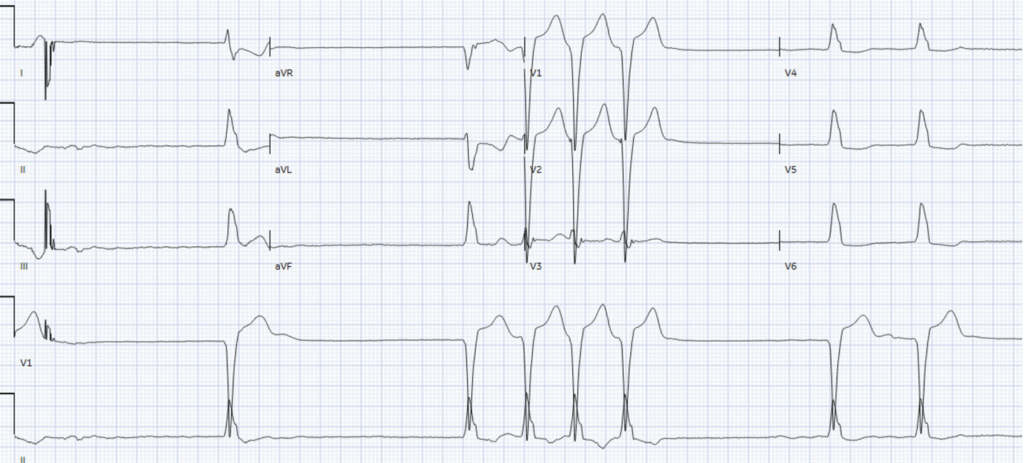
There’s too few complexes for QOH to interpret, leading to inconclusive result. But patient has clear MI from rising troponin, along with hemodynamic instability requiring angiography regardless of ECG, and new regional wall motion abnormality on ECG.
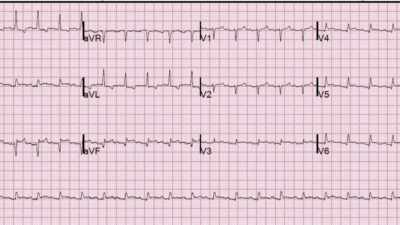
The patient was taken back to cath lab: 100% RCA occlusion, peak hs-troponin I was 47,000 ng/L (very high: most STEMI are > 5000-10,000; this is 5-10x that high). Discharge ECG showed resolution of primary ischemic changes and return of appropriate discordance (which QOH now reads as no sign of OMI).
The patient could have received reperfusion hours earlier – before the three serial troponin levels, worsening bradycardia, and visible regional wall motion abnormality – based on pre-test likelihood and ECG interpretation.
Take home
- Pre-test: ACS without chest pain is not atypical. An 80 year-old diabetic female presenting with epigastric pain is a very typical presentation of ACS, and coupled with the past medical history of CABG, gave the patient a high pre-test likelihood.
- Tests: Modified Sgarbossa Criteria has very high specificity, and QOH trained on OMI can help confirm this when in doubt. On the other hand, troponin is a rear view mirror that shows damage from the past but is falsely reassuring in acute presentations, and POCUS may miss subtle regional wall motion abnormalities especially in a patient with prior CABG and LBBB.
- Post-test: clinical (elderly diabetic female with past medical history of CABG + presentation of epigastric burning) + ECG (bradycardia + Sgarbossa Criteria) = very high post-test likelihood of OMI, requiring emergent angiogram regardless of bedside echo or initial troponin.
= = =
==================================
MY Comment, by KEN GRAUER, MD (8/13/2026):
The issue of assessing the ECG of a patient with LBBB (Left Bundle Branch Block) for the presence of acute ischemia is always challenging — witness the series of LBBB cases we’ve presented on Dr. Smith’s ECG Blog (See My Comment in the January 23, 2025 post and the May 17, 2026 post, to name just two of these cases).
- The challenge posed by today’s case was further enhanced by the lack of chest pain (Today’s 80-year old woman complained of “epigastric burning” — but no CP) — as well as by the absence of any regional wall abnormality on Echo, and difficulty gaining vascular access.
- Nevertheless — today’s initial ECG was clearly indicative of an acute OMI until proven otherwise. I focus My Comment on a few additional points as to why this is so.
= = =
Today’s initial ECG …
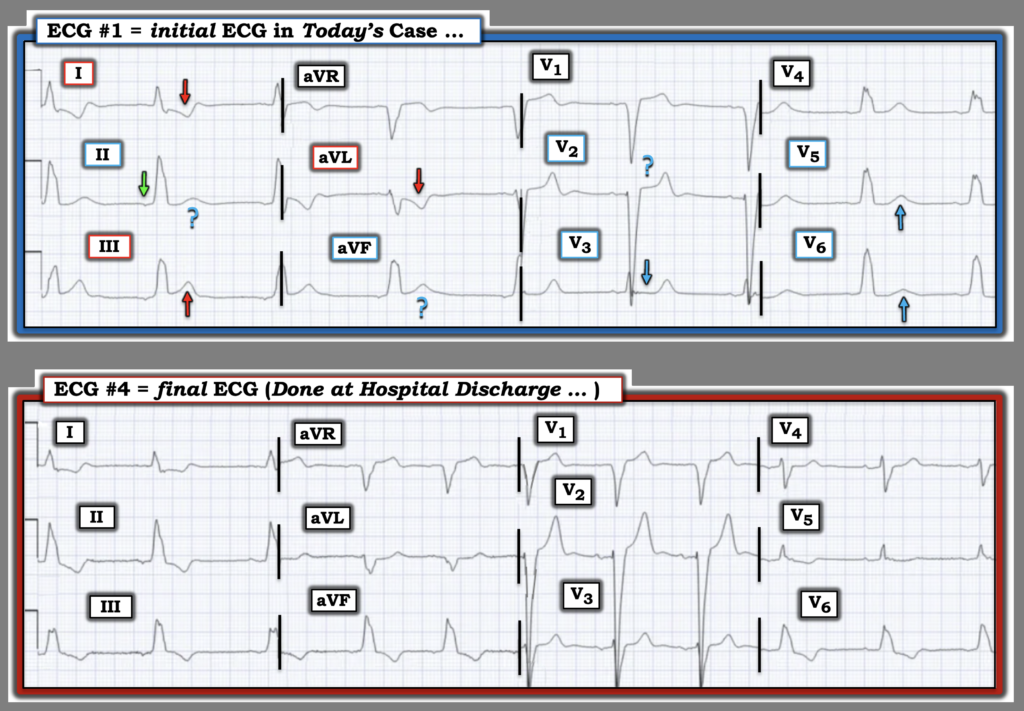
For clarity and ease of comparison in Figure-1 — I’ve reproduced and have labeled today’s initial ECG.
- As per Dr. McLaren — the rhythm in ECG #1 is not sinus, since the P wave in lead II is not upright (GREEN arrow in this lead II). The QRS is wide — with a QRS morphology best described as consistent with LBBB (albeit technically — the finding of a predominantly positive QRS already by lead V3 is distinctly atypical for LBBB).
- In addition — the very deep (nearly 30 mm deep) S wave in lead V3 qualifies as criteria for LVH in association with the above described conduction defect.
As highlighted by Dr. McLaren — the ST-T wave appearance in 3 leads qualifies as positive for modified Smith-Sgarbossa Criteria (based on concordant ST elevation in lead III — and excessive discordant ST depression in leads I and aVL).
- As I’ve suggested in other posts — qualitative criteria (based on ST-T wave findings that simply should not be there in a patient with LBBB) are clearly present in many other leads in ECG #1.
- To Emphasize: It is the shape of the ST-T waves in leads I, aVL and III that immediately tells me this is an acute OMI until proven otherwise. Even though the amount of ST elevation in lead III is not great — there should be no ST elevation at all in this lead given the LBBB. Similarly, the ST depression and obviously disproportionate ST-T wave depression in leads I and aVL have to be assumed acute in this elderly patient who presents with a potential “CP-equivalent” symptom (in the form of new-onset “epigastric burning”) — until you can prove otherwise.
Subtle Points:
- I simply would not expect the T waves to be upright with all positive QRS complexes in the inferior leads given the LBBB. And although by itself — I would not be certain this was abnormal if I only saw the finding of upright T waves without ST elevation in leads II and aVF (therefore the ? in these leads) — in the context of subtle-but-clearly abnormal ST elevation in lead III — I suspected the upright T waves in leads II and aVF represented a similar primary ST-T wave change.
- KEY Point: The way to quickly verify my hunch (ie, that the upright T waves in leads II and aVF are indeed abnormal) — is to search in this patient’s medical record for previous ECGs (Hard to believe that this 80-year old patient with known LBBB and known coronary disease does not have a ready supply of prior tracings that should be accessible for comparison).
- Given the strong suggestion (from leads I,II,III; aVL,aVF) of acute inferior OMI — I looked next for evidence of associated posterior OMI (that is so often seen in association with inferior OMI).
- There is no way that the totally flat ST segment in lead V3 is normal (BLUE arrow in this lead).
- More subtle, is the straightened (albeit gently inclined) ST segment in lead V2 (the ? in this lead) — as I would expect a more robust upright ST-T wave in lead V2, given how deep the S wave in V2 is in this patient with LBBB + LVH.
- I took the picture presented by these ST-T waves in leads V2,V3 as strongly suggestive of associated posterior OMI.
- Finally: With LBBB — normally, the ST-T wave should be oppositely directed (ie, depressed) in left-sided leads that manifest an all-positive R wave. The fact that the T wave is upright in both leads V5 and V6 is an abnormal and potentially acute ST-T wave response unless prior tracings show this same finding (BLUE arrows in these lateral chest leads).
= = =
Figure-1: Comparison between the initial ECG in today’s case — with the final ECG done before the patient was discharged from the hospital.
= = =
Bottom Line:
As per Dr. McLaren — Modified Smith-Sgarbossa Criteria are positive in today’s initial ECG, which should have been enough to merit prompt cath. My point is that the more leads on an ECG that are clearly abnormal — the stronger the case is for prompt cath with PCI.
- Once you can identify 1 or 2 leads with ST-T wave findings that you know are abnormal — it becomes easier to identify more subtle abnormalities in other leads. This principle holds true regardless if the QRS is of normal duration, or if LBBB or other conduction defect is present.
- The initial ECG in today’s case shows not only the 3 leads that satisfy modified Smith-Sgarbossa Criteria to be abnormal — but suggests there are 6 more leads (for a total of 9/12 leads) that manifest potentially acute ST-T wave changes!
= = =
Prove this to yourself!
- Take another LOOK at the 2 ECGs in Figure-1.
- Compare ECG #1 with ECG #4 (obtained after PCI at the time of hospital discharge when the patient’s ECG is returning to its baseline state).
- As I expected — in the setting of LBBB, the widened all-positive QRS complexes in each of the inferior leads would typically be associated with inferior lead ST-T wave depression (which we now do see in ECG #4).
- Perhaps, the reason that only a small amount of ST elevation was initially seen in lead III of ECG #1 — is that the “starting point” of the ST segment in lead III was the ST-T wave depression (that we now see as this patient’s baseline in ECG #4).
- The “baseline” ST-T wave picture for leads V2,V3 in this patient’s LBBB is now seen in ECG #4 — which shows a more robust positive ST-T wave in lead V2, and loss of the completely flat ST segment in lead V3 that we saw in the initial ECG.
- Finally, in ECG #4 — the ST-T wave in lead V6 (and to a lesser extent in lead V5) now is oppositely directed to the all positive R wave in these lateral chest leads.
= = =
= = =