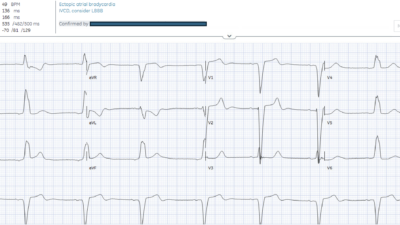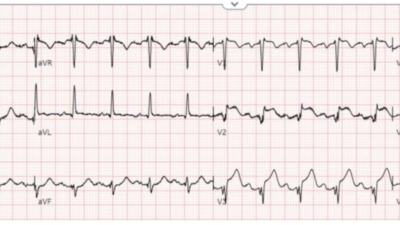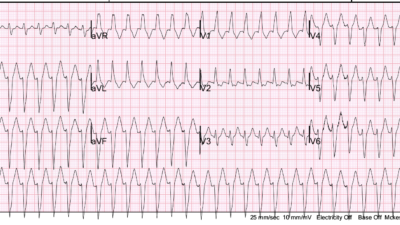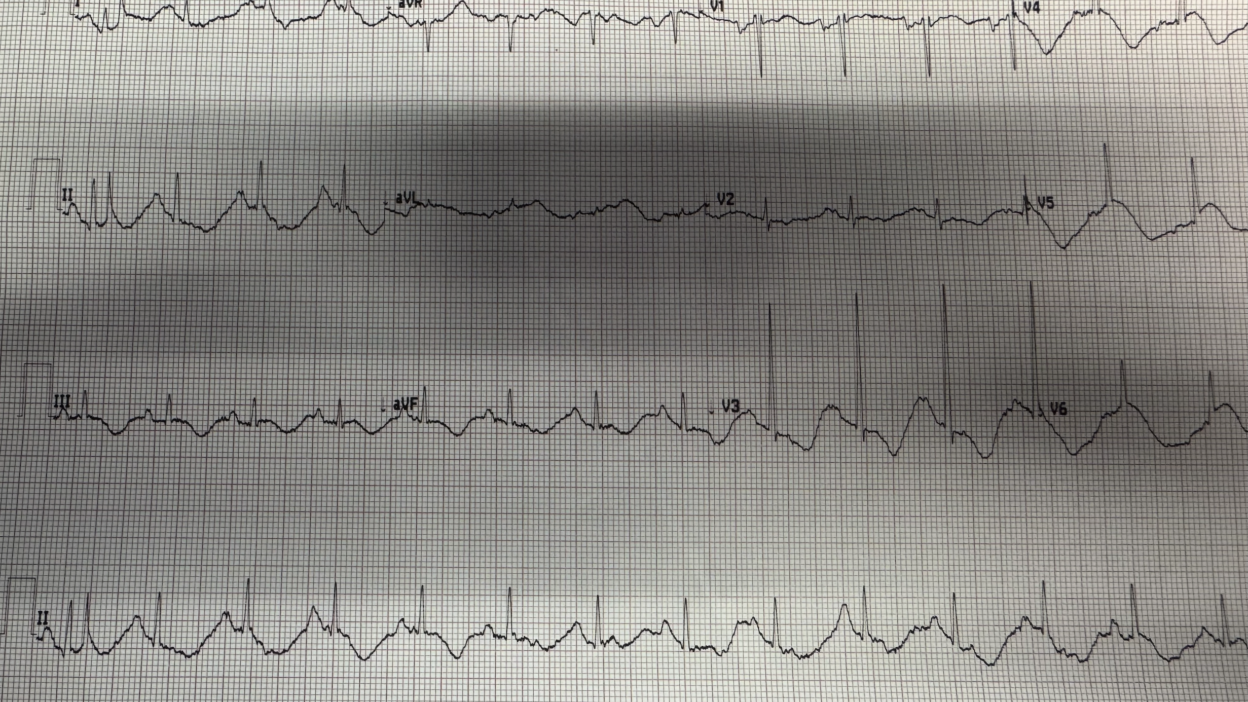
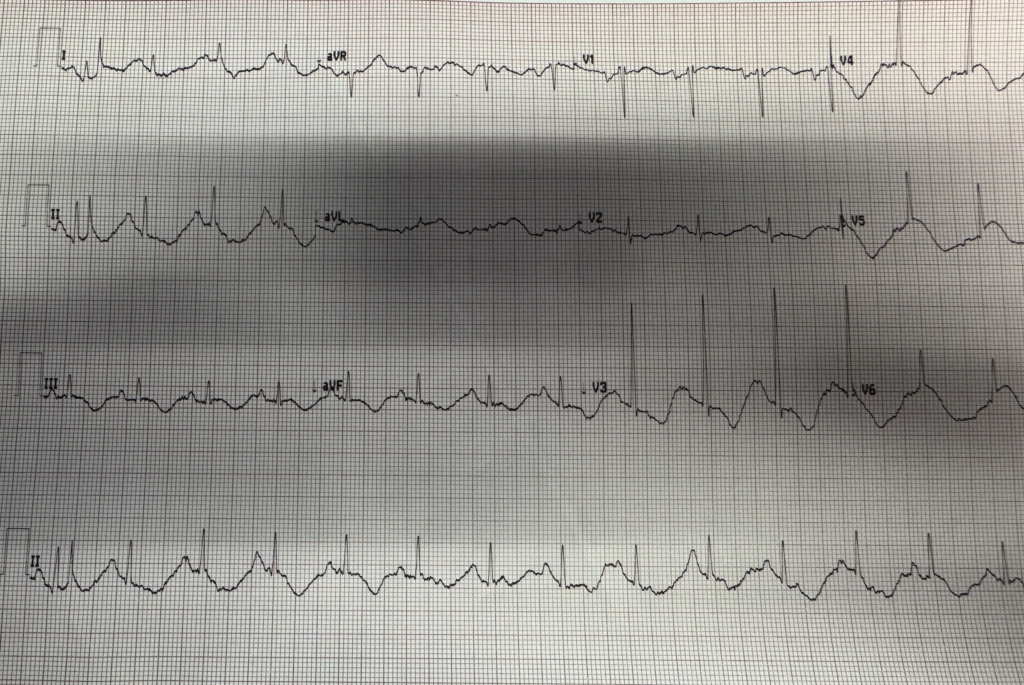
What do you think?
It looks very bizarre.
Differential:
1) Severe ischemia
2) arterial pulse tapping artifact (APTA) (but it is not APTA because none of leads I, II, III look completely normal),
3) takotsubo with very long QT and bizarre inverted T-waves.
See Ken’s detailed response at the bottom.
My response: K = 1.2 mEq/L. Whenever I see what I call a “wavy” pattern, as in this ECG, I think hypoK. In this ECG, it is really exaggerated, and so I guessed a very low K. Also: when the QT looks impossibly long, it is almost certainly a U wave. There is a massive U wave in lead V3. This is what we are seeing when we see the “wavy” pattern.
Answer: K = 1.6 mEq/L
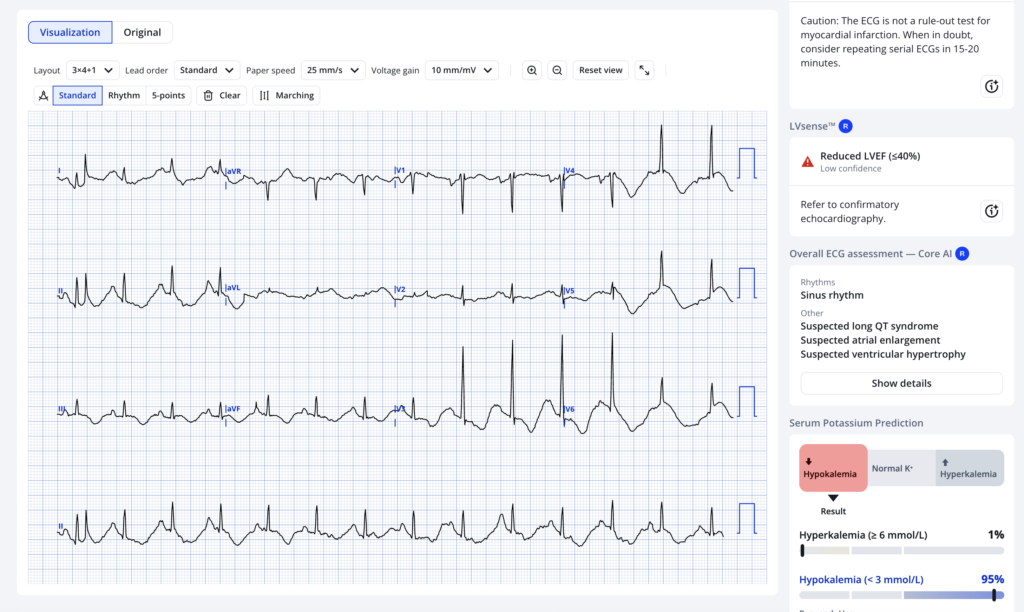
PMCardio Queen of Hearts AI Model has a new model called Karl which can diagnose hypo- or hyperK with very high accuracy.
Here is the output on this ECG:
= = =
==================================
MY Comment, by KEN GRAUER, MD (8/10/2026):
Credit to Dr. Smith for immediately recognizing severe hypokalemia in today’s tracing despite not being given any history.
- I fully acknowledge that I was not nearly as specific in my assessment.
- The point I would emphasize in My Comment — is that as long as we are systematic in our approach to ECG interpretation — we can still come up with a time-efficient interpretation that will lead us to the answer in timely fashion as soon as: i) We learn a little bit about the patient’s history; — and, ii) We get back some lab results.
= = =
A Systematic Approach to Today’s ECG …
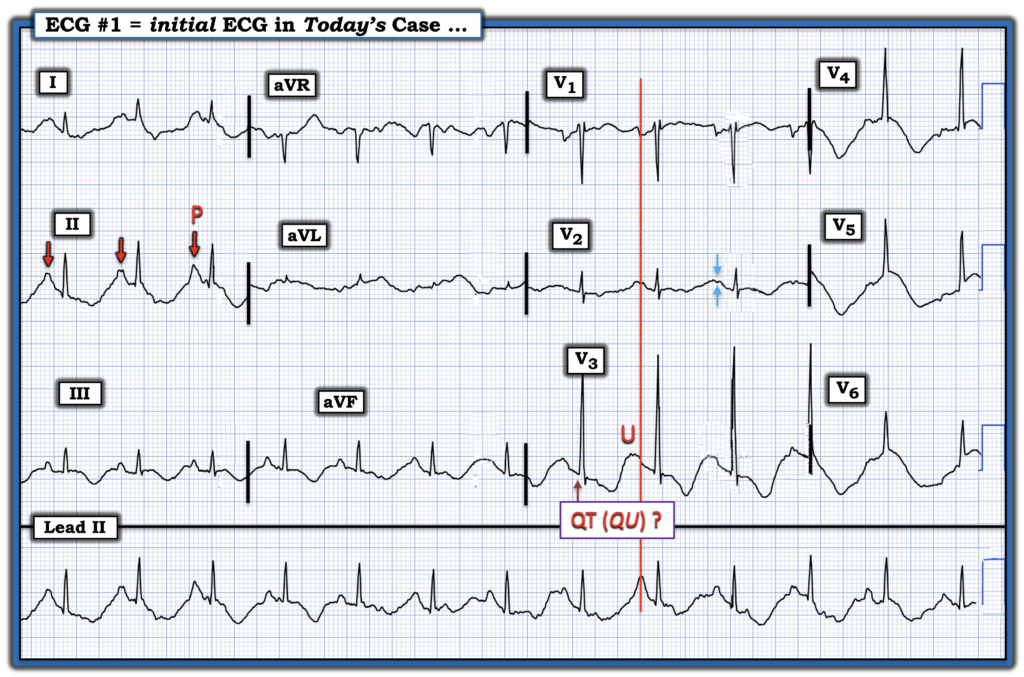
For clarity in Figure-1 — I’ve reproduced and labeled today’s tracing.
- There is much artifact and baseline wander on today’s ECG. This clearly makes interpretation more difficult. That said — We can still determine the Rate and Rhythm: Upright P waves with a fixed PR interval are seen in lead II (RED arrows in this lead) — and sinus P waves appear to be present throughout the long, artifact-ridden lead II rhythm strip. Therefore the rhythm is sinus at a rate of ~90/minute.
- Regarding Intervals — the PR interval is normal and the QRS is narrow. But the QT interval is long. If one was not systematic in our interpretation — it would be very easy to overlook the fact that the QTc is markedly prolonged — especially given all the artifact in this tracing.
- We know where the P waves are (RED arrows in lead II). The small, double BLUE arrows in lead V2 highlight what appears to be a double hump — which I interpreted as the dividing point between the end of a prominent U wave and the beginning of the P wave.
- I then dropped a vertical RED time line down through simultaneously-recorded leads V1,V2,V3 and the long lead II. Everything to the left of this vertical RED time line represents the ST segment + the T/U wave.
- I thought the BEST lead for visualizing U waves was lead V3. The “U” that I labeled in lead V3 reveals how giant this U wave truly is. It also reveals how markedly prolonged the QTc (or Q-U interval) turns out to be — as this interval takes up about 3/4 of the R-R interval!
- The frontal plane Axis is normal (approximately +50 degrees).
- Regarding Chamber Enlargement — I found the artifact-plagued P wave shape too variable to assess for atrial abnormality. And although traditional criteria for LVH aren’t present — the >25 mm R wave in lead V3 is clearly excessive.
- Finally — regarding Q–R–S–T Wave Changes: There are no significant Q waves — R wave progression shows early transition (with a predominant R wave already in lead V2 — plus an rSr’ complex in lead V1). But the main ST-T wave finding is deep T wave inversion in multiple leads.
To Emphasize: Although my above systematic assessment description must seem like it occurred in slow motion — with practice, systematic interpretation is accomplished in real time (ie, I do it in seconds).
- By being systematic — you are much less likely to miss important findings (How many of you picked up the long QTc and large U waves in this tracing?).
- Impression: Today’s ECG shows sinus rhythm — a very long QTc — large U waves — and deep T wave inversion in multiple leads.
= = =
Figure-1: I’ve labeled the ECG in today’s case. (To improve visualization — I’ve digitized the original ECG using PMcardio).
= = =
Putting It All Together:
There are a good number of clinical entities that may lead to the ECG findings of QTc prolongation — large U waves — and diffuse T wave inversion.
- My hunch is that IF we had a brief history on this patient — that we’d be able to figure out the most likely considerations. And because more than a single entity may be contributing — some basic labs are clearly indicated.
PEARL: Among the entities that may significantly lengthen the QTc are:
- Conduction defects (ie, RBBB, LBBB, IVCD).
- Ischemia/Infarction (Remember that Takotsubo Cardiomyopathy is notorious for QTc prolongation with diffuse ST-T wave abnormalities).
But the QRS in today’s tracing is not wide — so there is no conduction abnormality. And the history would surely clue us in if ischemia/infarction and/or Takotsubo were the cause.
In the absence of a conduction defect or ischemia/infarction — IF the QTc is clearly prolonged, consider this short LIST of 3 important entities:
- i) DRUGS (many drugs prolong the QT interval — and combinations of drugs may result in marked prolongation);
- ii) LYTES (ie, Think of low K+ and/or low Mg++ and/or low Ca++);
- iii) a CNS Catastrophe (ie, stroke, bleed, coma, seizure, trauma, brain tumor).
= = =
Today’s ANSWER:
As per Dr. Smith — today’s patient was found to have a dramatically lowered serum K+ = 1.2 mEq/L.
- This low K+ value is not at all surprising given the ECG findings of the markedly prolonged QTc (QU) interval and that huge U wave in V3.
- For more on the ECG findings of Hypokalemia — Check out My Comment at the bottom of the page in the May 9, 2020 post.
- Serum Mg++ and Ca++ also need to be followed given the common occurence of multiple (rather than single) electrolyte disorders.
- Whether or not the diffuse T wave inversion is strictly the result of hypokalemia would be forthcoming based on the history, how the patient does clinically, and whether ST-T waves return to a more normal appearance after correction of electrolyte depletion.
- In Conclusion: Dr. Smith’s amazing ECG interpretation ability, acquired over his decades of experience — allows him to regularly come up with near instantaneous accurate diagnoses. But we got there in the end through the above systematic approach to today’s case.
= = =
= = =