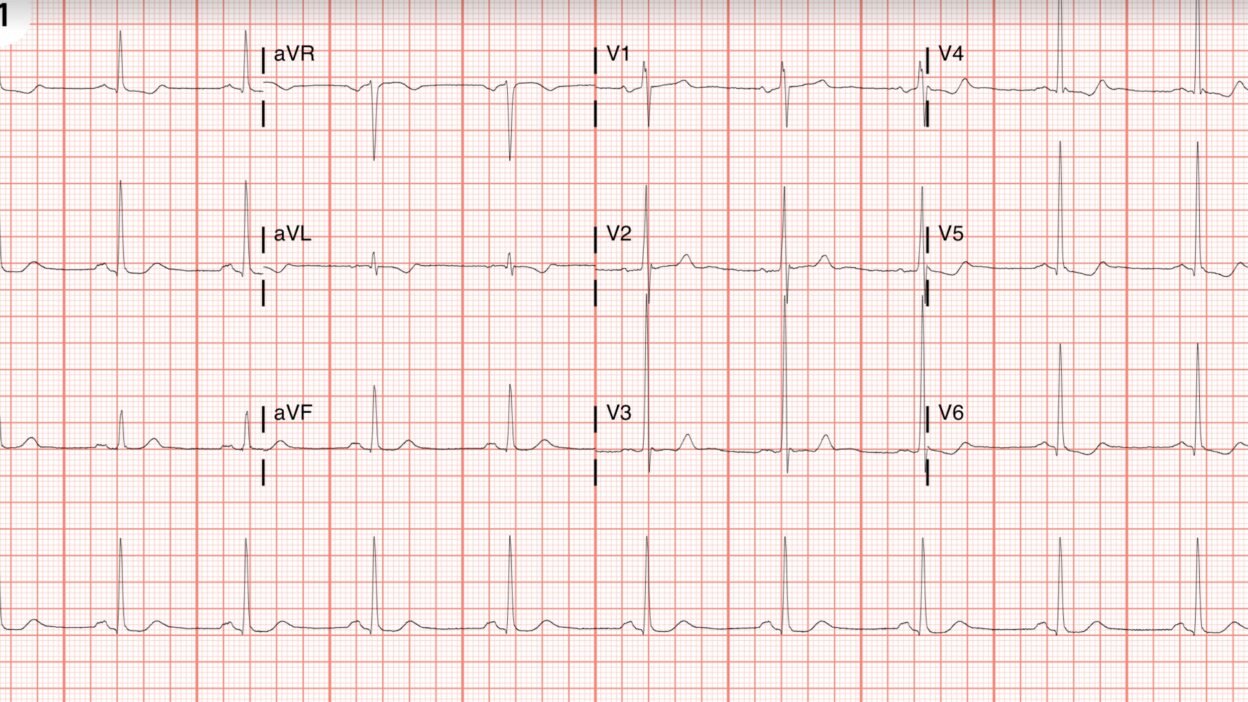
This comes from one of my recent residency graduates who is very good at EKGs.
A 52 year old male presented with chest pain.
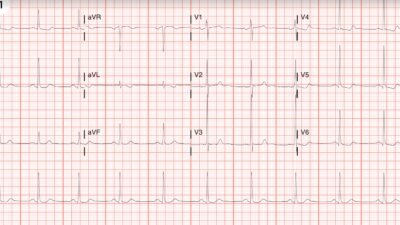
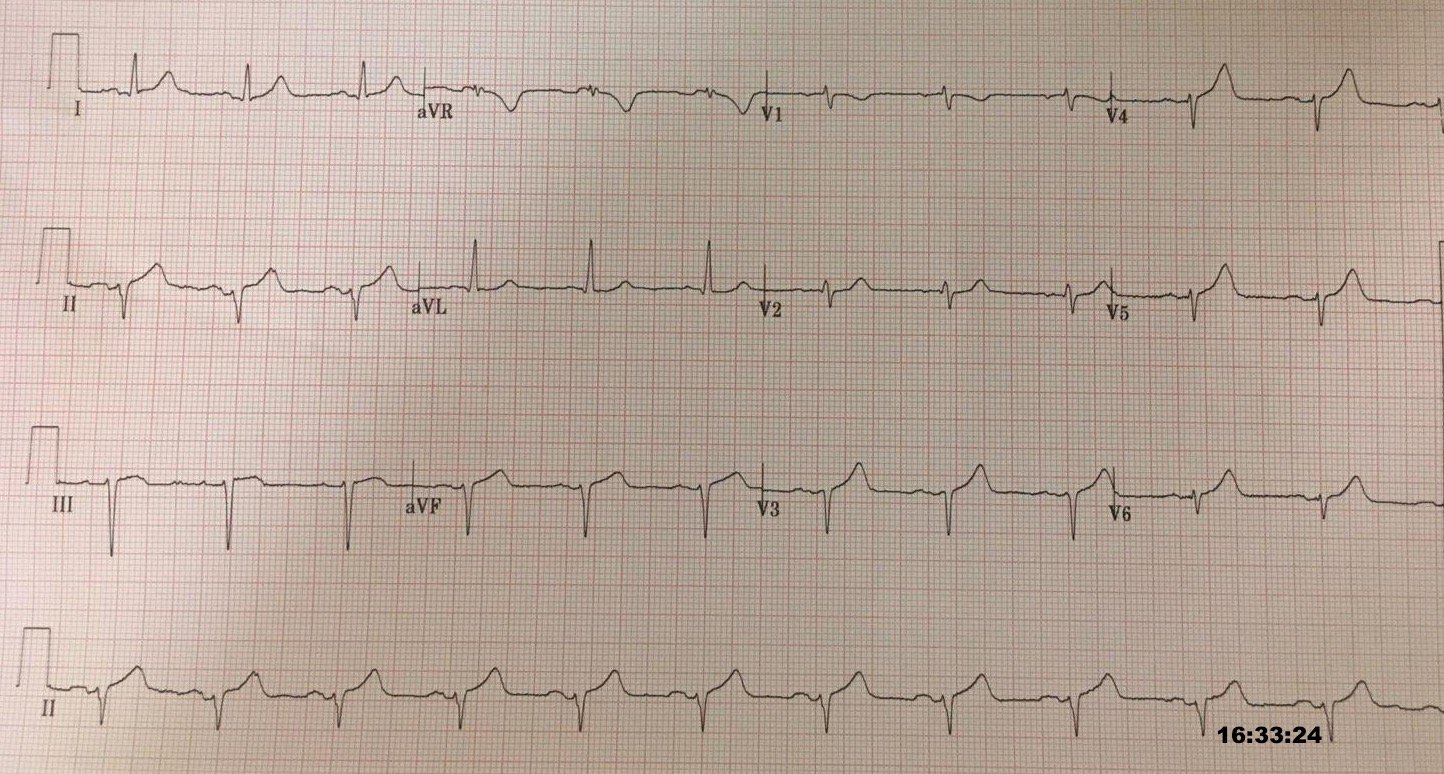
Here is the ECG:
— What do you think? —
= = =
= = =
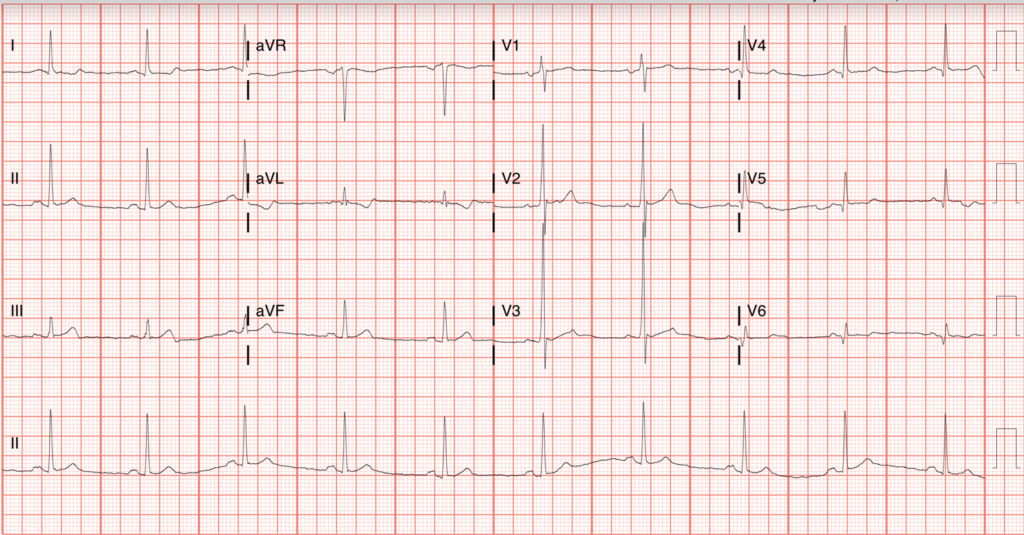
She thought it was inferior OMI. There is a hyperacute T-wave in lead III (with some terminal T-wave inversion), and a reciprocally inverted hyperacute T-wave in aVL (with terminally upright T-wave). There are Q-wave of old MI in the lateral leads.
She activated the cath lab. But cardiology said “It does not meet STEMI criteria.”
Many cardiologists say that “no cardiologist uses STEMI criteria.”
Here is the PMCardio Queen of Hearts AI Model on the first ECG (FDA approved):
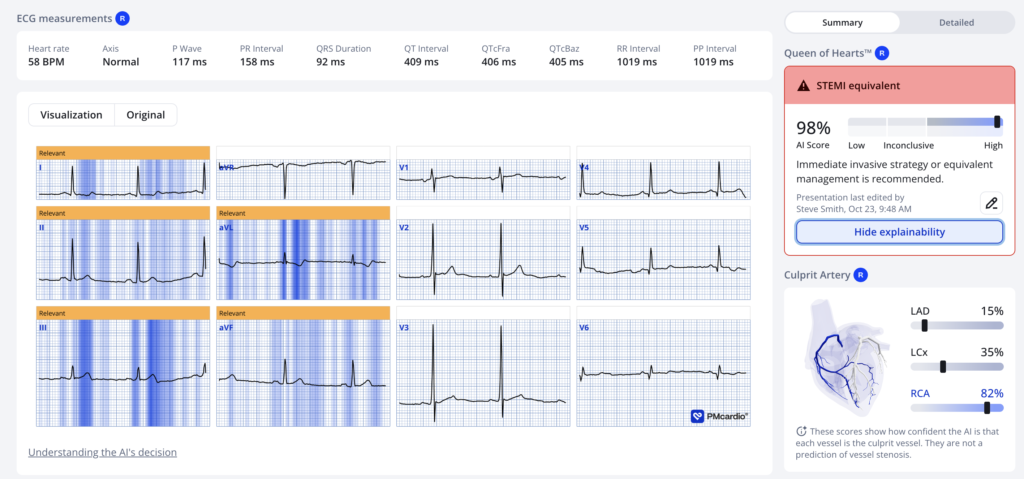
The cardiologist did not believe it. Cardiologist said: “Rule out other causes of chest pain. Try Nitroglycerine, etc.”
The first troponin returned at 10 ng/L (URL = 34 ng/L)
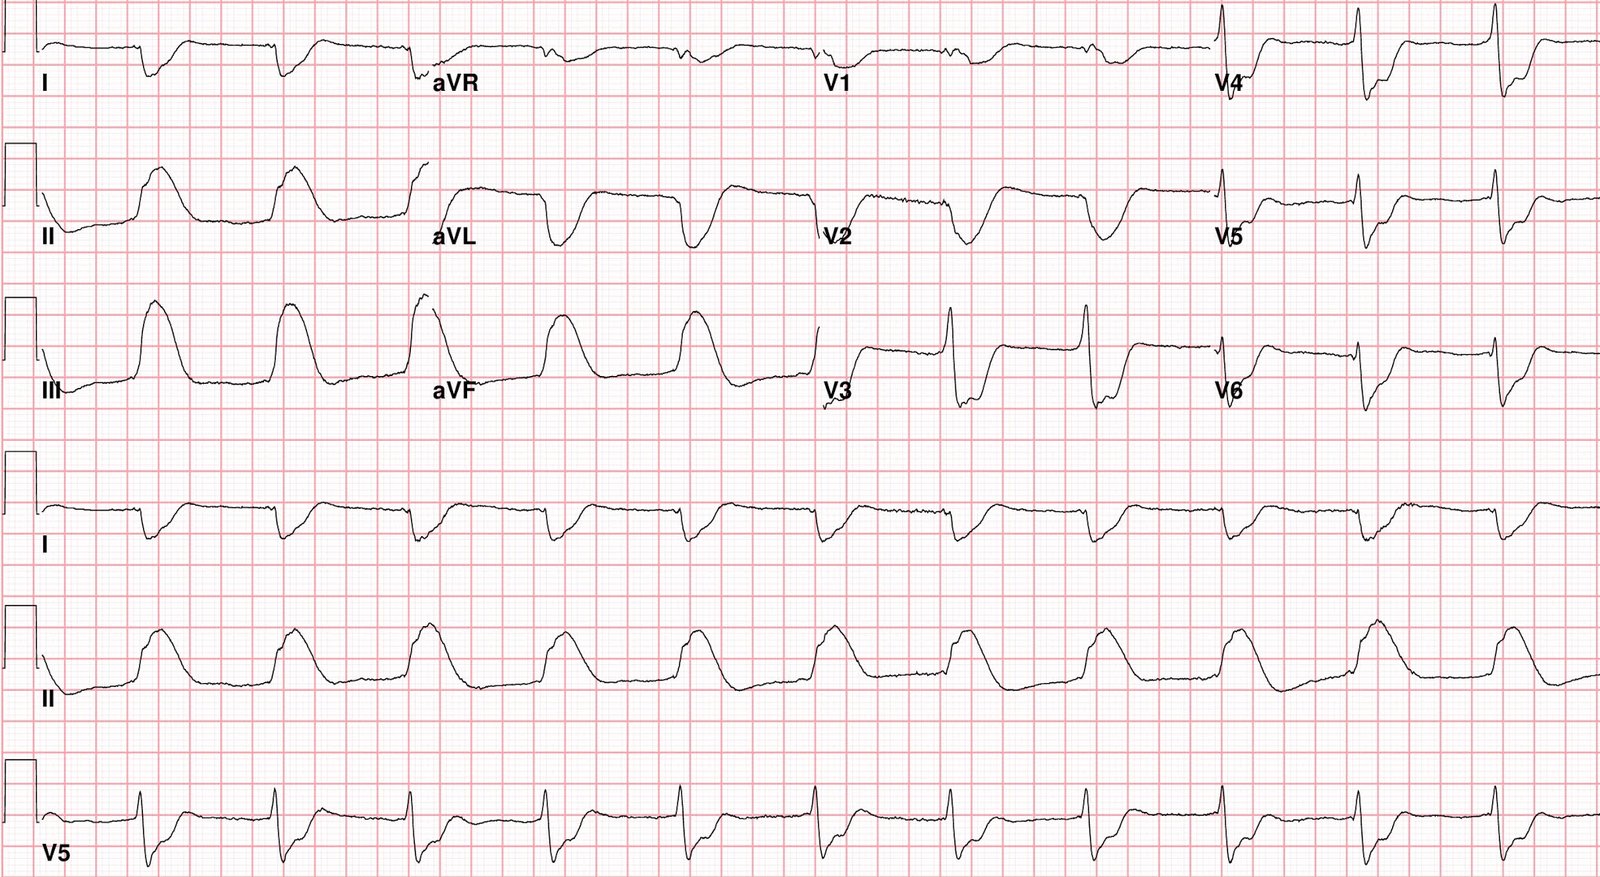
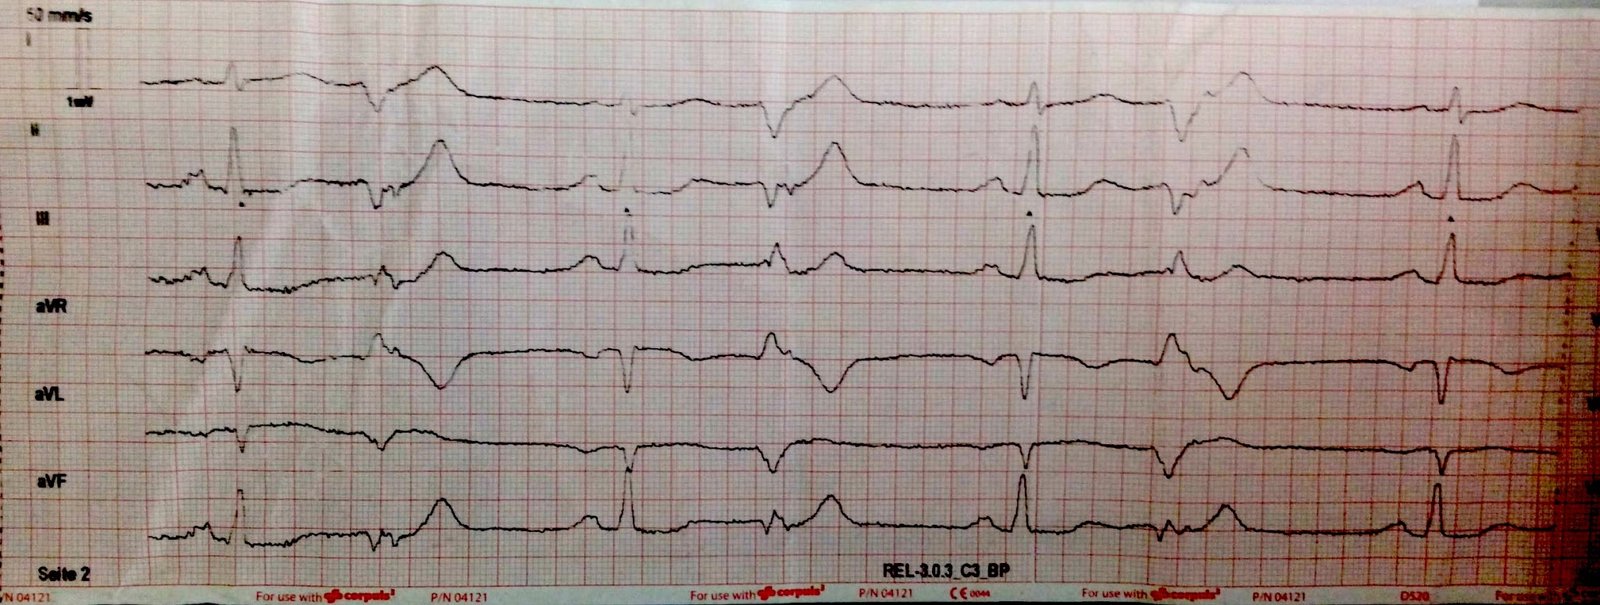
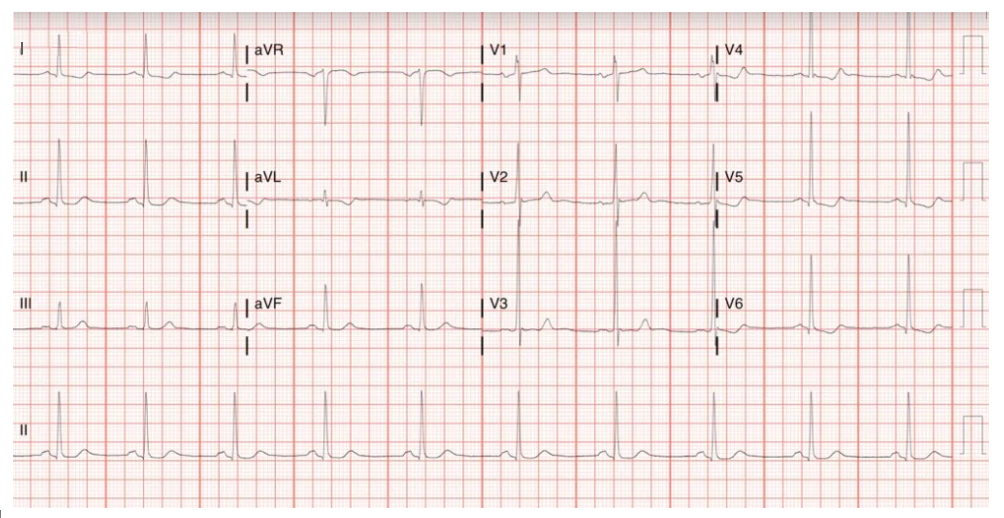
So she recorded another ECG (with the pain unchanged):
— What do you think? —
= = =
= = =
It is clearly dynamic AND still diagnostic of OMI, but on its own it is less diagnostic than the first one. Here is the Queen of Hearts again:
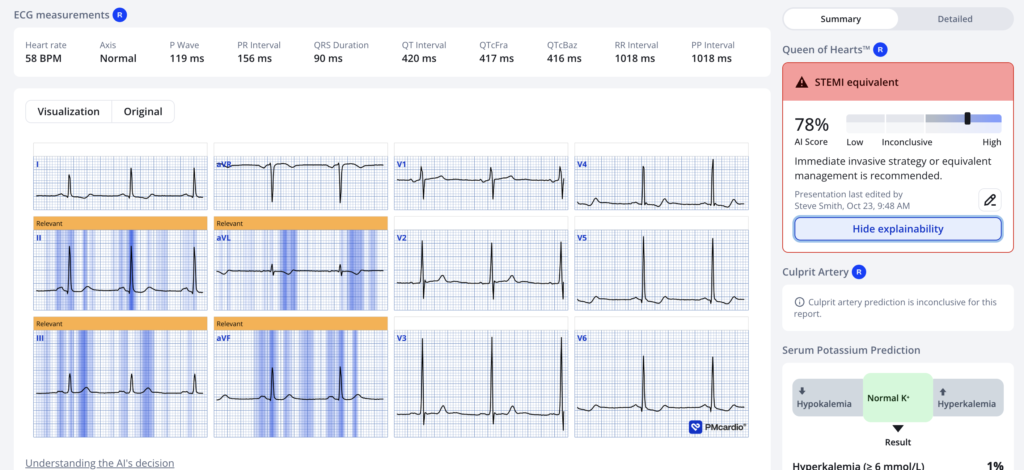
The Queen is less impressed (78%) but that is still very specific.
The cardiologist agreed to cath the patient.
There was a 99% RCA culprit that was stented, TIMI flow not mentioned. Peak troponin (Probably troponin I, not T) was in the 8000s ng/L. Patient left against medical advice, so further outcome not available.
= = =
= = =
======================================
MY Comment, by KEN GRAUER, MD (10/26/2026 ):
Today’s ECG is subtle. That said — To recognize subtle-but-real ECG abnormalities in a patient with new CP (Chest Pain), is to recognize an acute OMI that fails to satisfy STEMI criteria (and which otherwise would not receive PCI). And so it is with today’s challenging case.
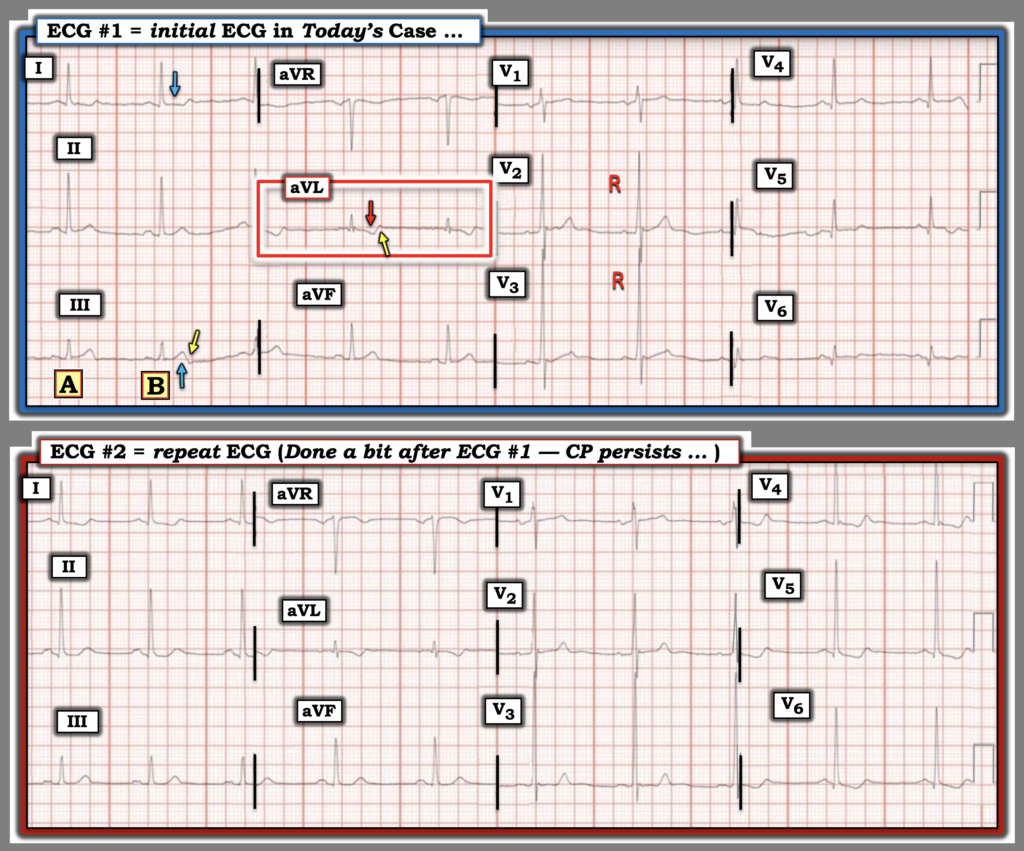
- To facilitate comparison between today’s 2 tracings, and to highlight the subtle changes in these ECGs — I’ve put both tracings together in Figure-1.
= = =
What are the Findings in ECG #1?
Looking first at the initial ECG — My “eye” was immediately drawn to the QRST complex in lead aVL — which in a patient with new CP, is the one lead on this tracing that I know is not normal.
- The inverted T wave in lead aVL is clearly disproportionately enlarged considering the tiny R wave in this lead (RED arrow in lead aVL). Whereas some T wave inversion may occasionally be normal in left-sided lead aVL when the frontal plane axis is vertically oriented — T wave inversion is not normal in lead aVL in association with the relatively horizontal frontal plane axis seen in ECG #1 (and certainly not normal given the increased “bulkiness” of the inverted T wave in lead aVL).
- In addition — the ST-T wave in lead aVL manifests a down-up shape (YELLOW arrow in aVL highlighting a small-but-definitely positive terminal deflection in the T wave). In a patient with new CP — this down-up T wave shape is highly suspicious of an acute event.
- That this finding of disproportionate T wave inversion with terminal T wave positivity in lead aVL is real — is supported by complex “B” in lead III, which shows the mirror-image opposite ST-T wave picture that we saw in lead aVL (ie, We see an up-down shape to the T wave — with terminal negativity highlighted by the YELLOW arrow in this lead).
- To emphasize that the terminal T wave negativity that we see for complex “B” in lead III is barely seen for complex “A” — so verification that this up-down shape is real and not artifact, would require seeing more than just these 2 complexes that we see in ECG #1.
- That said, the other high-lateral lead ( = lead I) — is not normal, because there definitely is ST segment flattening and a hint of ST depression (BLUE arrow in lead I).
- Bottom Line: In a patient with new CP — I thought the findings in these 3 limb leads (leads I, III, aVL) to be highly suspicious for acute OMI until proven otherwise.
- Finding a prior tracing on this patient could prove invaluable!
= = =
And then, there are the chest leads …
- R wave progression in the chest leads of ECG #1 is highly unusual. Not only does transition occur early — but the predominant R wave that we see already in lead V2 is more than 20 mm tall! This increases to a nearly 30 mm tall R wave by lead V3. Thereafter — R wave amplitude progressively decreases until reaching a low of a 3 mm R wave in lead V6. One has to wonder about potential precordial electrode lead misplacement …
- The validity (or lack thereof) of chest lead electrode placement is relevant clinically to our interpretation in today’s case. This is because suspicion of inferior OMI should always prompt us to look for potential signs of posterior OMI, which if present — would strengthen our suspicion of RCA occlusion. And, early transition with increased anterior lead R wave amplitude is one of the signs of posterior OMI.
- The above said — the highly unusual pattern of R wave progression seen here, with no more than nonspecific chest lead ST-T wave abnormalities looks more like a lead placement issue (or an unusual body habitus) than posterior OMI. Given that today’s patient is being evaluated for new CP — I would have wanted to immediately repeat ECG #1 (taking an extra moment to verify that chest lead placement is correct).
= = =
Figure-1: The 2 ECGs in today’s case.
= = =
The repeat ECG …
A bit later (some time after the 1st Troponin value returned) — the ECG was repeated. The patient’s CP was still present at the same intensity at the time this repeat ECG was recorded.
- I thought changes in the limb leads between ECG #1 and #2 were subtle-but-real. These changes included: i) More ST depression now in lead I, and new ST depression in lead II; — and, ii) Some deflating of the hyperacute T wave in lead III — and comparable deflating of the inverted T wave in lead aVL, with loss of the terminal T wave abnormality in these leads.
- NOTE: The chest leads in the repeat ECG look like they are from a different patient! Although the unusual QRS morphology with early transition and huge anterior R waves looks similar for leads V1,V2,V3 — there has been a dramatic increase in QRS amplitude for leads V4,V5,V6 (despite normal standardization on both tracings). I’m at a loss to explain this dramatic increase in lateral chest lead QRS amplitude beyond suspecting some form of technical misadventure?
- QRST morphology in the lateral chest leads of ECG #2 now clearly looks like LVH with “strain”.
- T wave peaking in lead V3 with prominence of terminal T wave positivity in the lateral chest leads make me wonder about the possibility of some spontaneous reperfusion at the time this repeat ECG was recorded.
- Bottom Line: Although questions remain regarding the differences between the 2 tracings in Figure-1 — there appears to be some element of dynamic ST-T wave change that (as per Dr. Smith) — supports the need to confirm the anatomy with prompt cath and presumptive PCI.
= = =
= = =