This was sent by a reader. He does a nice job of examining the whole case, so I leave it (mostly) in his words.
32 yo M Sudden onset localized, ‘sharp’ right sided chest pain for 1 hr. 7/10 at worst, now 4/10 with some radiation to both arms. no associated symptoms.
PMH – MS, Cholesterol, Smoker.
FH – Father MI 45
Obs – BP 133/83, RR 20, Sats 95%, examination unremarkable. Bloods pending.
Reader’s interpretation:
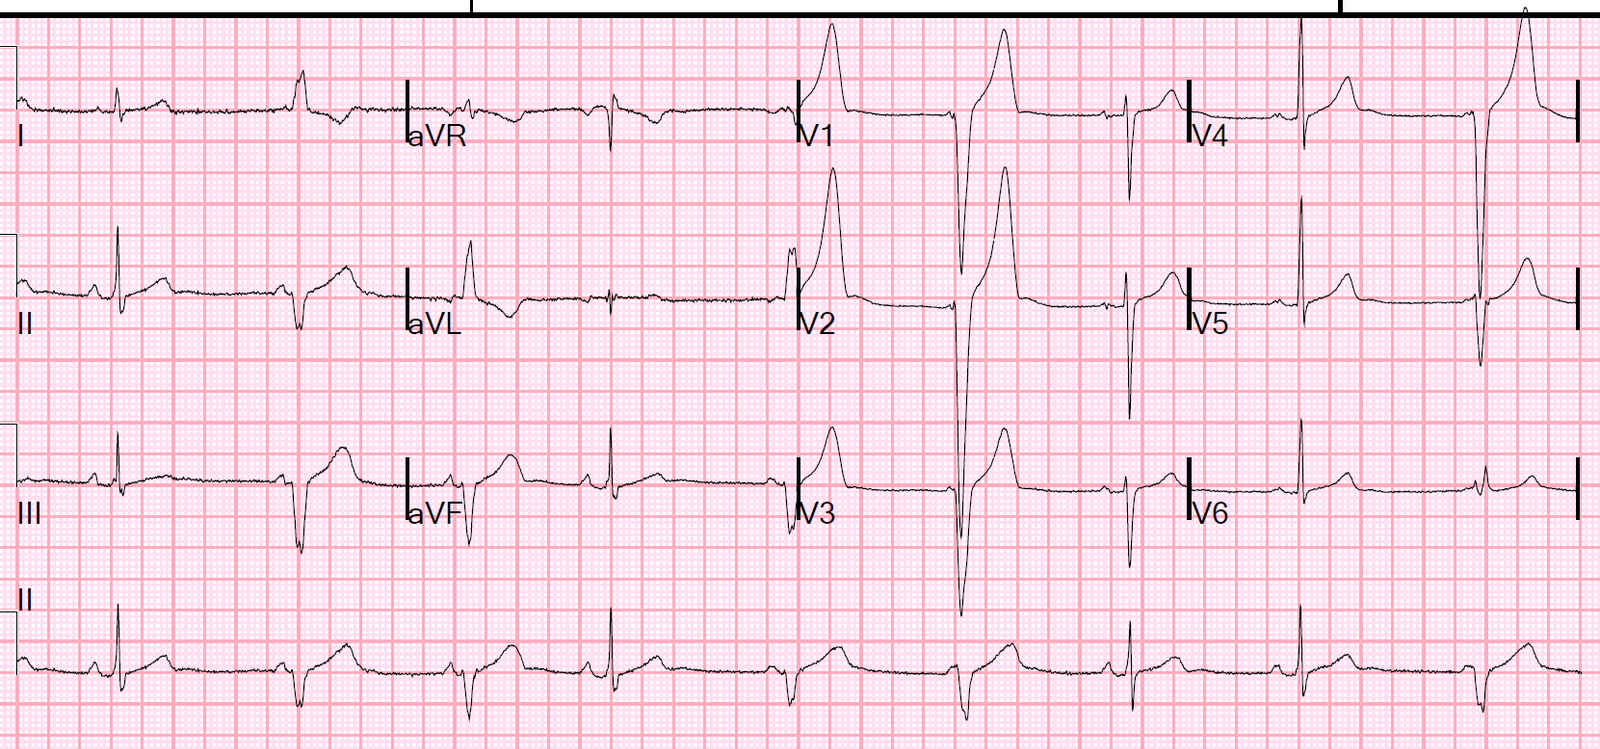
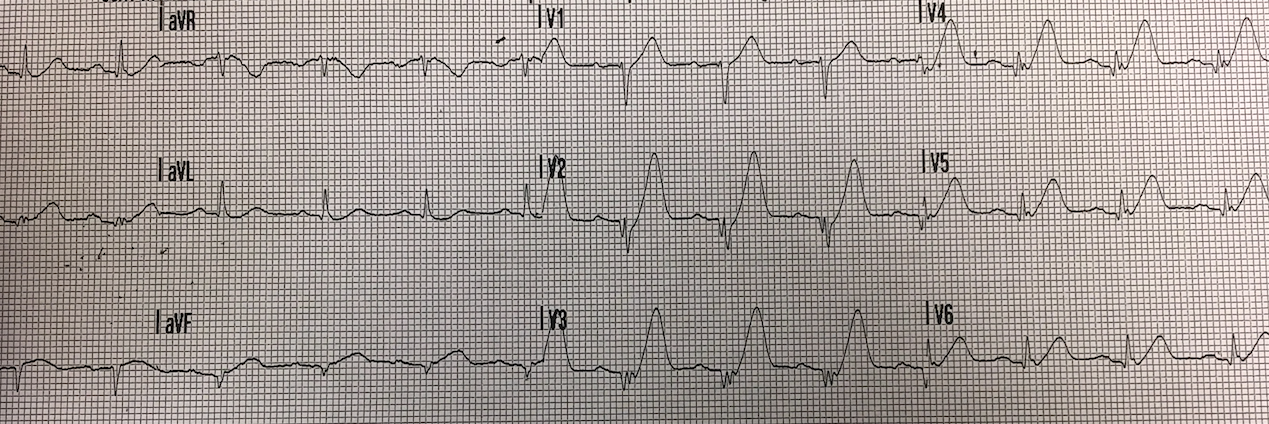
ECG 1
Sinus rhythm approx 65bpm
normal axis
non-specific inter-ventricular conduction delay (IVCD) versus incomplete RBBB. QRS 100ms
Subtle ‘sagging’ ST depression I, aVL, V6. no ST elevation
Very tall anterior T waves V1-5 that are symmetrical and disproportionately large (particularly in V4) but neither very peaked or blunted.
The QTc is normal to short, around 400ms
The R wave progression is slow with potential pathological Q waves V3, I, aVL
Reader’s comment:
Although I felt the anterior T waves may be hyperacute suggesting a STEMI equivalent (OMI) I did not feel this was diagnostic at the time. Given the atypical pain and well looking patient the initial plan was serial ECGs, CXR, morphine and review with initial bloods in an hour. Not for lab unless evolving ST elevation. This plan was agreed with the on call cardiology registrar.
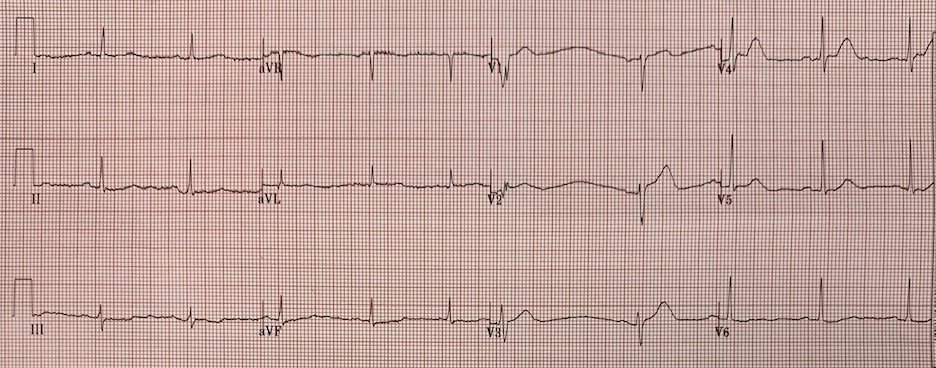
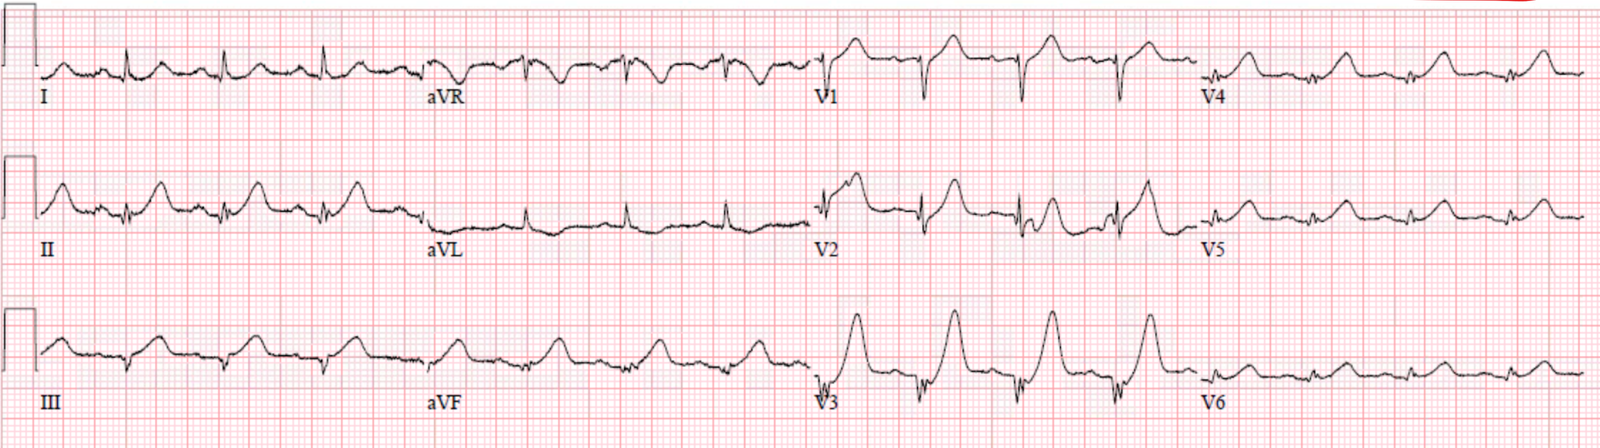
This was recorded shortly later, (The reader does not give the exact timing):

Reader’s interpretation
Overall very similar to the first trace.
There is a reduction in the T wave amplitude and T wave in version in aVL.
There is reduced R wave amplitude in V3 and a new narrow Q wave in V4.
There is perhaps 0.5-1mm ST elevation in V1 only.
I felt these changes were due to chest lead positioning, V1-2 were placed too high for the initial ECG.
Clinical course
Subsequent ECGs over the next 2 hours were similar. The patient looked well and the pain was now a mild ache 1/10 (Smith comment: because of the morphine?). The CXR was unremarkable as were bloods except high sensitivity Troponin I at 110 ng/L (99th percentile 34 ng/L). (Smith comment: this is diagnostic of acute MI, and even with a negative ECG, is reason to activate the cath lab if there is ongoing pain, which of course morphine might eliminate)
I treated him as an NSTEMI with Clopidogrel (already loaded with aspirin), Fondaparinux and commenced atorvastatin and bisoprolol. He was admitted directly to the cardiac ward and placed on telemetry.
When I returned to check on him later in the night shift the patient was sleeping and there were no further ECGs to review.
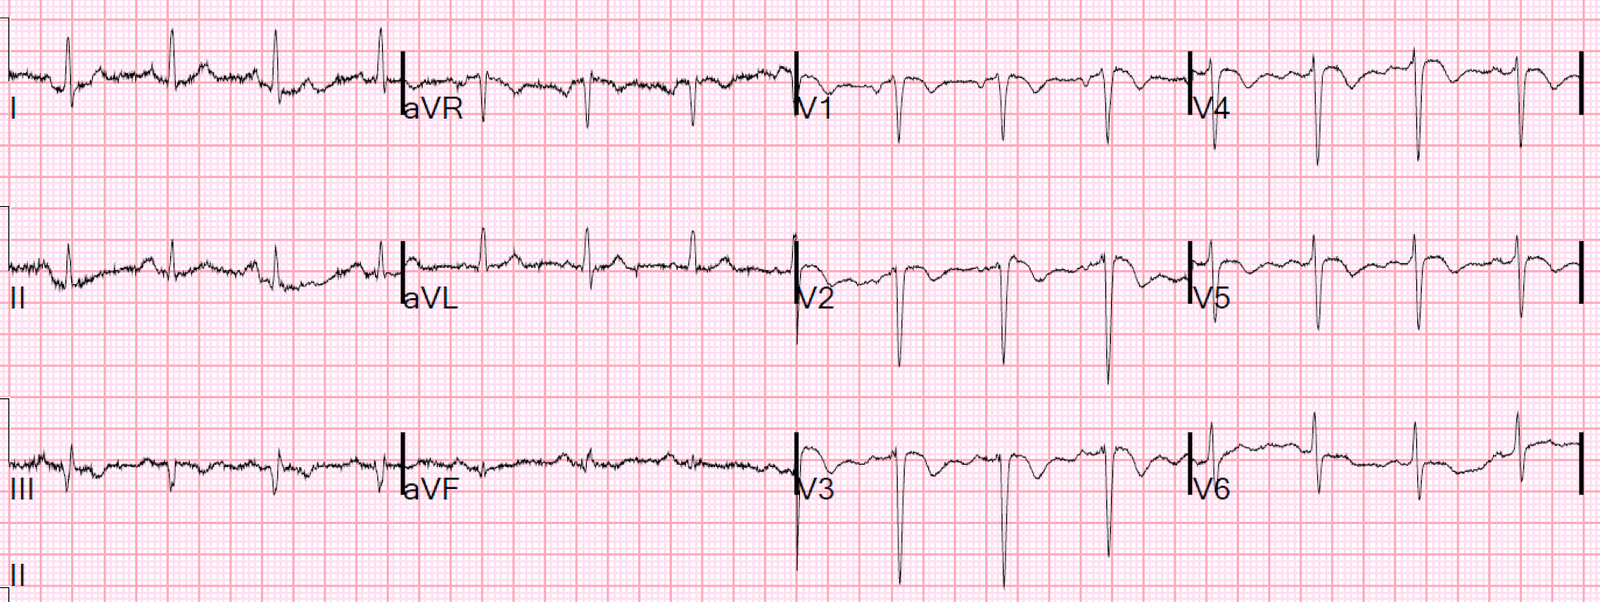
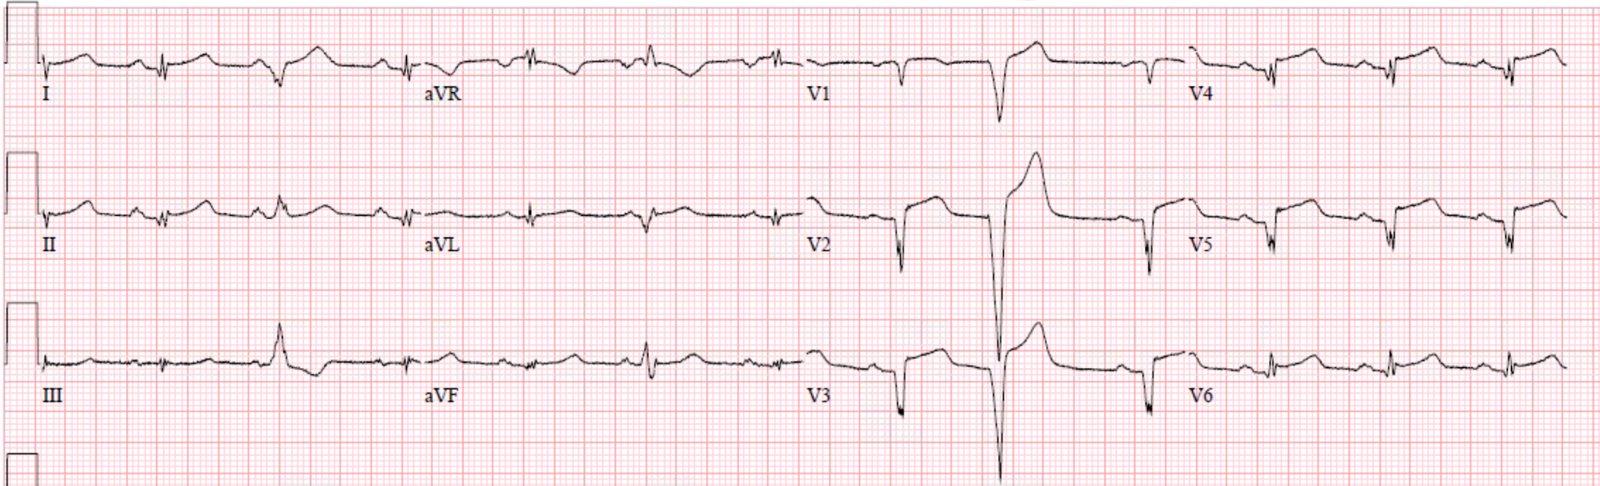
The following morning the ECG below was recorded. This shows QS complexes throughout the anterolateral leads that suggests a completed extensive anterior STEMI. Repeat Troponin was greater than 10,000 ng/L (large MI, we do not have the peak)

Angiogram
The patient was taken to the lab and a total occlusion of the mid LAD (after a large diagonal) was treated successfully with PCI and stenting. There was also bystander disease and a staged PCI to the proximal RCA was planned. The patient did well and was discharged without significant LV dysfunction or other complications.
Discussion
In hindsight I feel there are very few alternative causes for an ECG like this other than an acute LAD occlusion. I believe this is one of those ‘subtle STEMI’ cases where neither the ECG nor the symptoms are very obvious or severe and the usual evolution is not seen.
I think of these cases as ‘insidious infarcts’ and I have seen this in all infarct territories and I do not think they are particularly rare. Essentially the patient is fairly comfortable and the ECG is not obvious but the patient ended up with Q waves, huge troponins and we missed the opportunity to reperfuse the artery when it counts. These patients tend to be younger and do well but I have no doubt that their future risk of heart failure, arrhythmias and premature death is greatly increased compared to if they had PPCI and standard STEMI treatment. Needless to say cases like this have had a significant impact on me and make me strive to be better at spotting subtle ECG patterns and advocating for patients like this having emergent angios.
What could have been done differently.
Applying Smith’s subtle anterior STEMI v early repolarisation (4 variable) equation to the first ECG gives a score of 20.6 suggesting STEMI (> 18.2). Although this is arguably outside it’s indications as there is a fairly clear Q wave in V3 (note there are lots of exclusions for using this equation). (Smith comment: if exclusions are there because they are indicative of acute LAD occlusion. If any one of the 8 are present, it is LAD occlusion until proven otherwise. Here is a link to use of the formula).
A bedside echo (especially with speckle tracking if available) may have helped if there were regional wall motion abnormalities.
Continuous 12 lead monitoring may have also helped.
FOAM resources that promote recognition and early treatment of ‘STEMI equivalent’ patterns are promoted by Stephen Smith and Pendell Meyers. This is summed up in their proposed OMI/NOMI terminology to replace STEMI/NSTEMI.
https://emcrit.org/emcrit/omi-
http://hqmeded-ecg.blogspot.
Links for the anterior STEMI v early repolarisation equation below.
http://hqmeded-ecg.blogspot.
https://www.ncbi.nlm.nih.gov/
https://www.mdcalc.com/subtle-
https://apps.apple.com/us/app/
https://play.google.com/store/
Smith comment:
1. Morphine should never be given until you are committed to the cath lab. Pain was 1/10 probably due to morphine.
2. One must learn how to recognize hyperacute T-waves. These ones are the real thing and cannot be anything else. The first ECG is absolutely diagnostic of acute LAD occlusion and the cath lab should be activated immediately.
3. Young people do have MI!!
Here are 2 recent cases that are similar:
Case 2. This patient was brought by EMS. The hyperacute T-waves were immediately recognized by the medics and the patient went expeditiously to the cath lab. 1972765.
 |
| Diagnostic hyperacute T-waves in V2-V5Even the small ones are hyperacute, as they are huge in proportion to the QRS and they are “Fat” and symmetric. |
This was the patients ED ECG:
 |
| Again, diagnostic hyperacute T-waves in V1-V5. |
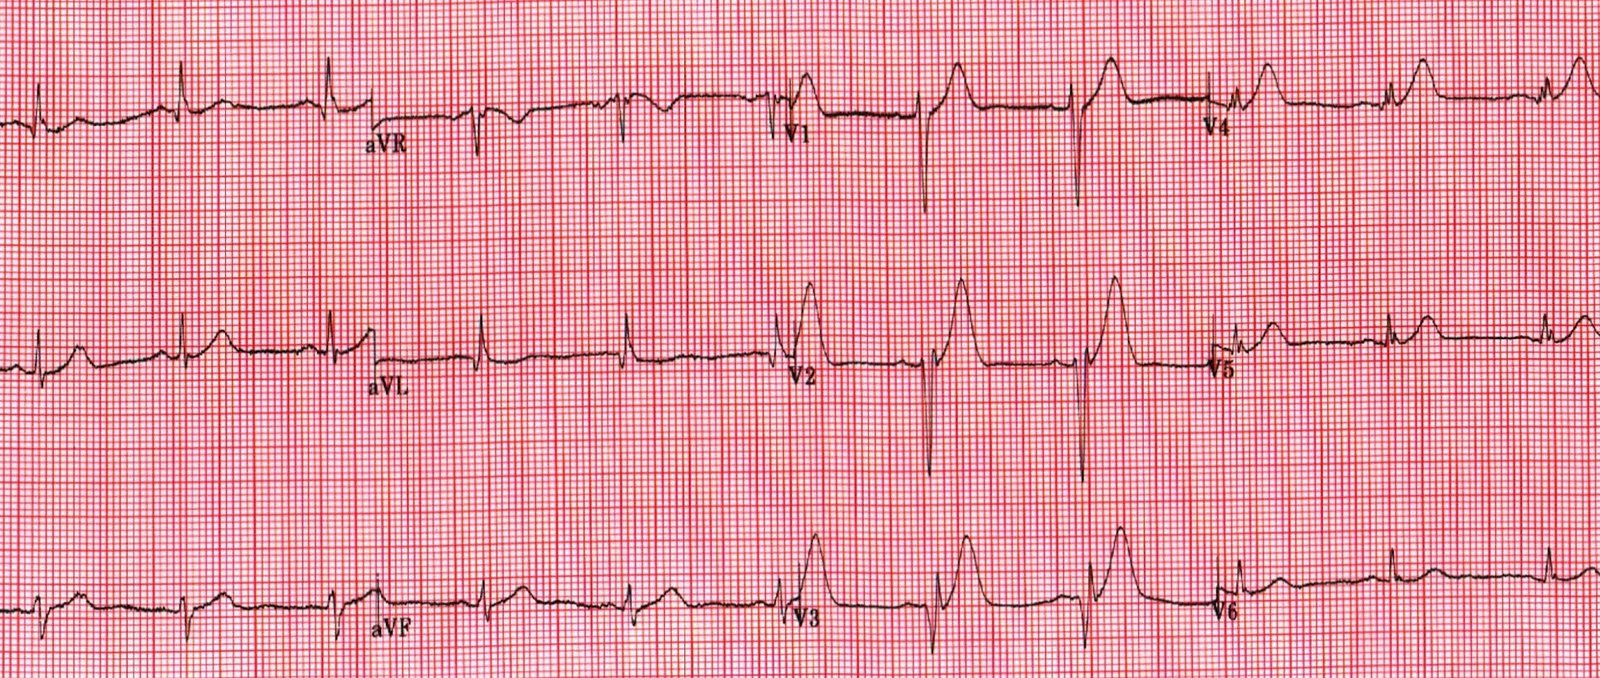
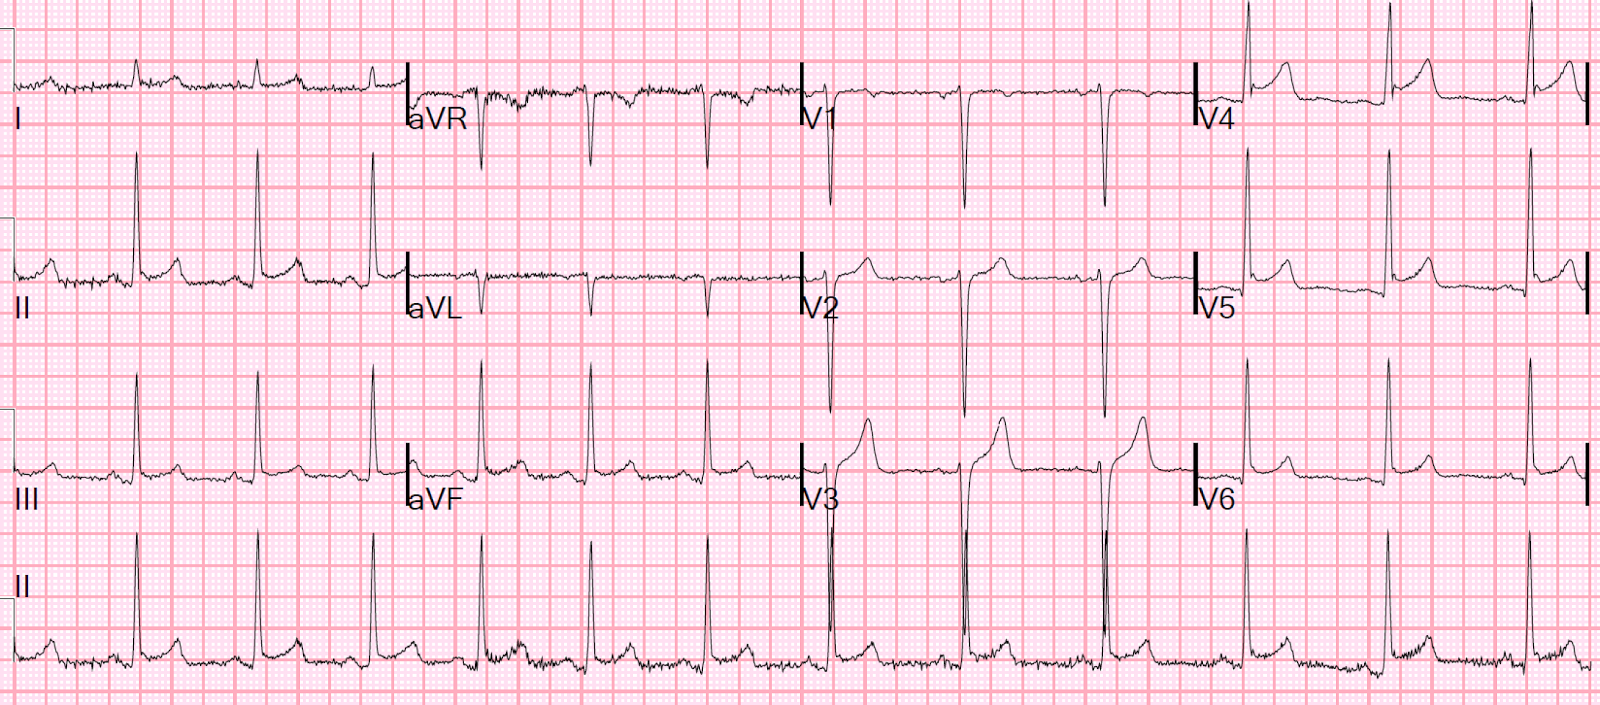
Case 3. Here is a case that was diagnosed and treated immediately, but the myocardium was completely infarcted anyway, without ever developing any ST elevation.
Prehospital ECG:
 |
| de Winter’s T-waves in V2 Hyperacute in V1-V6, II and aVF They are symmetric and fat, and also tall. They tower over the QRS. The T-wave in V6 is not at all large in any absolute sense, but it is huge in proportion to the QRS. |
Here is the ED EDG:
 |
| de Winter’s T-waves in V3, hyperacute from V1-V6. |
And the post-reperfusion ECG:
 |
| Notice: Even though there was never ST Elevation, and the patient underwent rapid reperfusion, there are fully developed QS-waves, indicative of profound anterior wall infarction. |
Furthermore, a hyperacute T-wave need not be large, or even proportionally large: Sometimes a hyperacute T-wave is only symmetric, but not large, as Case 3 below:
Case 3.
Small T-waves that are hyperacute just because they are symmetric.
 |
| The T-waves in II, III, and aVF are hyperacute only because of their symmetry.
I recognized these hyperacute T-waves immediately as part of a study we are doing. No one else saw them at all. Another clue is of course the slight STD with T-wave inversion in aVL. |
Here is the post reperfusion ECG:

Here is how normal assymetric inferior T-waves look:
Hyperacute T-waves:
Ten (10) Examples of Hyperacute T-waves in Lead V2 (a few in V3), due to acute LAD occlusion
10 Cases of Inferior Hyperacute T-waves
Ten cases of hyperacute T-waves in V4-V6
Hyperacute T-waves “On the way down”
Here are 44 cases with hyperacute T-waves:
![]()
===================================
MY Comment by KEN GRAUER, MD (2/18/2020):
===================================
Our most sincere THANKS to the reader who submitted this case. CREDIT to him/her — for his/her soul-searching account! Hindsight is always much easier in the “retrospectoscope”. I’ll focus my comments on a few additional thoughts to those made by Dr. Smith.
- For clarity — I’ve reproduced and labeled the first 2 ECGs in this case in Figure-1.
 |
| Figure-1: The first 2 ECGs that were shown above in this case (See text). |
MY THOUGHTS on this Case — Although the patient in this case is young (32yo) — he is a smoker — his family history is worrisome (father with MI at age 45) — and, his symptoms are new, and these new symptoms led to presentation in the ED.
- Especially when there are concerning features in the history — The onus has to be on us to rule out (rather than to rule in) the possibility of an acute cardiac event. As a result — IF the initial ECG is not normal, we need to prove that the ECG abnormalities are not acute (rather than the other way around).
- IF in doubt after evaluating the patient the best you can — Err on the side of caution. Better to cath a patient who doesn’t need it — than not to cath someone who does.
Regarding ECG #1 — The reader was systematic in their interpretation, and he/she identified the main abnormal findings. LOOKING CLOSER at ECG #1:
- In the limb leads — larger and wider-than-expected Q waves are present in leads I and aVL. That said, I wasn’t convinced these limb lead Q waves were significant to the case at hand — and I thought overall ST-T wave changes in the limb leads of ECG #1 were nonspecific.
- NOT SO in the chest leads. Starting from a definite R wave in lead V1 (3 mm in amplitude) — there is Loss of R wave from V1-to-V2. That this is real-until-proven-otherwise, is supported by the very wide and deep Q wave in lead V3 (BLUE arrow) This suggests anterior MI has occurred at some point in time.
- The reader correctly identified, “very tall anterior T waves in V1-thru-V5 that are symmetrical and disproportionately large (particularly in lead V4)”. In a patient with new symptoms — especially in association with loss of R wave + the very-large-and-wide Q wave in lead V3 — this description by the reader is how I would define hyperacute anterior T waves.
- I would add that T waves are fatter-than-they-should-be at their peak (at least in leads V1, V4 and V5) — and, that these T waves are wider-than-they-should-be at their base (at least in leads V1, V3, V4 and V5) — therefore, clearly to be assumed hyperacute in a patient with new symptoms until proven otherwise.
Regarding ECG #2 — We are not told how much time passed between the recording of ECGs #1 and #2. The important point, is that although subtle — there has been serial change between these 2 tracings.
- I thought there was no significant change in the limb leads between ECGs #1 and #2.
- BUT — there has been further loss of anterior forces — seen as development of a very wide-and-deep Q wave in lead V2 + a Q wave in lead V4 (RED arrows in ECG #2 denoting Q waves).
- As noted by the reader — T wave amplitude has indeed decreased in multiple leads (ie, the T wave is not as tall in ECG #2 as it was in ECG #1 in leads V1, V2, V3 and V4). Further support that this decrease in T wave amplitude represents a dynamic ST-T wave change — is provided by the unusual short segment of ST straightening that we see in lead V1 (PURPLE arrow) — which replaces the upward-sloping ST segment that we previously saw in lead V1 of ECG #1. This is not artifact. It is real.
- NOTE: While true that there is now a small negative component to the P wave in leads V1 and V2 of ECG #2 that was not present in ECG #1 — one can not attribute all of the dynamic ST-T changes just described (that occurred in each of the first 4 chest leads) simply to positioning 2 leads (ie, V1,V2) too high on the chest. IF thought that these differences between ECGs #1 and 2 were simply due to lead malposition — then ECG #2 should have been immediately repeated after verifying chest lead placement. This clinical point is important — since IF questions persisted as to whether ECG findings were or were not acutely evolving — demonstration of dynamic ST-T wave change proves that they are.
BOTTOM LINE — Soul-searching cases is TOUGH. But it is an invaluable part of optimizing future treatment. We are indebted to the reader who shared this case with us — so that we can all learn from it.
![]()