A 20-something woman presented with 30 minutes of sudden onset chest pressure that started while in the bathroom. She had no relief from nitro x1. ASA 325 given by EMS.
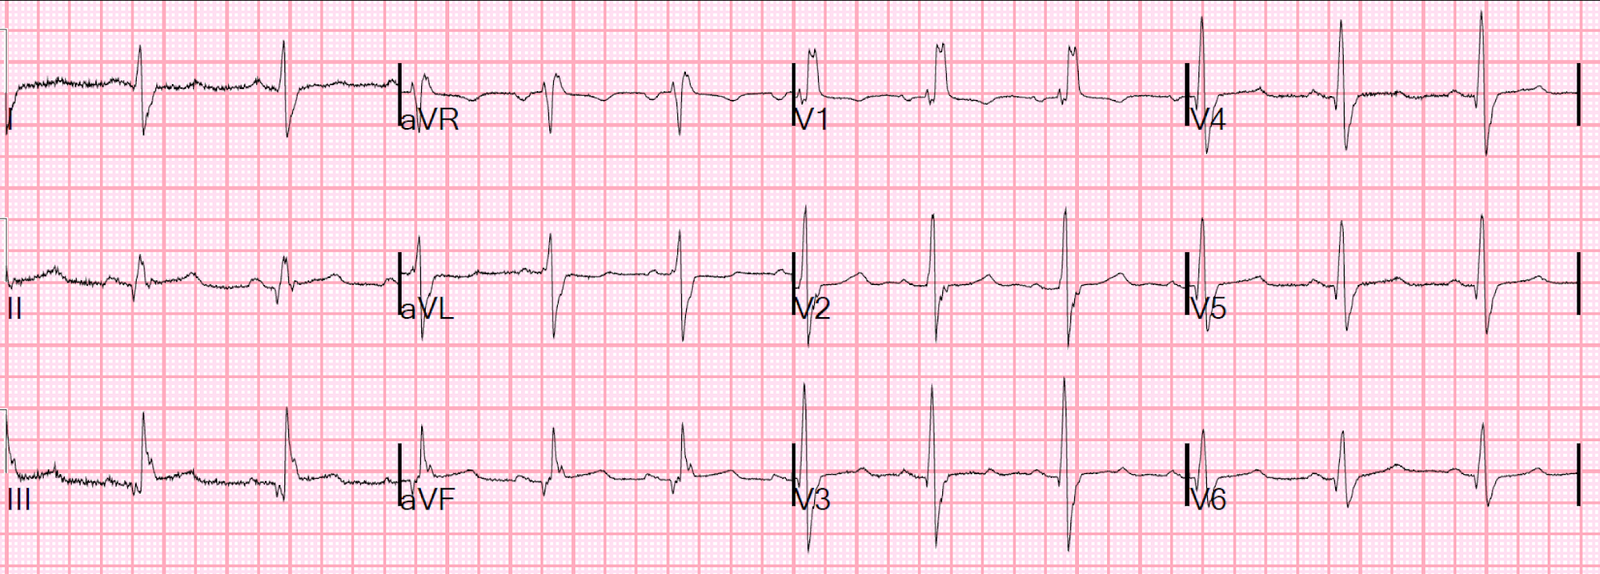
Here is her prehospital ECG:
 |
| What do you think? |
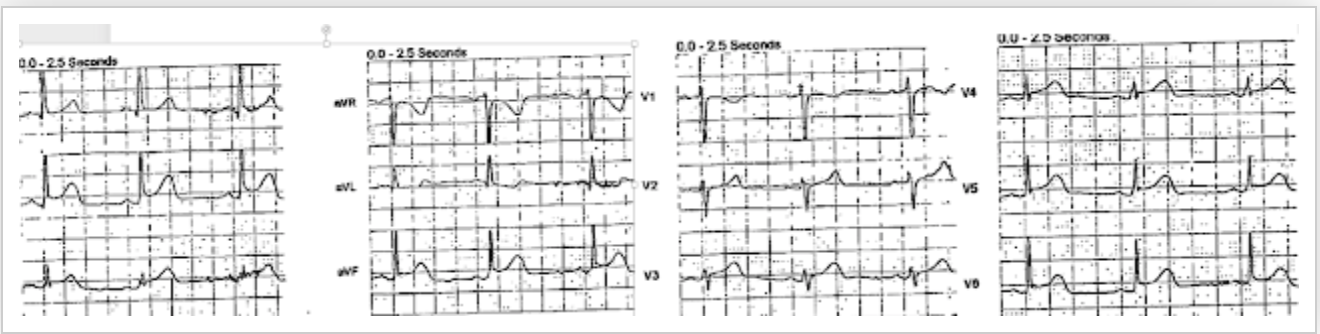
Here are limb leads magnified:
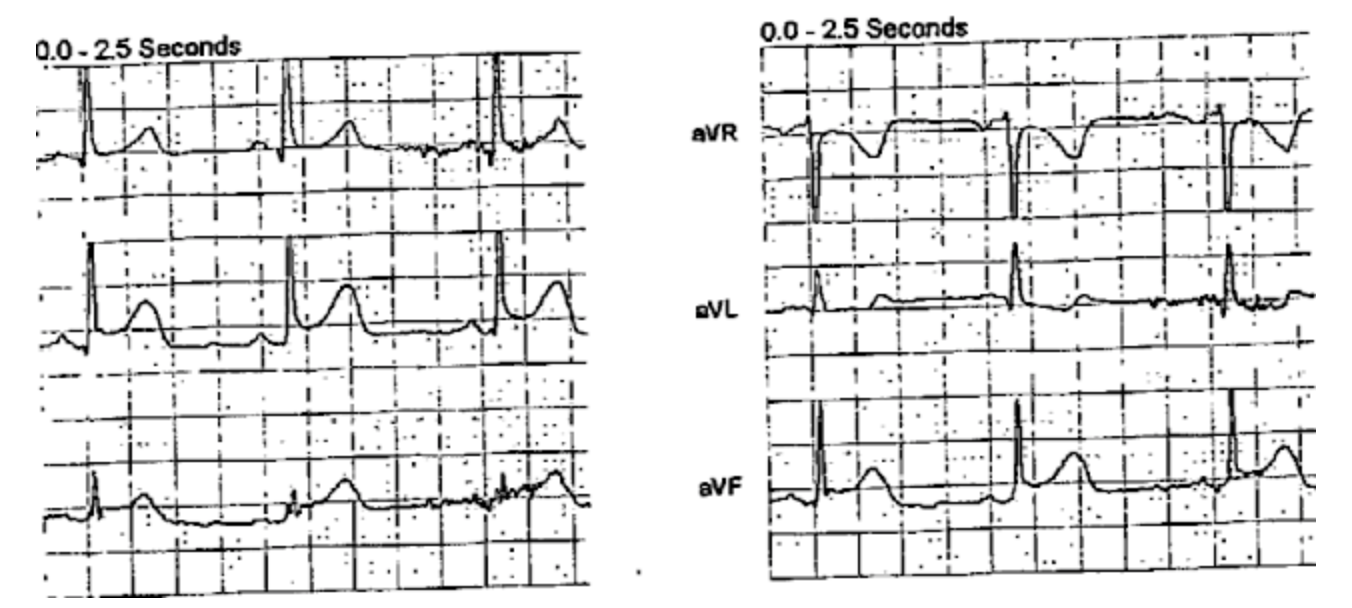 |
Precordial leads magnified:
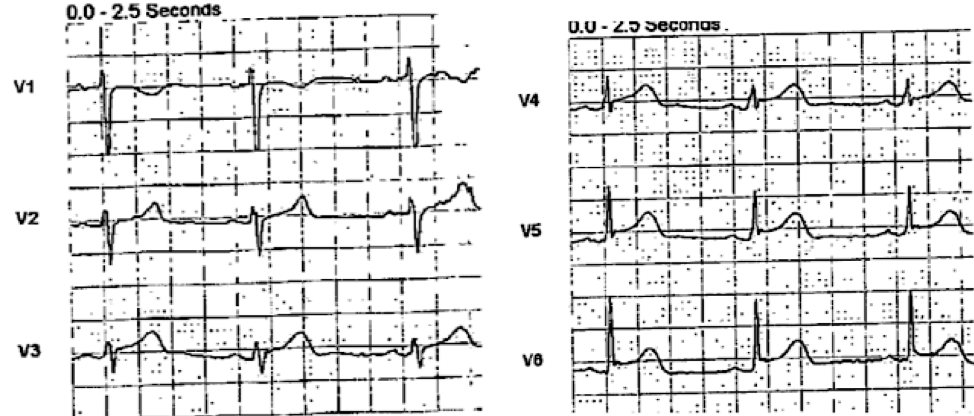 |
|
|
She arrived in the ED with her pain diminishing.
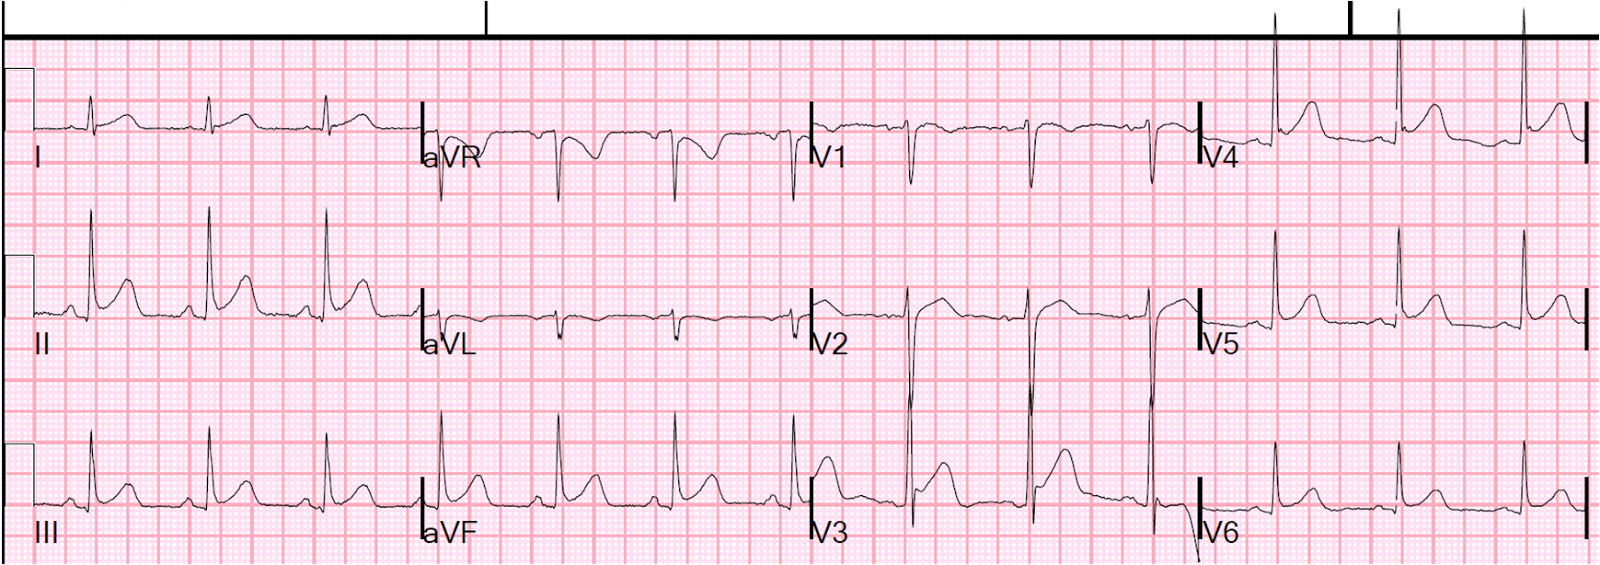
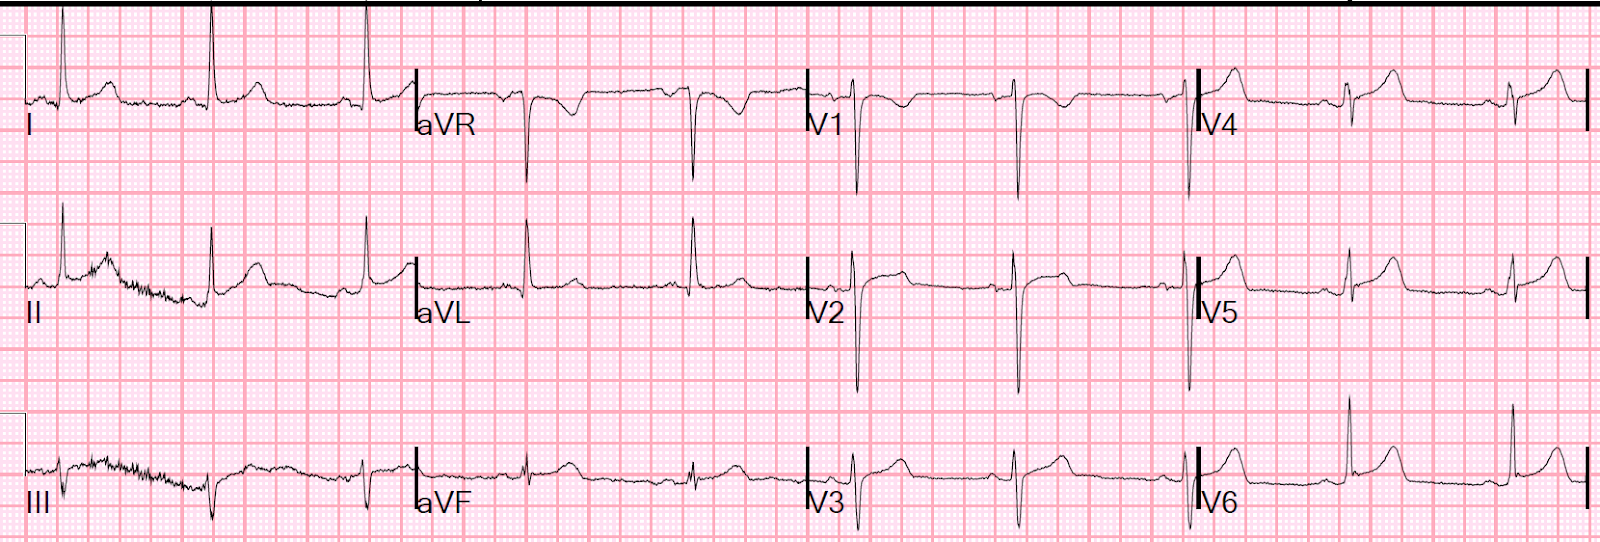
Here is her ED ECG:
 |
|
|
The first ECG is diagnostic of inferior OMI, with probable lateral involvement as well (V4-V6).
In the 2nd (ED) ECG, the inferior findings are gone. The lateral ST segments remain elevated. The T-waves appear hyperacute. If there had been no prehospital ECG, one may not have noticed these subtle findings.
The ED physicians immediately recognized inferior OMI and activated the cath lab.
Angiogram
Culprit is 100% occlusion of the Distal LAD due to athorosclerotic thrombosis (not spontaneous coronary dissection), affecting the inferoapical LAD hence an inferior (II, III, aVF) and apical (V4-V6) MI.
Peak troponin I was 4.7 ng/mL (99th %-ile URL = 0.030 ng/mL).
Echo
Normal left ventricular size, thickness, and systolic function with an estimated EF of 61%.
Very small regional wall motion abnormality–hypokinesis of the apical inferior and apical lateral segments.
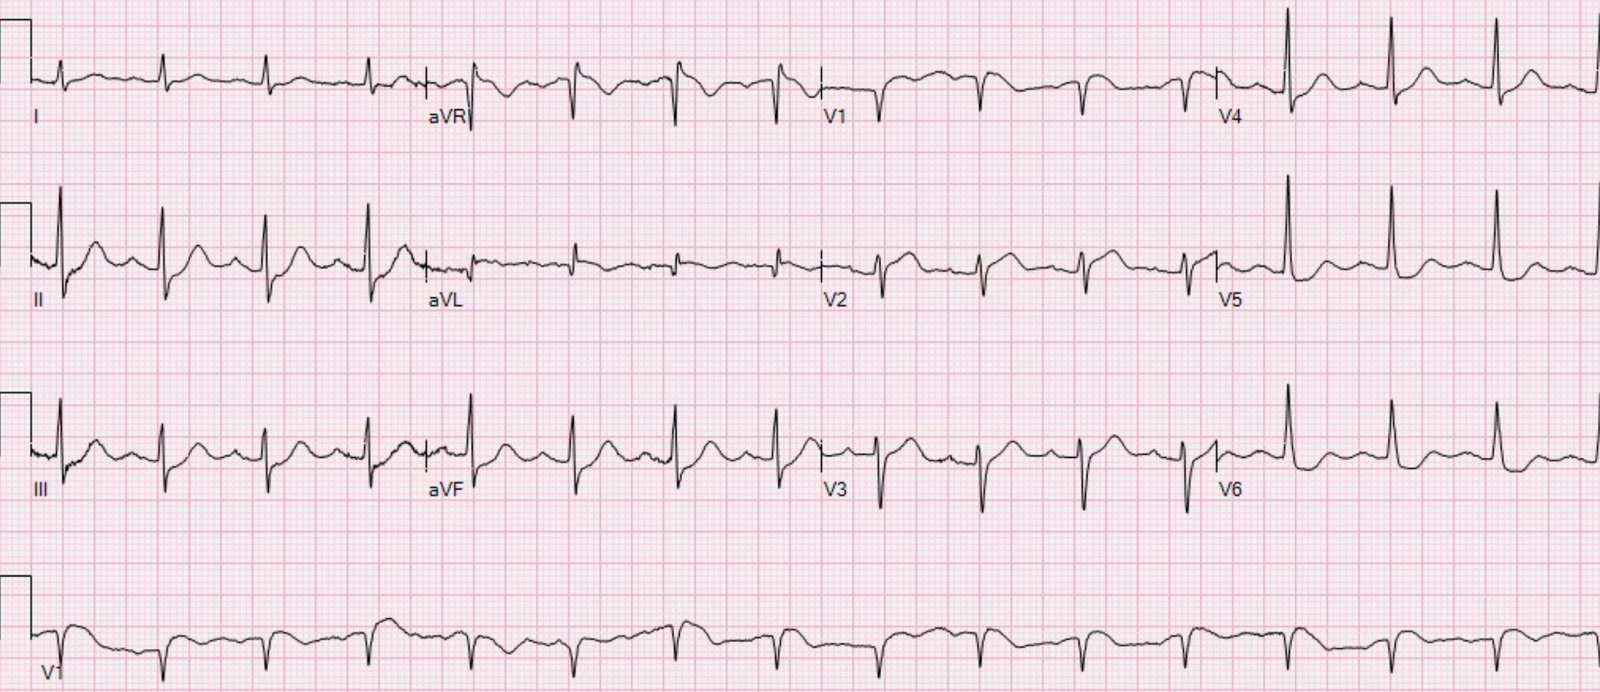
Here is the next day ECG:
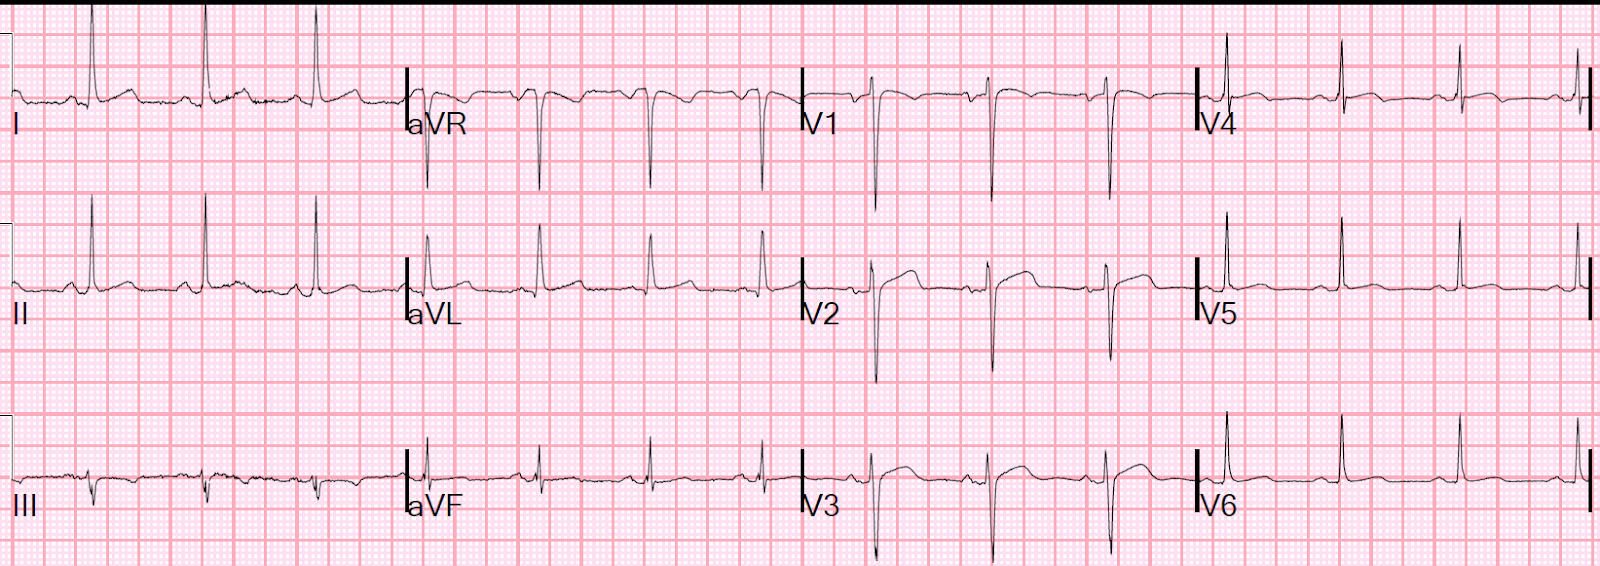 |
| All ST segments are isoelectric, proving that BOTH the inferior and lateral ST elevation was indeed ischemic ST elevation.
|
Learning Point:
1. Don’t forget that young women have myocardial infarction too!
2. Prehospital ECGs are critical
3. Always look for hyperacute T-waves and for reciprocal ST depression in lead aVL.
See this case:
24 yo woman with chest pain: Is this STEMI? Pericarditis? Beware a negative Bedside ultrasound.
![]()
===================================
MY Comment by KEN GRAUER, MD (1/29/2020):
===================================
Illustrative case with the important Learning Points put forth by Dr. Smith. These include:
- Young women can (and do) have acute MIs.
- Prehospital ECGs can be invaluable to our interpretation about what is going on.
- KEY findings on ECG to look for include hyperacute T waves — and, that “magical” reciprocal relationship with inferior OMI between leads III and lead aVL (For more on this “magical” relationship — Please see My Comment in these Dr. Smith posts — from 8/9/2018 — and, from 10/6/2018).
I focus my comments on some additional subtle changes seen in ECG #1, and confirmed by comparison with ECG #2 (Figure-1).
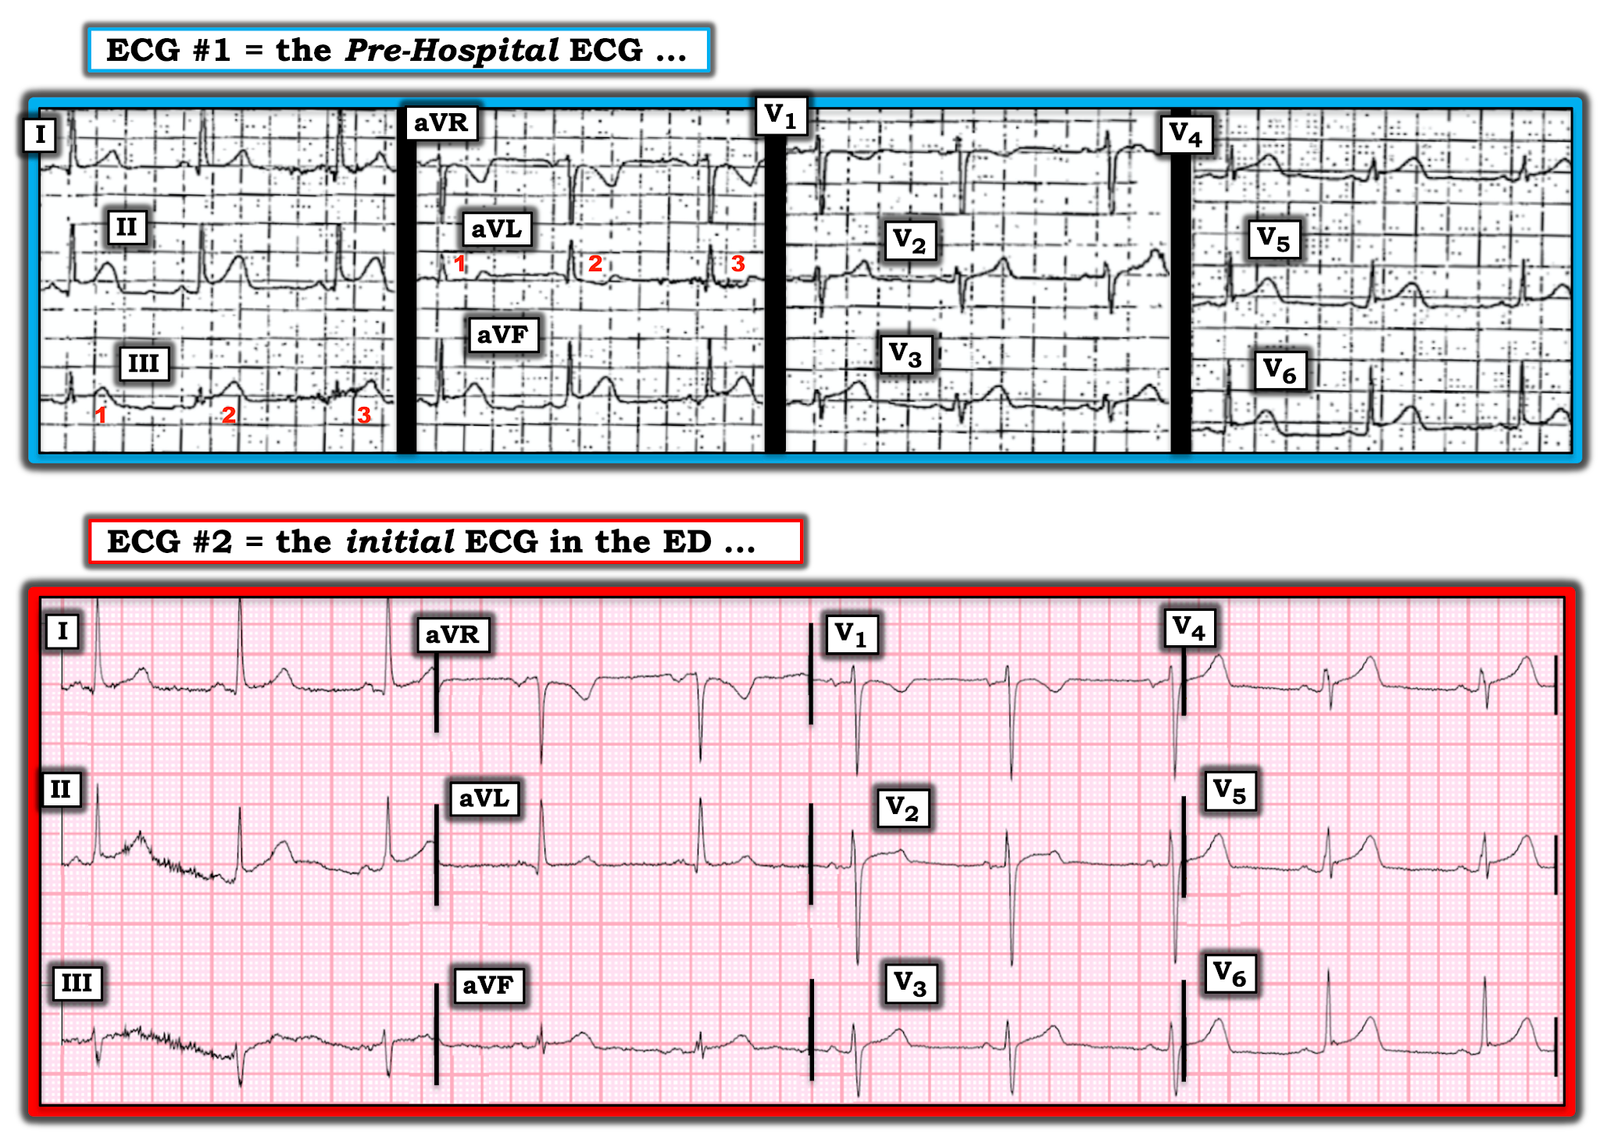 |
| Figure-1: The first 2 ECGs in this case (See text). |
My Thoughts on ECG #1:
Although resolution of this tracing is clearly suboptimal — this Pre-Hospital ECG ( = ECG #1) in a patient with new-onset chest discomfort is clearly of concern.
- The rhythm is sinus at 60-65/minute. All intervals are normal. The frontal plane QRS axis is normal at about +30 degrees. There is no chamber enlargement.
Regarding Q–R–S–T Changes:
- Small and narrow Q waves are seen in leads I and aVL.
- R wave progression is appropriate, with Transition (where R wave height exceeds S wave depth) occurring at a normal position, here between leads V3-to-V4.
- As per Dr. Smith — ST segments are elevated in each of the inferior leads — and in lateral chest leads (V4, V5, V6) — and, possibly also in high lateral lead I.
QUESTION: What distinguishes ECG #1 — from a tracing that might simply reflect a repolarization variant in a 20-something woman?
ANSWER: What distinguishes ECG #1 from a repolarization variant is a number of subtle findings that just should not be there in a normal tracing:
- Normal variants do not manifest the reciprocal ST depression that we see in lead aVL of ECG #1.
- T waves that are fatter-than-they-should-be at their peak in the inferior leads, and in leads V3 and V4. In addition — T waves are disproportionately taller-than-they-should-be (considering R wave amplitude) in leads V3 and V4. In the context of new-onset chest discomfort — all of these T waves qualify as hyperacute changes.
- Lead V2 in ECG #1 is clearly abnormal. Missing is the slightly elevated, upward sloping ST segment — that is replaced in ECG #1 with a relatively flat ST segment in lead V2, with disproportionately taller-than-it-should-be T wave in this lead.
- Lead V6 shows significantly more ST elevation than-should-be-seen in this most lateral chest lead.
- BOTTOM Line: Taken together — this makes for 10 out of the 12 leads in ECG #1 that show suspicious changes in this patient with new chest discomfort.
NOTE: Technically — ECG #1 is a challenging tracing to interpret. This is especially true for leads III and aVL— for which we are trying to establish that “magical” reciprocal relationship.
- For example — there is significant variation in QRST morphology for the 3 complexes that we see in these 2 leads (RED numbers 1, 2, 3). Which of these 3 beats in these 2 leads should we use to assess for ST-T wave morphology? Clearly the 2nd beat in lead III, and the 2nd beat in lead aVL look the most worrisome.
- PEARL — Many tracings manifest far less than perfect quality. It’s important to “take this in” as you assess any ECG — and then render an overall Gestalt impression on “the theme” of the ECG findings you see. In ECG #1 — that theme includes inferior lead ST elevation with reciprocal ST depression in aVL.
My Thoughts on ECG #2:
We are looking for dynamic ST–T wave changes. How is ECG #2 different from ECG #1?
- As per Dr. Smith — the inferior lead ST elevation is essentially gone (albeit harder to assess this in lead II of ECG #2, due to so much baseline wander).
- Did YOU notice the change in Axis between the 2 tracings? That is — the QRS in Lead III was all positive in ECG #1 — but in ECG #2, the QRS in lead III is predominantly negative. That said — the reduction in inferior ST elevation between the 2 tracings looks real despite this change in frontal plane axis.
- Given that QRS morphology in lead aVL is very similar (a qR complex) in the 2 tracings — the change from a depressed ST segment to a flat ST segment is real.
- Overall QRS morphology in the chest leads of both tracings looks similar (albeit with slight change in amplitudes). This strongly suggests that the change in lead V2 appearance (which now shows a coved ST segment in ECG #2) is a real change.
- As per Dr. Smith — the hyperacute T waves and ST elevation in lateral chest leads persist.
- BOTTOM Line: There are subtle-but-real ECG findings on these serial tracings. There has been dynamic change + persistent lateral chest lead abnormalities in the follow-up tracing ( = ECG #2) — which taken together, strongly support the premise of an acute ongoing event.
![]()