Written by Pendell Meyers, submitted by Siva Vittozzi-Wong
A man in his 30s with history of hypertension, hyperlipidemia, and diabetes presented with chest pain which started 12 hours prior to presentation. The pain was described as pressure, constant for 12 hours, radiating to the jaw, with left arm numbness. Initial vitals were significant for bradycardia at 45 beats per minute.
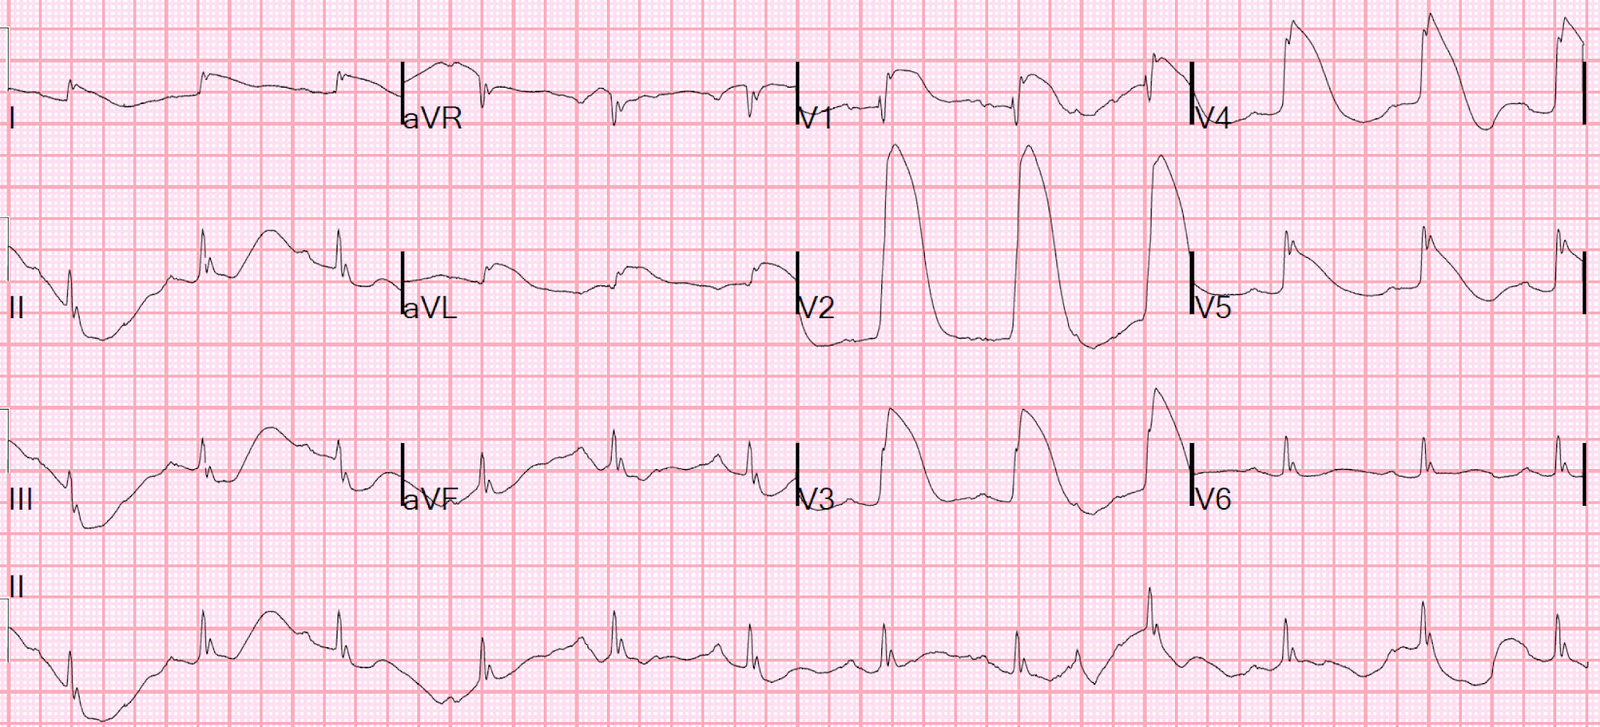
Here is his presenting ECG with active pain:
 |
| What do you think? |
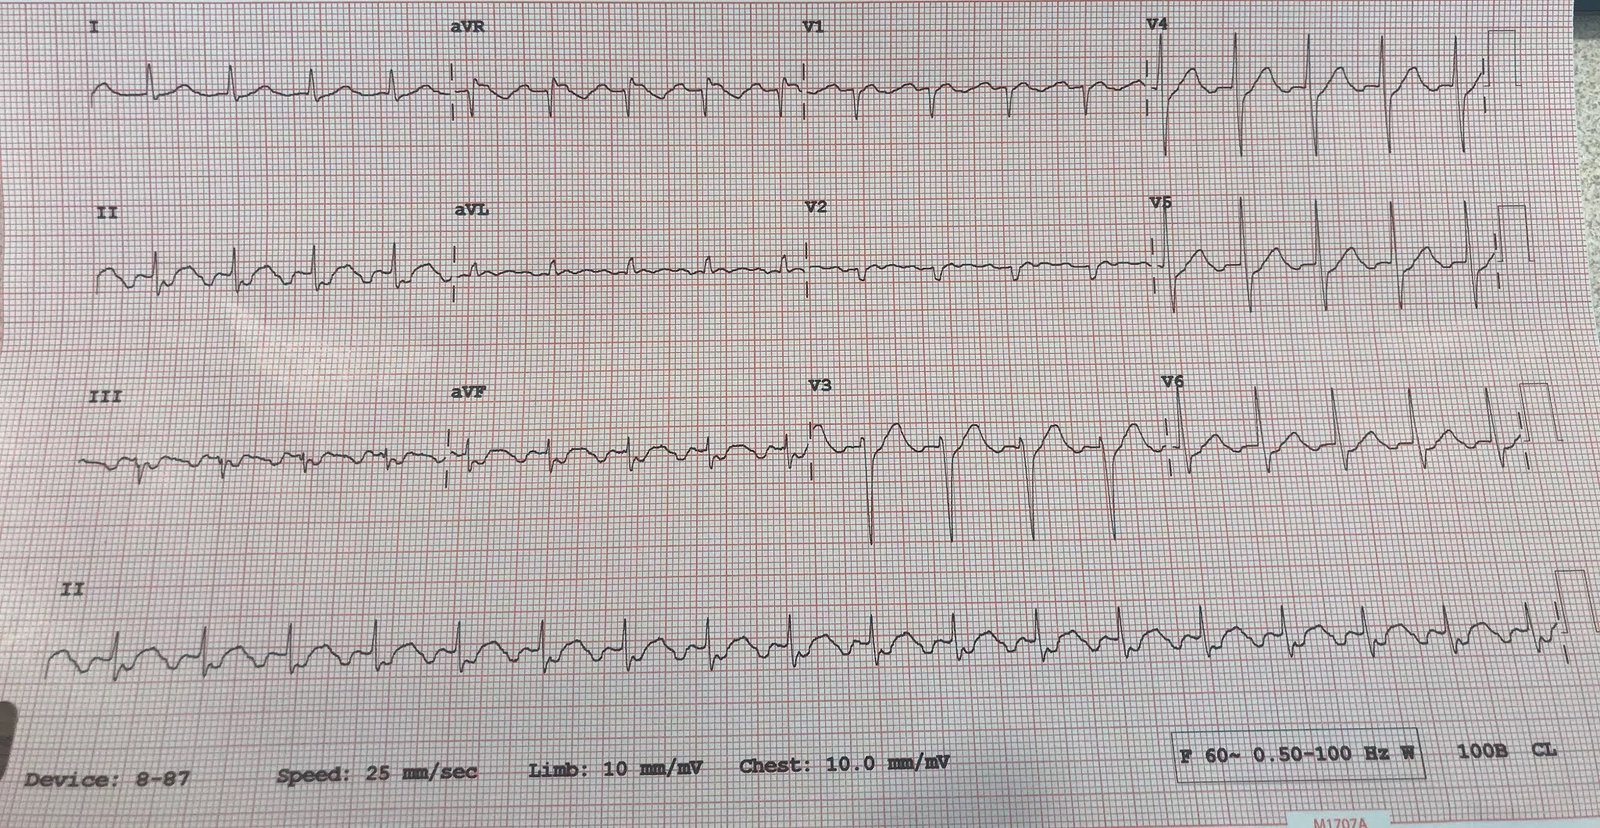
Here was the prior EKG on file:

The emergency medicine resident (who has received lectures from me on hyperacute T-waves, suble OMI, etc) documented the following interpretation:
“Initial EKG showed hyperacute T-waves in the inferior leads, in particular lead III. These findings are suggestive of an RCA occlusion which is supported by bradycardia due to SA node ischemia. Compared to an old EKG on file, these are all new findings.”
Meyers comment: So proud. Spot on. Inferior hyperacute T-waves, with negative hyperacute T-wave in aVL. The lateral leads also have minimal STE and hyperacute T-waves. Even without having the baseline ECG, I would say the inferior hyperacute T-waves are still diagnostic. With the baseline ECG in hand, it is all much easier and much more diagnostic, and you can see that the lateral leads are clearly hyperacute as well. Of note, the inferior leads may actually have STE that just barely meets criteria – it is just barely under a full 1 mm in two consecutive leads, and I believe that almost every cardiologist I’ve ever met would say it does not meet criteria.
After seeing this ECG, the resident immediately called an emergent consult to express concern of an acute RCA occlusion. The initial troponin was not yet back. Cardiology promptly evaluated the patient and did not recommend cath lab activation. Even though the pain was still active, it seems that they were most interested in the fact that the patient had had 12 hours of constant pain and did not meet STEMI criteria.
Meyers comment: There has NOT been 12 hours of persistent Occlusion MI per the ECG! This shows very very high “Acuteness“, with no significant Q-waves and hyperacute T-waves. There is maximal myocardium left to save! As we have said many times on this blog, the ECG is much much better at determining duration and salvage conditions than are patient reported symptoms.
Just like the ECG would suggest, the first troponin came back undetectable (because there hasn’t been 2-6 hours of occlusion to be picked up by our contemporary troponin T assay). The patient was admitted to the cardiology floor as per cardiology.
The second troponin was also undetectable. The third troponin T came back positive at 0.10 ng/mL. Heparin drip was started. There are no ECGs at this time. The fourth and fifth troponins continued to rise at 0.19 and 0.26 ng/mL, during this time we do not know if the patient still had active pain. Then an EKG was checked at 4am:
 |
| Looks slightly less hyperacute than initial presentation, but no signs of reperfusion such as terminal T-wave inversion or ST resolution. Without signs of reperfusion, and with persistent T-wave inversion in aVL, I would still be concerned for ongoing occlusion, though it looks improved. |
Another ECG was done at 8am (still no indication in the chart whether there was ongoing pain):
 |
| Very similar. |
After the troponin went up to 0.60 ng/mL, no more troponins were ordered.
The patient finally underwent angiography and they found:
Culprit lesions of the mid and distal RCA each with 95% stenosis (no TIMI flows documented), and the patient received 4 stents in the RCA. There was also non-acute CAD in the LAD (60% stenosis).
Here are the cath images below. Pay attention to the ECG recording in green at the bottom of each image:
 |
| Poor flow prior to intervention, but no complete occlusion during this snapshot in time. Notice the ECG lead looks similar to prior leads, perhaps lead II. |
 |
| After the intervention the angiographic flow in the main course of the RCA seems much more robust. But look at the ECG tracing across the bottom of the image! Although these monitor strips often exaggerate STE due to different filtering, we should pay attention to them. What do you think this means? |
The rhythm strip shows large STE with hyperacute T-wave. Despite no obvious occlusion of the main RCA on the angiogram, this means that a side branch must have become occluded during the intervention, or else a large amount of plaque embolized downstream into downstream vessels.
Like we always say, the ECG is superior to the angiogram for determining actual tissue perfusion.
There is no comment in the cath note about possible adverse events from the intervention, no recognition of the new STE during the procedure. The RCA is documented as having “TIMI 3” flow after the procedure.
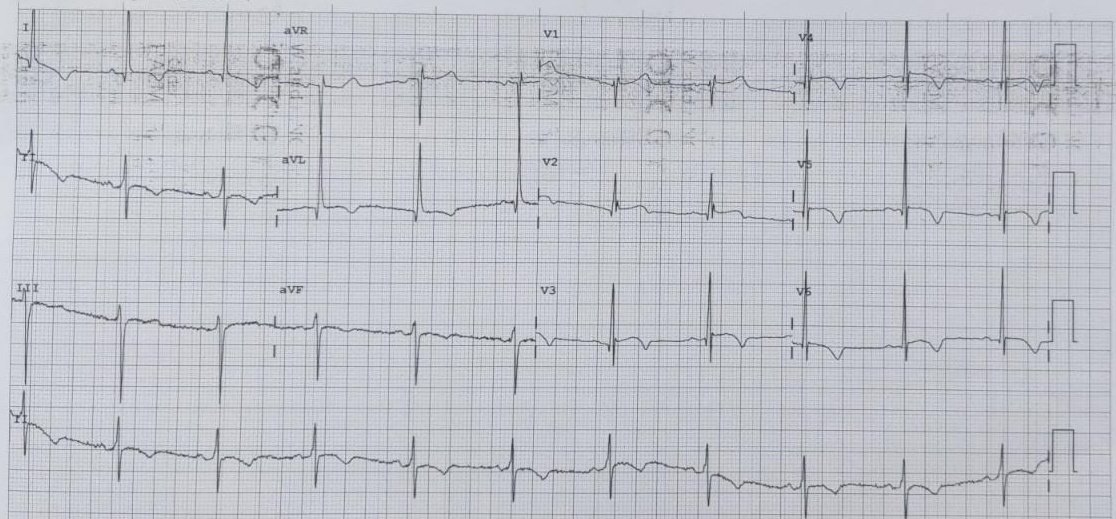
An ECG was performed several hours later:
 |
| Obvious STEMI with hugely hyperacute T-waves. |
Interestingly, no action was taken at this time. I suspect this means they already knew that something became occluded during the cath and it simply was not fixable. If they did not recognize it during the cath, then this ECG would have made them take the patient back to look for immediate in-stent stenosis of the new stent, but they did not take the patient back to the lab, so I must intuit that they understood what happened initially.
No more troponins were ordered at that time.
On day 3 he had another ECG recorded:
 |
| Progression likely to full thickness OMI with large wide Q-waves in the inferior leads and persistent STE with persistent upright T-wave, suggesting minimal reperfusion of the infarcted tissue. |
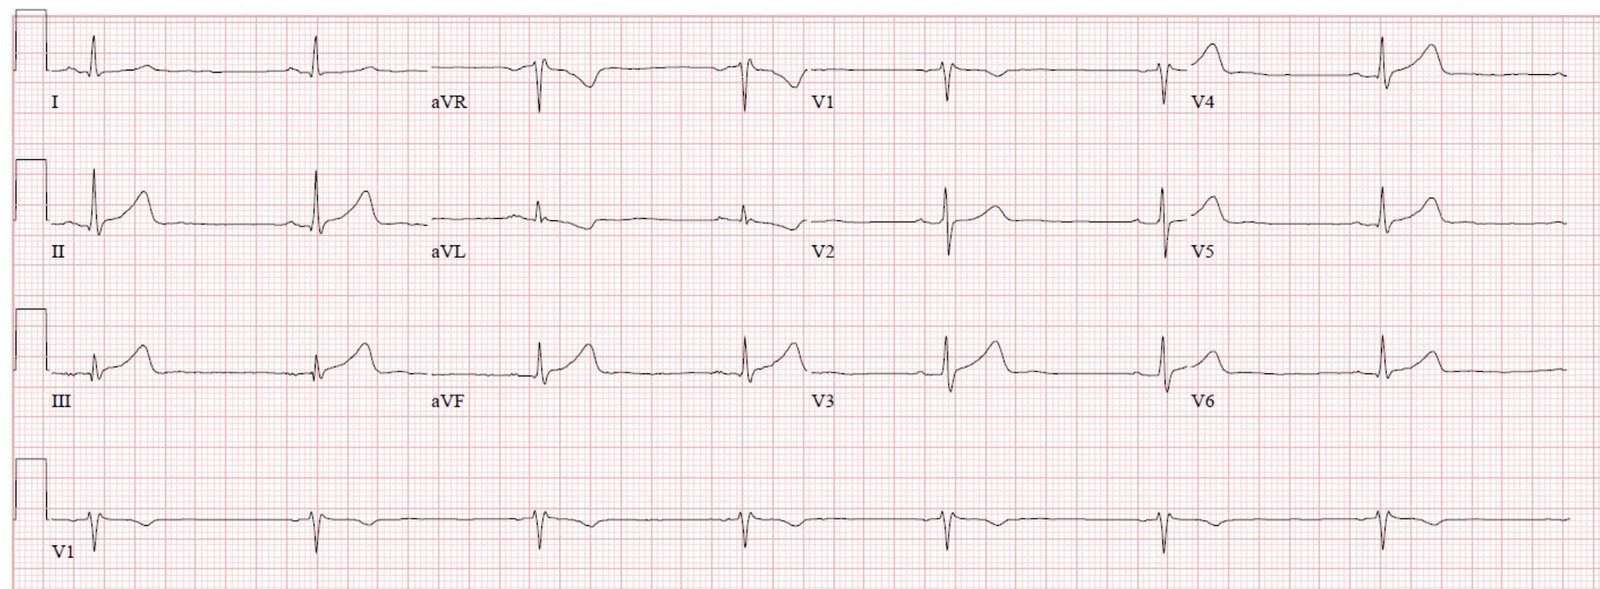
Another ECG 7 days later:
 |
| Now T-wave inversion in the affected leads. It is unclear to me whether this means any reperfusion happened, or whether this is simply the progression of T-waves expected at 7 days post full thickness OMI. I favor the latter based on the appearance of the previous ECG. |
The patients course was apparently uncomplicated in the hospital. He was discharged without further events.
Learning Points:
With the right training, emergency medicine physicians and residents (and any other human with eyes and a brain open to new ideas!) can outperform entire cardiology teams for detecting OMI while we are still stuck in the STEMI / NSTEMI era.
Train your eyes to see the inferior T-waves in this case as hyperacute, and to see their reciprocal finding in aVL.
Expert ECG interpretation is better than patient-reported symptoms to determine viability of myocardium in OMI.
Expert ECG interpretation is better than the angiogram to determine the actual success of reperfusion therapy in OMI. (see literature below)
Here is some older but very interesting literature on TIMI myocardial perfusion grade and ST resolution:
1. Claeys MJ, Bosmans J, Veenstra L, et al. Determinants and prognostic implications of persistent ST-segment elevation after primary angioplasty for acute myocardial infarction: importance of microvascular reperfusion injury on clinical outcome. Circulation 1999;99(15):1972-7.
2. Gibson CM, Cannon CP, Murphy SA, et al. Relationship of TIMI myocardial perfusion grade to mortality after administration of thrombolytic drugs. Circulation 2000;101(2):125-30.
3. Shah A, Wagner GS, O’Connor CM, et al. Prognostic implications of TIMI flow grade in the infarct related artery compared with continuous 12-lead ST-segment resolution analysis. Reexamining the “gold standard” for myocardial reperfusion treatment. J Am Coll Cardiol 2000;35(3):666-72.
4. van’t Hof AW, Liem A, de Boer MJ, et al. Clinical value of 12-lead electrocardiogram after successful reperfusion therapy for acute myocardial infarction. Zwolle Myocardial Infarction Study Group. Lancet 1997;350(9078):615-9.
5. van’t Hof AW, Liem A, Suryapranata H, et al. Angiographic assessment of myocardial reperfusion in patients treated with primary angioplasty for acute myocardial infarction: myocardial blush grade. Zwolle Myocardial Infarction Study Group. Circulation 1998;97(23):2303-6.
![]()
===================================
MY Comment, by KEN GRAUER, MD (11/20/2019):
===================================
Our THANKS to Dr. Siva Vittozzi-Wong for sharing this insightful case! — with SUPERB discussion by Dr. Meyers of serial ECG findings and events in this case. I focus my comments on 4 of the 7 tracings shown above, concentrating on selected advanced concepts in interpretation.
- It’s EASIER to appreciate an overall perspective of ECG findings in this case by putting serial tracings together — which I have done in Figure-1. For clarity — I’ve numbered the ECGs in the sequence in which they were done.
 |
| Figure-1: Four of the 7 ECGs that were done in this case (See text). |
The Clinical Presentation — The patient was a younger adult (in his 30s) — but with a history of hypertension, hyperlipidemia and diabetes (the combination of which could clearly predispose him to early development of coronary disease). He presented with new chest pain — that had started ~12 hours before he arrived in the ED. He was still having significant chest pain at the time ECG #1 was obtained.
Comment on ECG #1 — Although a prior ECG was on file — it’s BEST (in my opinion) not to look at a “baseline ECG” until after you have finished interpreting the initial ED tracing, and after you have formulated you clinical impression regarding HOW you would proceed IF there was no baseline tracing available.
- I completely agree with the points raised by Dr. Meyers — and will make a few additions. My Systematic Interpretation follows below:
- Descriptive Analysis of ECG #1 — There is a fairly marked sinus bradycardia & arrhythmia (Rate between ~45-50/minute) — all intervals (PR/QRS/QTc) and the frontal plane axis are normal — there is no chamber enlargement.
- Regarding Q–R–S–T Changes — There are small, narrow Q waves in multiple leads (with possible exception of the Q wave in lead III that is relatively big considering the very small amplitude QRS complex in this lead). It is important to note the presence and relative size of these Q waves in your interpretation — because of serial changes on later tracings!
- As we move on to “R Wave Progression” — Note the rSr’ complex in lead V1 with small negative component to the T wave in this lead + QRS appearance that looks very much like the PQRST in lead aVR (and quite different from the PQRST in lead V2). I suspect malposition (placement 1 or 2 interspaces too high) of the lead V1 electrode. This is relevant — as we are about to assess this patient with inferior lead changes, for the possibility of associated posterior involvement — which becomes more difficult if the lead V1 electrode is malpositioned …
- There is then abrupt transition in ECG #1 — with R wave amplitude equal to S wave amplitude already by lead V2. This is relevant — since early transition is a sign of acute posterior involvement.
- The major changes of interest (as expertly described by Dr. Meyers) — relate to ST–T wave changes. There should be NO doubt that the 1 mm of J-point ST elevation + hyperacute T waves (with wide base + fat-and-broad peak) in each of the inferior leads reflects an acute change — that is clinically confirmed by the mirror-image reciprocal ST depression that we see in lead aVL.
- As per Dr. Meyers — the similar-appearing ST-T waves in leads V3-thru-V6 also reflect a hyperacute change (with both fatter, peaked T waves + a small-but-definite amount of ST elevation).
- Finally — the overly straight ST segment in lead V2 is not normal (ie, the ST segment should normally slope gradually upward in this lead). In the context of acute inferior MI + lateral chest lead ST elevation (and a misplaced lead V1) — this suggests associated acute posterior involvement to me.
Clinical Impression of ECG #1: As per Drs. Meyers and Vittozzi-Wong — ECG #1 is diagnostic of acute RCA occlusion until proven otherwise — without need to confirm by serum troponin results, and without need of a prior tracing for comparison.
- Editorial Comment — I find it hard to believe that a cardiologist would say after examining this patient, that acute cath is not indicated in this fully functional young man with new (and ongoing) chest pain, given the ECG changes that we see in ECG #1.
Comment on ECG #2 — As per Dr. Meyers — Review of the prior ECG on this patient confirmed that the ST-T wave changes of concern in ECG #1 were indeed acute. This should have “cemented” the indication for prompt cath.
- The heart rate on the prior tracing was faster (60-65/minute). This suggests that the marked bradycardia in ECG #1 was indeed a part of the acute picture!
- Although slight ST elevation was seen in the prior tracing in a number of leads — the hyperacute T waves in leads II, III, aVF, and V3-thru-V6 were definitely not present in ECG #2 — and there was no ST depression at all in lead aVL. The ST segment flattening in lead V2 of ECG #1 was also absent in the prior tracing.
- Interestingly — small q waves were seen in a number of leads in the prior tracing, so this apparently was not a new finding. Although a Q wave was not previously seen in lead III — the fragmented S wave in this lead negates considering the Q in lead III of ECG #1 as an acute finding.
- BOTTOM LINE — Given the history of new chest pain, there can be NO doubt that the marked bradycardia + diffuse hyperacute ST-T wave changes in ECG #1 are acute.
Comment on ECG #5 — We are told that ECG #5 was done “several hours later” after cardiac cath. Even if the episode of ST elevation in the cath film went unnoticed — I would have thought the next ECG in this this case would have been done much sooner after cardiac cath than “several hours later”.
- I found it interesting to compare ECG #1 with ECG #5. There is a definite shift in frontal plane axis — almost meeting criteria for new LAHB (typically the S wave in lead II should be deeper than we see in ECG #5 for LAHB).
- The obvious changes in ECG #5 — are the marked hyperacute T waves with significantly increased ST elevation in inferior, and virtually all precordial chest leads + marked mirror-image reciprocal ST depression in lead aVL.
- Did YOU See the Loss of R wave across all chest leads beginning with lead V2? This is associated (compared to ECG #1) — with deepening of the Q waves in leads V5, V6. Given that this is the 1st post-cath ECG — in this patient who had multi-vessel disease (60% non-acute narrowing in the LAD, in addition to the “culprit” RCA lesions) — and, who demonstrated GOOD flow to the RCA during cath at the time of ST elevation on his cath film telemetry — Might the picture we see in ECG #5 not represent new occlusion of a portion of his LAD? It would be very helpful to learn the reason why this patient was not taken back to the cath lab after ECG #5 was obtained …?
Comment on ECG #7 — The last tracing in Figure-1 was obtained 7 days later. My thoughts are based on comparison of ECG #7 with the other 3 tracings we see in Figure-1.
- Compared to ECGs #1, 2 and 5 — ECG #7 now shows development of much wider and deeper Q waves in leads III and aVF. ST-T wave changes in the inferior leads are consistent with completed evolution of this patient’s acute inferior MI.
- Compared to ECG #5 — ECG #7 now shows return of a sizeable R wave in lead V2, as well as some increase in R wave amplitude in other chest leads. Q waves are present in leads V3-thru-V6 of ECG #7. Although fairly small in size — given the small R wave amplitude in leads V4, V5 and V6 — the Q waves in these chest leads are likely to be significant — and, they were not seen to this degree in either the initial ECG or the prior baseline tracing. This suggests there has been new lateral infarction since ECGs #1 and #2.
NOTE — To emphasize that some of the points I raise above are purely for educational purposes. I find it insightful (and an excellent way to hone your ECG interpretation skills) — to go back whenever possible — and take another look at serial tracings retrospectively interpreted in context to clinical events that occurred for the case at hand.
Our THANKS again to Drs. Vittozzi-Wong and Meyers for this highly instructive case!
![]()