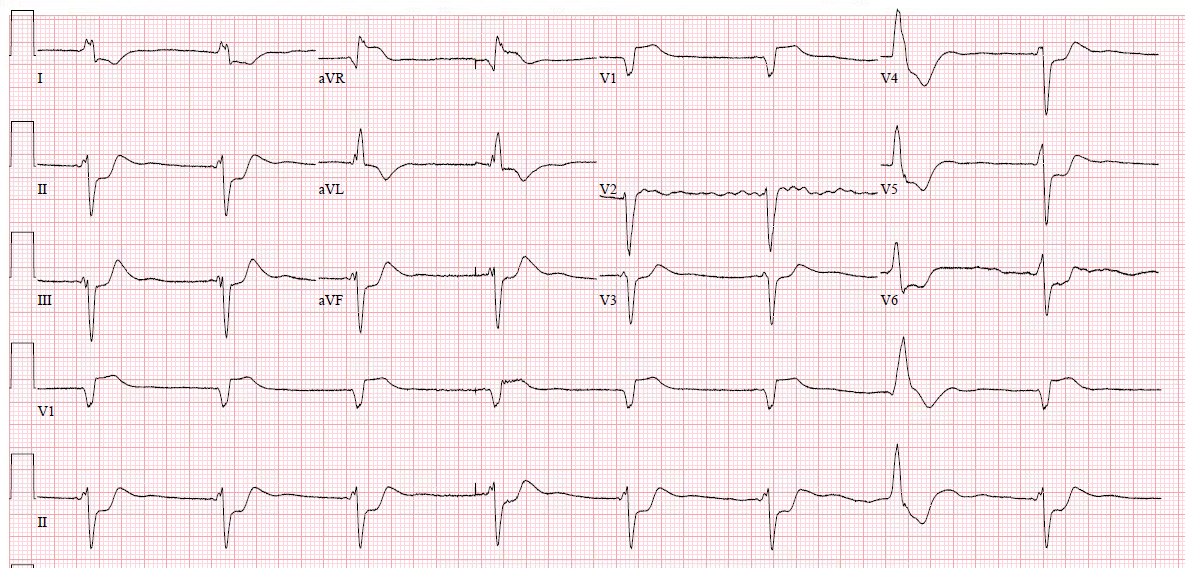
This patient presented with weakness, decreased urine output, and vomiting:
 |
| What is the ECG diagnosis? |
There is a very long QT (computer says the QTc is 525 ms) due to a long ST segment. This is pathognomonic for hypocalcemia. The ionized Ca was 2.34 mg/dL (normal is 4.4-5.2)
The Cr was 12.1 indicating (new onset) of renal failure.
Calcium was given without much change.
The next AM the non-ionized Ca was 5.7 mg/dL (normal: 8.6-12.0).
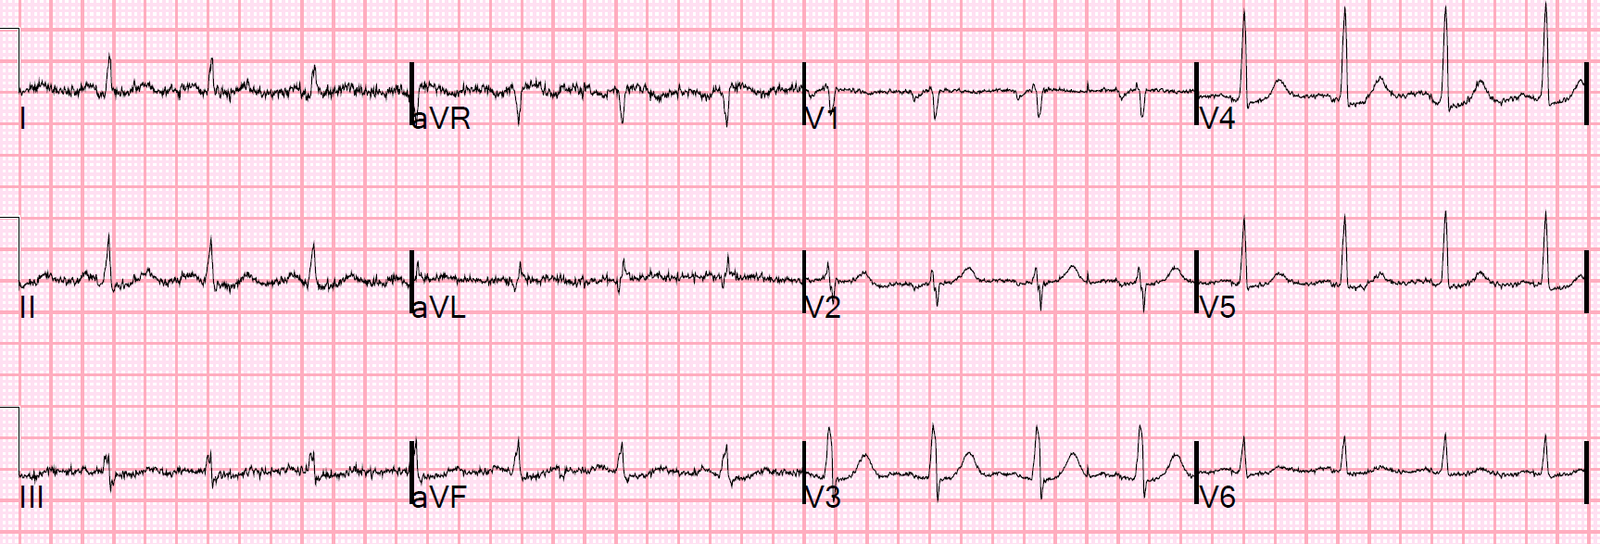
Here was a repeat ECG:
 |
| QTc 523. Long ST segment remains. |
Although the QT is very long, long QT due to hypocalcemia is rarely associated with Torsades de Pointes.
![]()
===================================
Comment by KEN GRAUER, MD (3/19/2019):
===================================
There are a number of ECG patterns that should immediately suggest a clinical diagnosis. This is one of them! The value of recognizing this particular ECG pattern — is that it may expedite your clinical diagnosis even before laboratory results return.
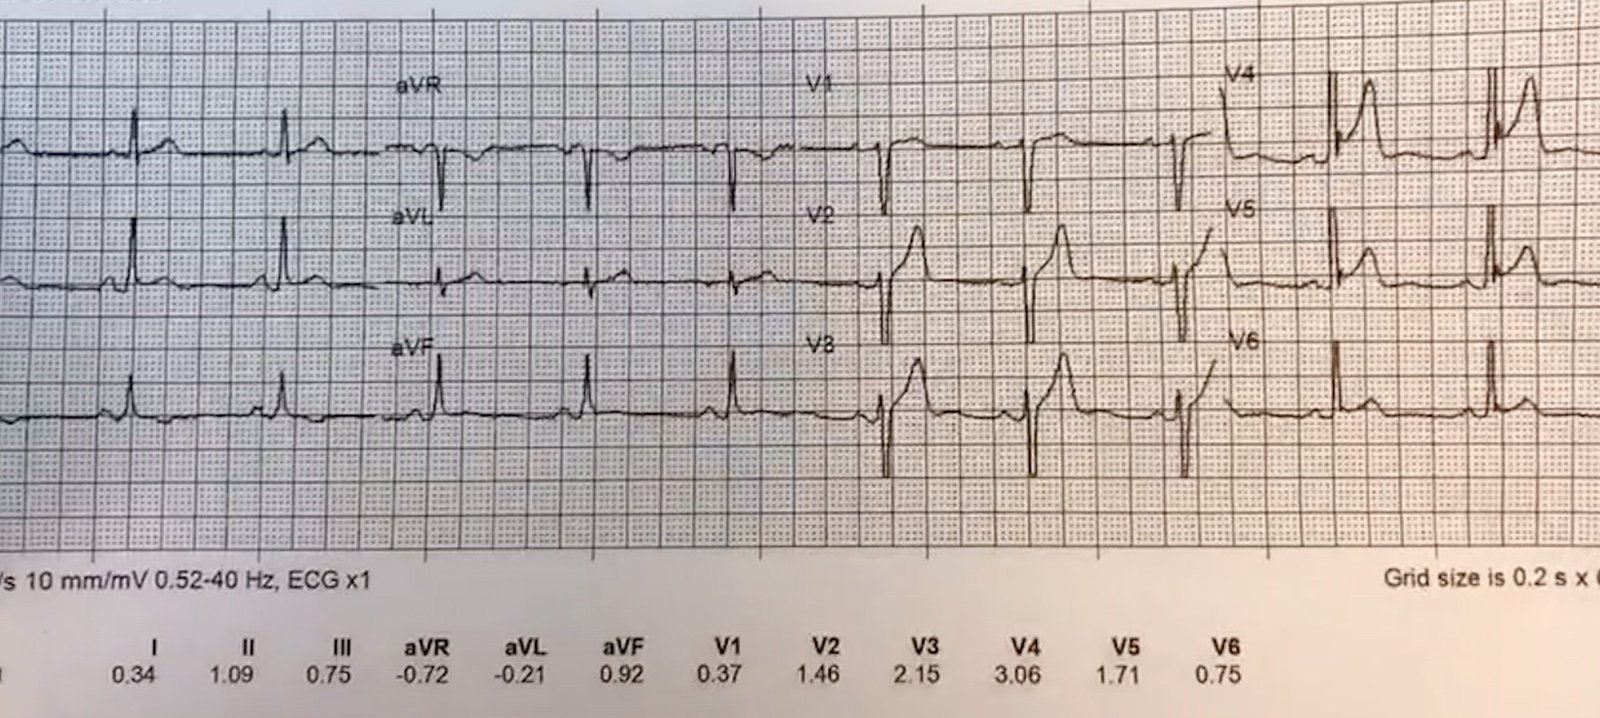
- To my reading — both of the ECGs in this case looked similar. I chose the 1st ECG — and for clarity, I’ve put it together with a user-friendly method I devised many years ago to rapidly estimate the QTc (Figure-1).
 |
| Figure-1: The initial ECG in this case — and a rapid method for estimating the QTc (See text). |
====================
COMMENT: I wanted to discuss a number of interesting aspects regarding the ECG in Figure-1. As per Dr. Smith — our attention is immediately captured by the very long QTc interval in ECG #1. Measurement of intervals is one of the tasks that the computerized ECG interpretation is usually very accurate with. The computer calculated a QTc = 525 ms for the ECG #1.
- I like the “eyeball method” to tell at a glance if the QTc is likely to be prolonged. Assuming the heart rate is not too rapid (this method works less well with heart rates >90-100/minute) — one may suspect that the QTc will be long if the longest QT interval that you can clearly see on the tracing is more than half the R-R interval.
- To quickly estimate a numerical value for the QTc — I developed a Correction Factor that has been surprisingly accurate for me in assessing too-numerous-to-count QTc values that I’ve estimated over the past 3+ decades. As per the text under the ECG in Figure-1 — you only need to remember 3 values (ie, 1.1 for a rate ~75/min; 1.2 for ~85/min; and 1.3 for ~100/minute). With a little practice using this method — you can estimate the QTc within seconds.
- Applying my method to the case at hand — the rhythm in ECG #1 is regular, with an R-R interval just under 4 large boxes. Thus, the heart rate is just a bit over 75/minute (ie, 300÷4). I selected lead V3 as one of the leads where we can clearly define the onset and offset of the QT interval. I measure the QT in this lead to be ~2.4 large boxes = 480 msec. Using a correction factor of 1.1 (since the heart rate ~75/minute) — I estimate the QTc = 480 + [480 X .1 = 48) = 480 + 48 ~528 msec. For speed and ease of calculation — I usually round off values (it’s all an estimate anyway! ) — but I’ve enjoyed being able to get very close to computer-calculated QTc values by this simple correction factor method.
====================
When the QTc is Prolonged: Assuming there is no bundle branch block, ischemia or infarction — I suggest remembering the following short LIST whenever you recognize QTc Prolongation. Think of: i) Drugs (many drugs prolong the QT interval — and combinations of drugs may result in marked prolongation); ii) “Lytes” (ie, Think of low K+ — low Mg++ — and/or — low Ca++); and, iii) a CNS Catastrophe (ie, stroke, bleed, coma, seizure, trauma, brain tumor).
- Clinical correlation will typically suggest which one or more of these 3 causes of a prolonged QTc is operative for the case at hand. The patient in the case presented here had new-onset renal failure — so, assuming normal mentation and no potentially QT-altering drugs — electrolyte disturbance should be strongly suspected.
====================
ECG Findings of HypoCalcemia: Hypocalcemia generally prolongs the QT interval. It is therefore one of the entities on our short LIST to immediately think of whenever you recognize QT prolongation.
- PEARL #1: In theory — pure hypocalcemia does not affect the T wave! As a result — the characteristic ECG picture of hypocalcemia is that of a flat and prolonged ST segment, at the end of which occurs a surprisingly normal-looking T wave.
- PEARL #2: Hypocalcemia and hyperkalemia may occur together in patients with renal failure. Clinically — this combined electrolyte disorder may occasionally be suspected by the ECG finding of peaked T waves with narrow base that occur at the end of a long and flat ST segment that produces a prolonged QT interval.
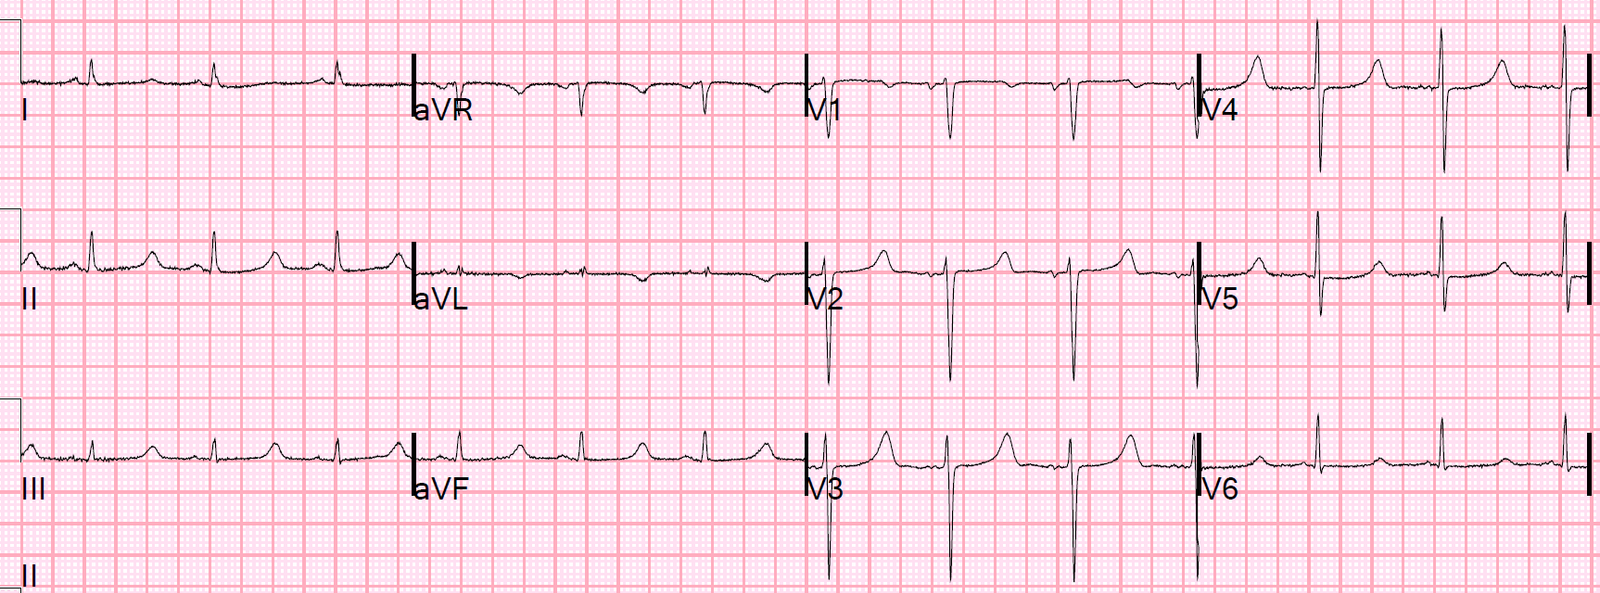
Final THOUGHT: We were not told what the serum K+ value was in this case. Given the very long QT interval in ECG #1 + the remarkably flat ST segment in most leads + the peaked and relatively narrow base for many T waves that look taller-than-they-should-be in leads II, III, aVF, and V2-V4 — I suspect combined Hypocalcemia and Hyperkalemia in this case.
![]()