Written by Magnus Nossen.
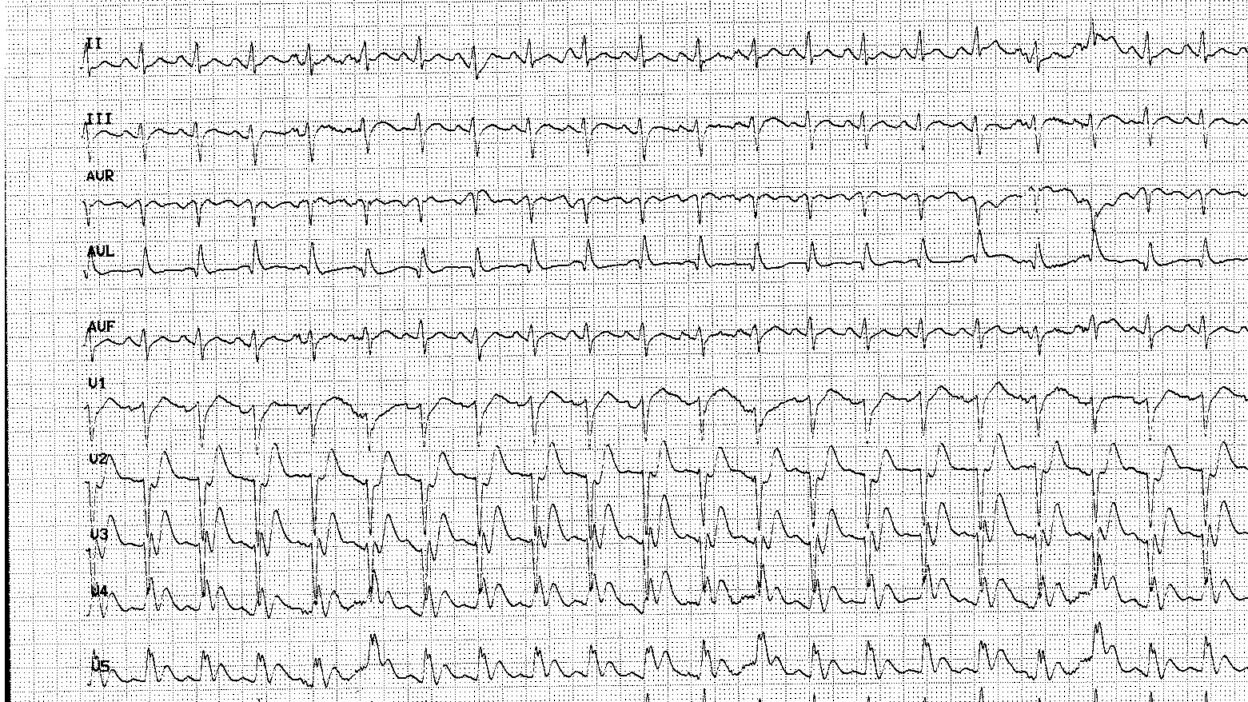
A 52-year-old man was found by EMS in severe distress, diaphoretic and confused. Moments later he collapsed and was found to be in pulseless ventricular tachycardia. He was resuscitated, intubated, and successfully defibrillated, with return of a perfusing rhythm. The ECG shown below was recorded immediately after ROSC, what do you think?
ECG #1
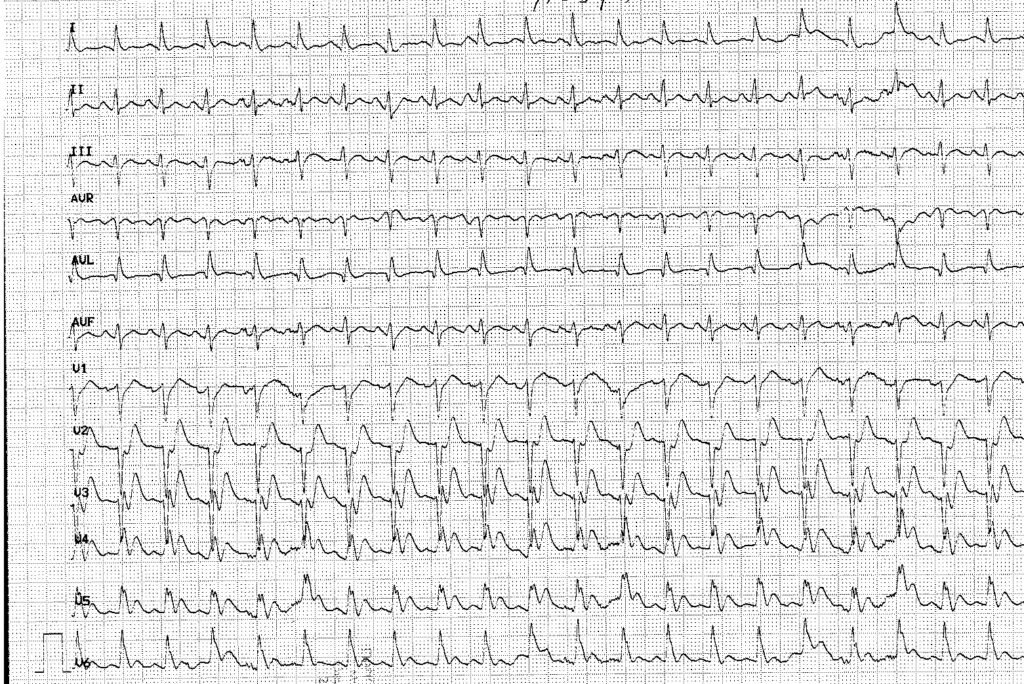
ECG #1 digitized
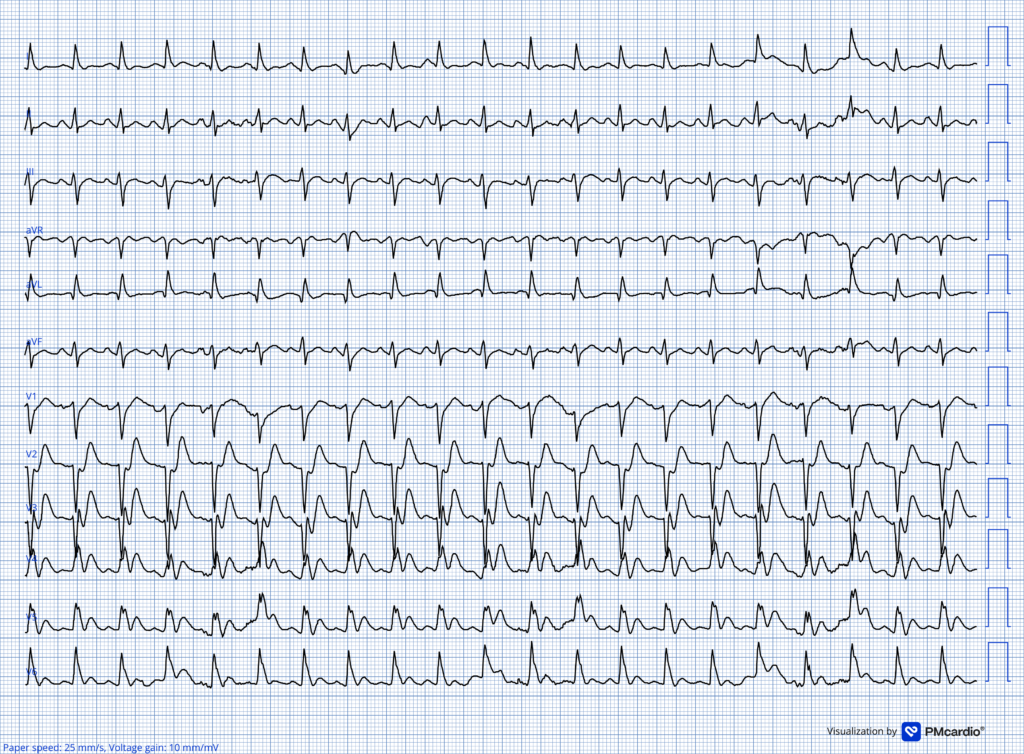
The ECG shows a regular tachycardia at approximately 125 bpm with clear sinus P waves. The QRS duration is prolonged at 134ms and there is an LBBB conduction delay.
However! This is not a straightforward uncomplicated LBBB pattern!
In leads V1–V3, the J-point and ST segments are depressed (concorant ST depression) — whereas appropriately discordant ST elevation would be expected in these leads with LBBB. Conversely, the lateral leads show an inappropriately isoelectric J point with prominent hyperacute T waves, rather than the expected discordant ST-segment depression. For the experienced interpreter, this ECG is diagnostic of an acute LAD occlusion.
_______
Smith: Concordant ST depression in just one lead of V1-V3 meets the Smith Modified Sgarbossa criteria for OMI. And it typically indicates a posterior OMI, as in this case:
Acute chest pain with LBBB and obvious OMI, worsening on serial ECGs, but repeatedly missed by physicians and Marquette 12SL
_______
Depressed J-point and hyperacute T waves has been reported in about 2% of patients with acute LAD occlusion. This pattern is known as deWinter T waves (even though not initially described by deWinter). If you are unfamiliar with this ECG pattern, have a look at this selection of cases.
Almost every time I’ve seen this characteristic pattern it has been preceeded by narrow QRS complexes. Only on rare occasions have I seen a depressed J-point with hyperacute T waves in a RBBB conduction abnormality. Two of these examples are documented in Dr. Smith’s ECG Blog (Look here and here).
Today’s ECG is the first example I’ve seen of LBBB with superimposed deWinter T wave morphology. This appears to be a rare composite pattern!
Smith: I agree. I’ve never seen this before: LBBB with de Winter pattern.
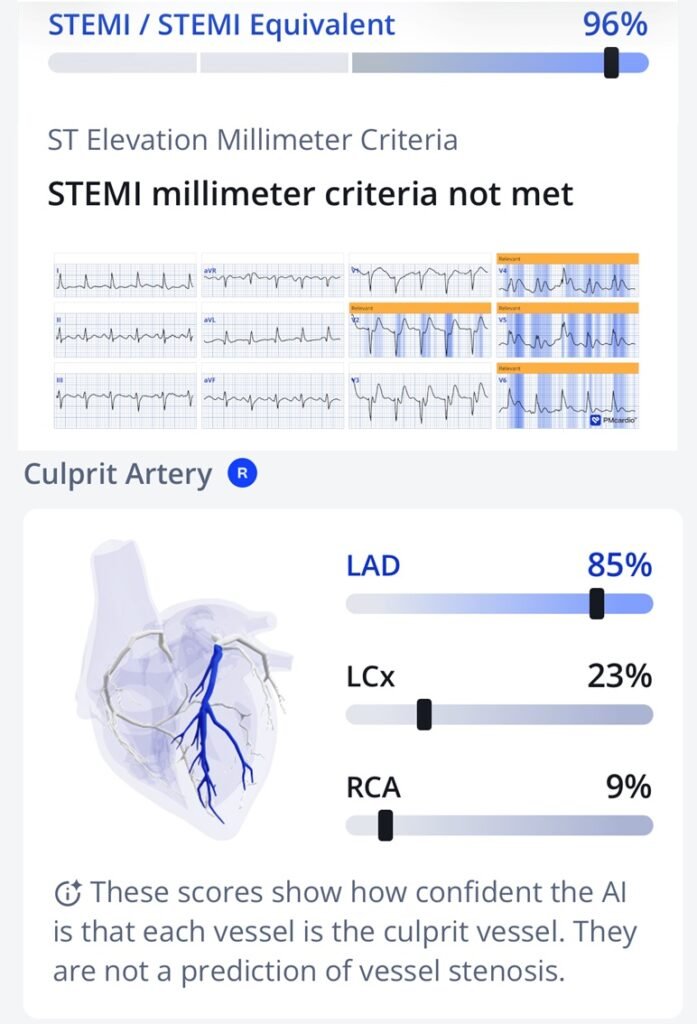
I submitted the ECG to the Queen of Hearts. Queen of Hearts Now FDA Approved!! What’s her take on this “Non-diagnostic” ECG?
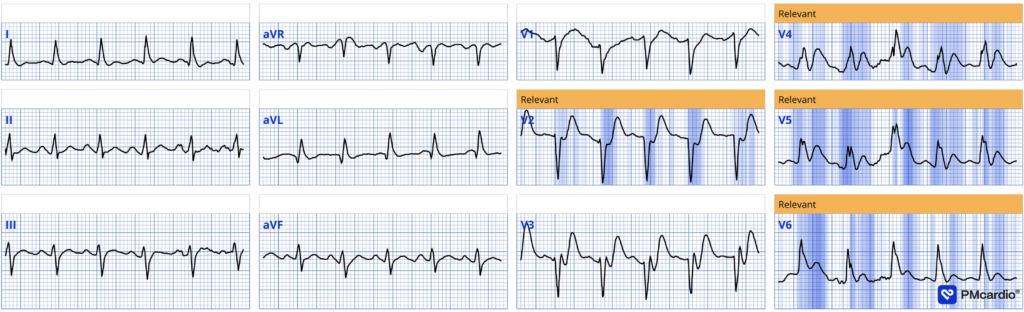
Although the Queen model has not specifically been trained for recognizing this precise combined pattern — it classified this tracing as an active OMI/STEMI equivalent, with a probability output of 0.96. This is notable because the algorithm successfully identified a highly concerning pattern without being trained on multiple ECGs showing this combination of patterns (LBBB + deWinter T waves). Moreover, the Queen recognized that it is NOT a posterior OMI, but rather anterior due to LAD Occlusion!
Here you can see it better:
It is unclear whether today’s initial ECG was recognized as an acute LAD occlusion. PCI was performed in the setting of cardiac arrest-survival and cardiogenic shock — where the decision to proceed with urgent angiography may have been driven primarily by clinical instability rather than the ECG findings (which is of course appropriate — as ACS is the presumed cause of the arrest and cardiogenic shock).
Coronary angiogram showed a 100% acute occlusion of the proximal LAD. With a large 2nd Diagonal being chronically occluded. The LAD culprit was successfully treated. Initial conventional troponin-I returned at 43ng/L, later rising to 3600ng/L (but was not measured to peak).
The below ECG was recorded one day after PCI. It shows loss of R waves in the precordium with TWI as a reperfusion pattern. The LBBB conduction block is now resolved following revascularization.
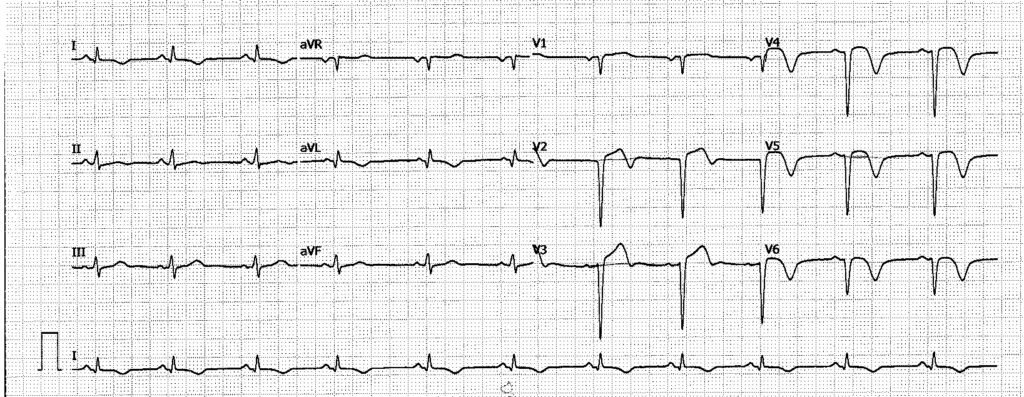
The patient was discharged with a diagnosis of STEMI, although the ECG did not demonstrate diagnostic ST-segment elevation. LVEF was 45% at discharge, and guideline-directed heart-failure therapy was initiated.
Given the extensive precordial Q waves following PCI, the acute-phase LVEF may not accurately reflect longer-term LV systolic function. The ECG pattern is consistent with a large completed anterior infarction. There is risk of subsequent adverse LV remodeling, and I would suspect that follow-up LVEF may have been substantially reduced. Unfortunately, no follow-up imaging or clinical data are available.
Overall, the patient in today’s case was managed appropriately with urgent PCI. However, had the presentation been less dramatic, for example, with haemodynamic stability and chest pain alone — it is uncertain whether the patient would have been accepted for immediate coronary angiography.
Learning Point:
- ECG patterns indicating OMI may take many forms. You need to become expert in ECG interpretation and/or use the Queen of Hearts if you want to identify those who need emergent PCI.
- The deWinter T wave pattern may be seen with LBBB.
= = =
==================================
MY Comment, by KEN GRAUER, MD (9/21/2026):
I share Dr. Nossen’s fascination with today’s initial ECG — in that it appears to represent a rare composite pattern of LBBB + deWinter T waves.
- As per Dr. Nossen — it is not clear whether providers recognized acute proximal LAD occlusion from this initial ECG vs whether prompt cath was performed as a result of the patient’s cardiac arrest, cardiogenic shock and resultant clinical instability.
Confession: I fully acknowledge that at first, I was confused by today’s initial ECG — primarily because of the marked tachycardia with QRS overlap in leads V2,V3,V4 — as well as the finding that the QRS did not look wide enough in the limb leads to qualify as LBBB (Prior to digitalization — I thought I was looking at huge ischemic J waves in lead V4 rather than QRS widening from LBBB).
- To Emphasize: Distinction between LBBB + deWinter T waves vs “something else” — is of academic interest given clear indication for prompt cath with PCI in this post-arrest, critically ill patient in cardiogenic shock.
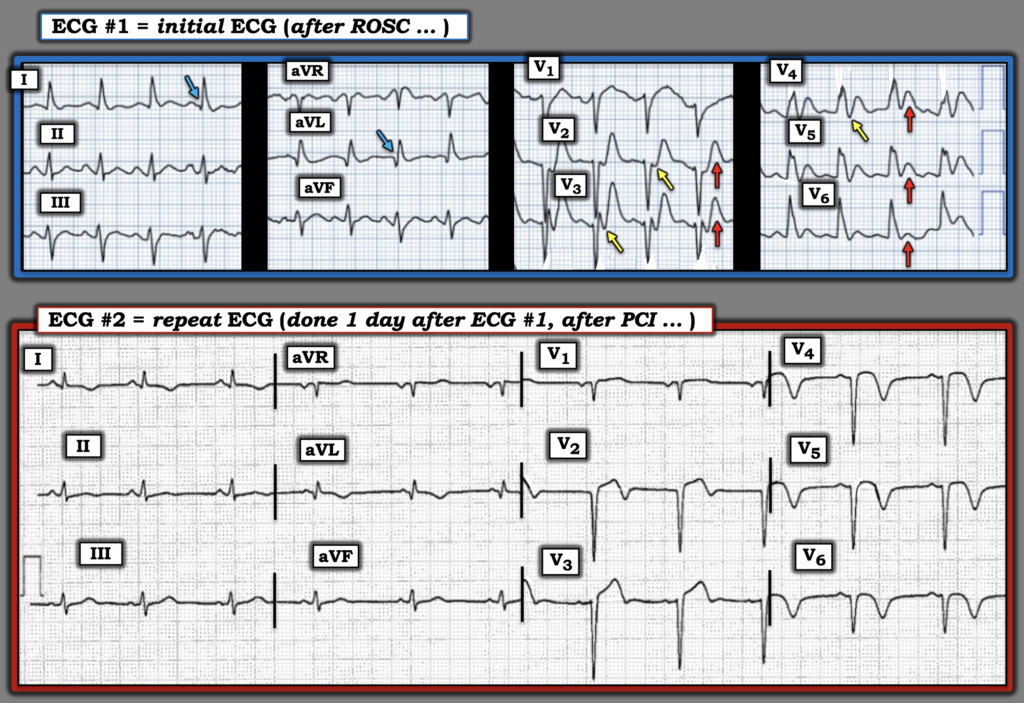
- That said — I thought it worthwhile to look closer at today’s initial ECG after whiting out the confusing overlapping chest leads — and then comparing this tracing to the repeat ECG (as I do in Figure-1 after converting the initial ECG to the same landscape format as the repeat ECG).
= = =
Today’s initial ECG:
Leads V4 and V5 confirm that the QRS is wide in ECG #1, albeit the onset and offset of the QRS is not easy to determine in other leads.
- The widened QRS, with predominant negativity in anterior leads, in association with an all positive QRS in lateral chest leads V5,V6 is consistent with LBBB.
- Normally — there should be no Q wave in lateral leads with LBBB (because the direction of initial septal depolarization is reversed by the LBBB — and therefore moves from right-to-left). Thus the finding of Q waves in leads I and aVL (BLUE arrows in these leads) provides early indication of ongoing septal infarction.
- Instead of a proportional amount of opposing ST elevation that is expected in anterior leads with LBBB — the ST-T waves in leads V2,V3 are disproportionally elevated in ECG #1 — and this ST elevation becomes inappropriately concordant (in the same direction) as the upright QRS in lateral chest leads V4,V5,V6 (RED arrows in these 5 chest leads).
- And — there is J-point ST depression in a number of chest leads with hyperacute T waves (YELLOW arrows).
- Impression: The elements of deWinter-like T waves are clearly present in today’s initial ECG: i) Overly large hyperacute T waves in the anterior chest leads (which given the LBBB — these hyperacute T waves continue across the precordium to include lead V6, a lead in which the T wave should never normally be positive with LBBB); — and, ii) Onset of these rapidly-rising hyperacute chest lead T waves by J-point depression (YELLOW arrows).
= = =
Figure-1: Comparison between the 2 ECGs in today’s case.
= = =
The repeat ECG:
Proof of the above ECG findings of deWinter-like T waves in ECG #1 — is forthcoming from comparison in Figure-1 of the repeat ECG recorded the following day after successful reperfusion of the acutely occluded proximal LAD:
- There is total loss of chest lead R waves in all leads that previously showed hyperacute deWinter-like T waves.
- High-lateral Q waves in leads I and aVL are confirmed.
- Extensive reperfusion T waves are now seen in the infarcted areas (ie, in leads I,aVL; and V2-thru-V6).
= = =
= = =