I was texted this case by Ankur Kalra, an interventional cardiologist at the University of Indiana. He also did his cardiology fellowship at my institution, Hennepin County Medical Center.
- He runs the Parallax podcast, and he inteviewed me on that Podcast this year.
- He says the podcast had over 3000 downloads and “It’s our season 6 topper”
Here it is:
By the way, also don’t miss this new OMI review article (January 17, 2025) in Annals of Emergency Medicine:
Today’s CASE:
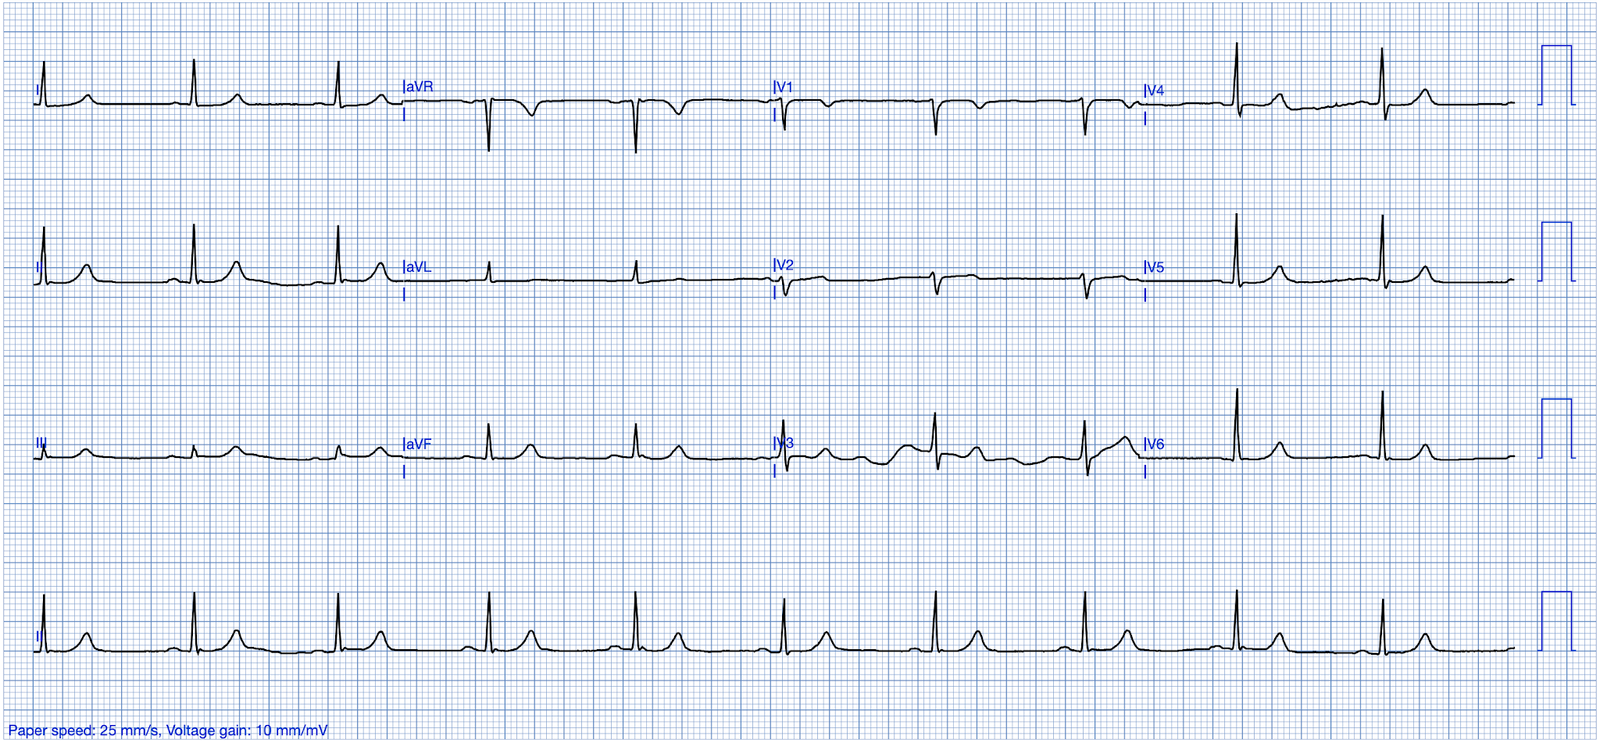
Dr. Kalra texted me this ECG on a Sunday Morning:
- Patient with abdominal pain. No chest pain. hs-Trop I = 15,000. I think it is OMI. Taking her to the cath lab.

My response: “This looks like a subacute (possibly spontaneously reperufused) first diagonal. Could be LAD. But it is definitely OMI. T-wave inverted in aVL and starting to invert in V2.”
- This ECG has the “South Africa Flag Sign”.
This image below illustrates the “South Africa Flag Sign” (Image is Ken Grauer’s depiction from this previous post). It is a sign of STE or Hyperacute T-wave in V1, I, aVL — with reciprocal ST depression in lead III.
- This is a sign of first diagonal occlusion, or sometimes of LAD occlusion proximal to the first diagonal.
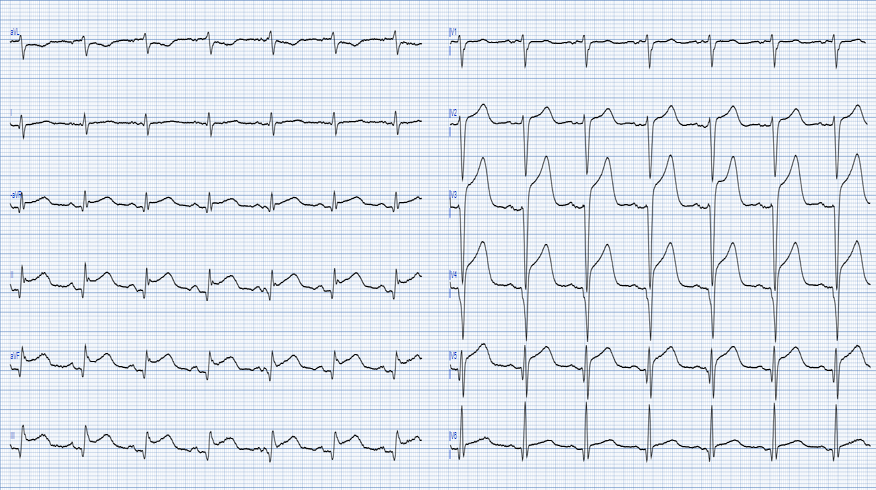
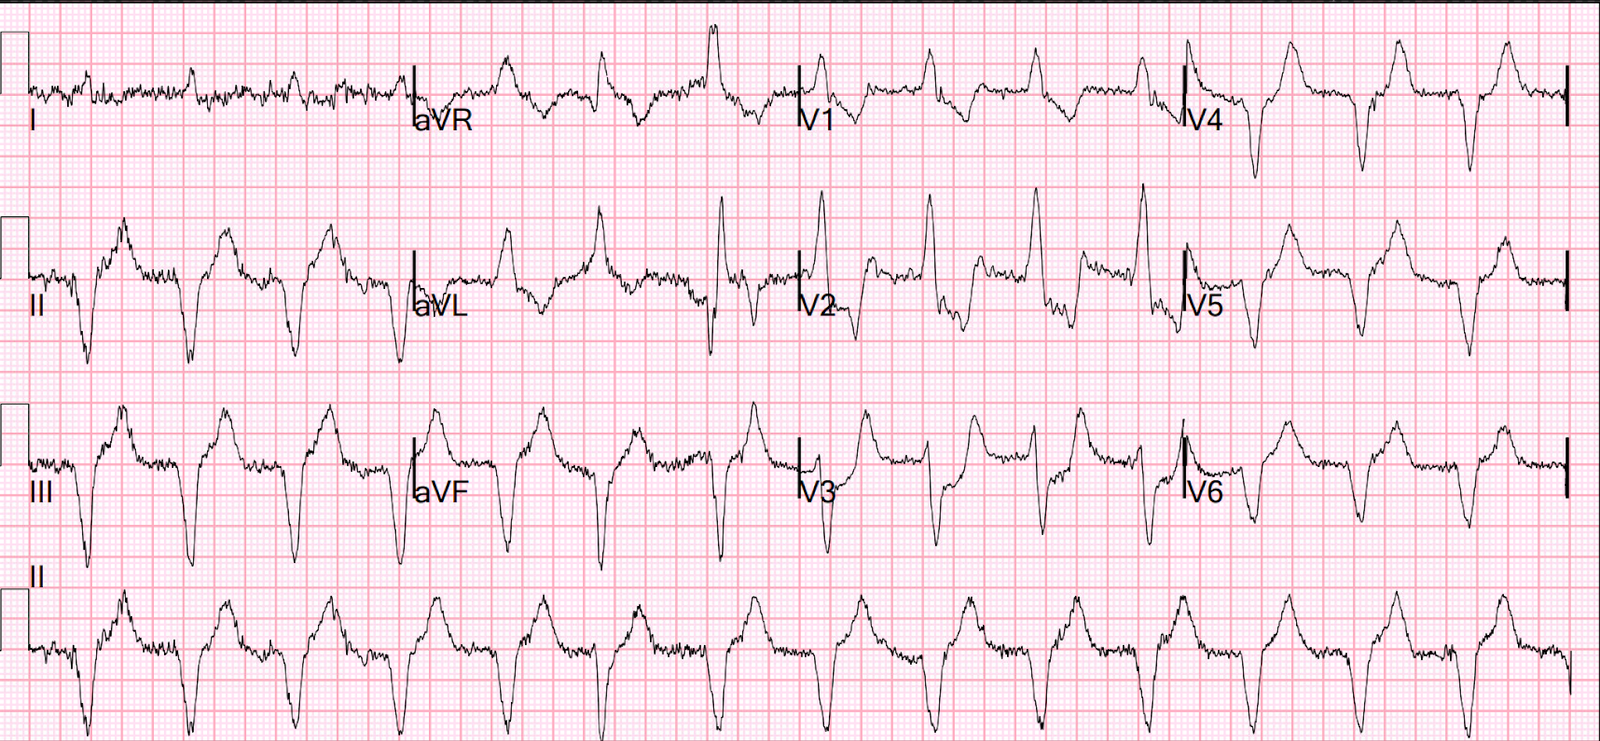
- Quiz post: do either or both of these patients have high lateral OMI / South African flag sign?

= = =
I sent the ECG to the Queen of Hearts PMCardio AI Model for her diagnosis:

Dr. Kalra’s response: “Wow! I will let you know.”
= = =
The interventionalist sent this image back:

Smith: You can see the cut-off of the artery near the top, just below that tortuous vessel.
Dr. Kalra wrote back:
- OMI it was. Large diagonal. Now opened.
- Dr. Smith — You’ll change MI care, if you haven’t already. I’m changed.
= = =
==================================
MY Comment, by KEN GRAUER, MD (1/18/2025 — Updated for WordPress on 5/1/2026):
It’s not often that we see a clinical entity for which it seems that the patient “read the textbook” before the ECG was recorded. By this, I mean that most of the time with well described entities (ie, Brugada patterns, repolarization variants, “shark fin” ST deviations, conduction defects, etc.) — there are a variety of possible ECG patterns that often manifest differences in some way from the textbook description.
- In contrast — Today’s initial ECG (as per Dr. Smith) is clearly diagnostic of an acute OMI that at the stage shown in the BOTTOM tracing in Figure-1, very clearly suggests a “culprit” artery in the 1st or 2nd Diagonal Branch of the LAD.
- As per the schematic picture at the top of Figure-1 — the South African Flag Sign is present in a patient with new CP (Chest Pain) when there is: i) ST elevation in leads I, aVL and V2; — ii) Reciprocal ST depression in lead III (ST depression is also often seen to a lesser degree in neighboring inferior leads II and aVF); — and, iii) No ST elevation in any chest leads except for lead V2 (The principal leads with ST elevation or depression are highlighted in GREEN in Figure-1 — following the distribution of the S. African Flag).
The TOP ECG in Figure-1 is from the April 8, 2022 post in Dr. Smith’s ECG Blog — and illustrates the above noted findings of the S. African Flag Sign (ie, ST elevation in leads I,aVL,V2 — reciprocal ST depression in lead III ).
- PEARL #1: As per Dr. Smith — Sometimes acute proximal LAD OMI will initially look like a Diagonal Branch OMI — because ST elevation may initially be limited to lead V2, and only later be seen in leads V1,V3,V4. A tincture of time and serial ECGs will usually clarify the situation.
- PEARL #2: The clinical significance of being aware of a Diagonal Branch “culprit” — is that: i) Since only 1 chest lead shows ST elevation (ie, lead V2) — this pattern will not “fit” the definition of a STEMI, because only 1 chest lead shows ST elevation (and the definition of an anterior STEMI requires 2 contiguous chest leads to show ST elevation); — and, ii) Recognizing the S. African Flag Sign alerts the angiographer where to look for the “culprit” artery. We have seen cases in which a capable angiographer initially missed the cath finding of Diagonal Branch occlusion — BUT — seeing this ECG pattern conveyed the need for another LOOK at the cath film, with focus on the expected area for Diagonal Branch takeoff then revealing subtle-but-complete occlusion in one of the Diagonals.
= = =
QUESTION:
- How does today’s initial ECG differ from the TOP tracing in Figure-1?
= = =
Figure-1: The South African Flag Sign — with comparison of the ECG from the April 8, 2022 post — with today’s initial ECG.

= = =
Comparison between the 2 ECGs in Figure-1:
Both tracings in Figure-1 are consistent with the S. African Flag sign — in that the leads with the most prominent ST-T wave changes are leads I,III,aVL and V2 — which correspond to the arrangement of GREEN coloring in the horizontal “Y” of the South African Flag.
- It is difficult to date the onset of the MI in today’s case because this patient never had CP — yet the initial Troponin was markedly elevated.
- The principal difference in the interpretation of the 2 tracings in Figure-1 — is that in addition to ST elevation in leads I,aVL,V2 with ST depression in lead III — there are now reperfusion T waves in ECG #1 (RED arrows indicating T wave inversion in leads I,aVL,V2 — and peaking of the terminal T wave in lead III. This suggests that acute occlusion of the 1st Diagonal occurred some time before this ECG was recorded — and that there has now been some spontaneous reperfusion.
- “Take-Home” — Remember the picture highlighted within the GREEN rectangles in Figure-1.
= = =
= = =