Written by Pendell Meyers.
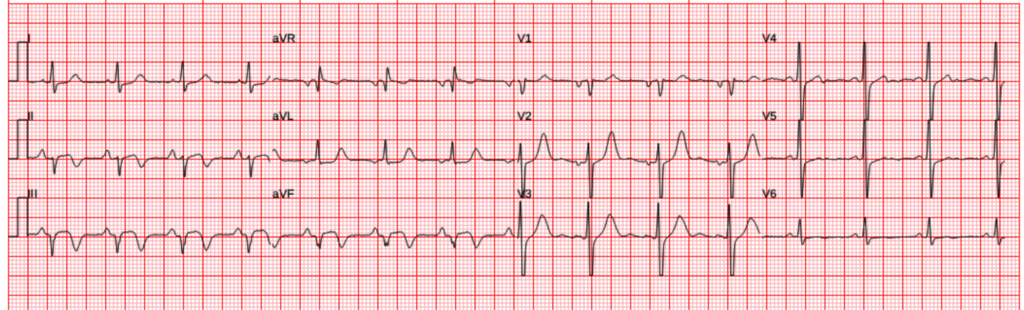
A man in his 40s called EMS for acute “back pain” that started when he “stood up.” A BLS unit arrived and measured normal vital signs and recorded this ECG:
What do you think?
Interpretation: Inferoposterior reperfused OMI. Small persistent STE in inferior leads, reciprocal STD in I, aVL. Reperfusion T wave inversions in inferior leads, and posterior reperfusion T waves in V1-V3 (taller than normal upright anterior T waves). This means that the artery supplying the inferior and posterior walls was recently occluded, but prior to this ECG, the occlusion opened slightly (or collateral circulation was established). At this point, if the angiogram were performed, there would be some flow into the infarct territory, causing the resolution of ACTIVE OMI pattern (during occlusion), and initiation of the REPERFUSION pattern.
When an artery has temporarily reperfused, it can reocclude at any moment. The chances of reocclusion can theoretically be minimized by excellent medical therapy, but prevention of reocclusion cannot be guaranteed.
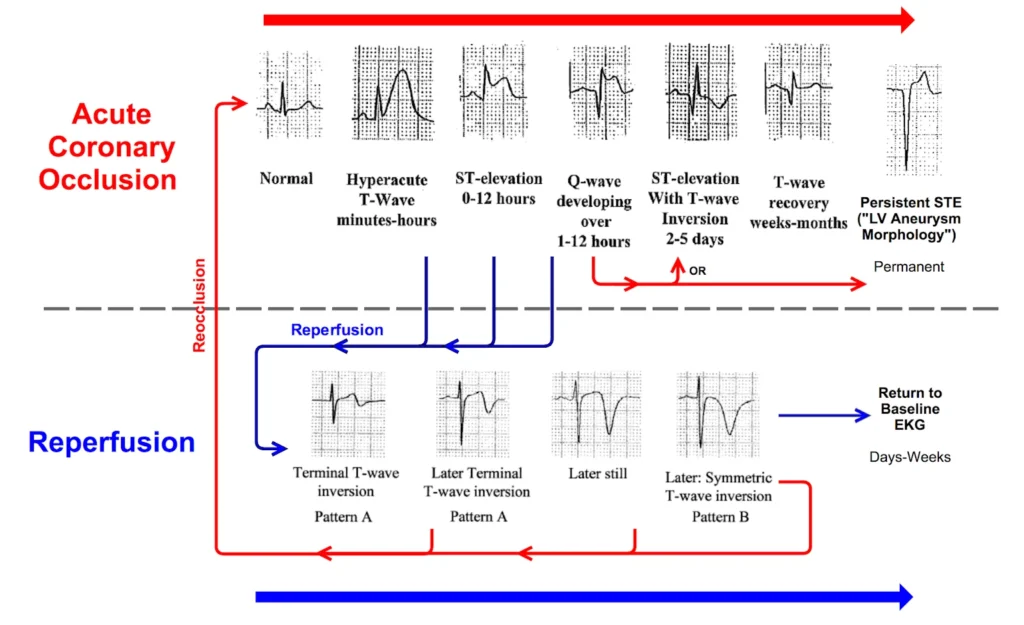
If EMS had PMcardio Queen of Hearts available, this is what they would see:
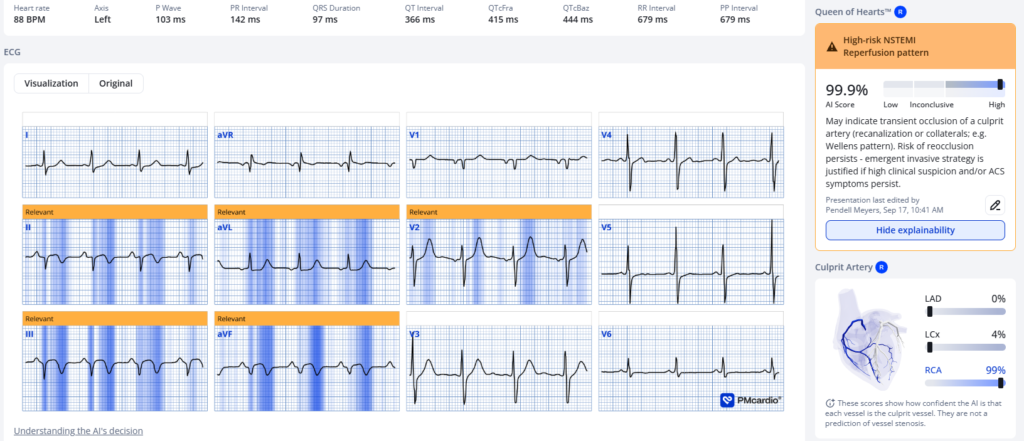
The Queen gets it perfectly correct, with high confidence. The explainability heat map is perfect here. The RCA is the predicted culprit.
Unfortunately, the EMS crew did not have this information, and they reported that the computer algorithm in the EMS cardiac monitor did NOT read “STEMI” or “acute MI”, and because there was “back” pain instead of “chest” pain, and the pain had improved or resolved, they did not send the ECG to a physician for interpretation.
For some reason, the patient refused transport to the hospital. I think it is likely that the discussion was negatively affected by the lack of understanding how diagnostic this ECG is. (the EMS crew would have explained that the patient has a very high chance of adverse outcome, if the situation were properly understood). Thankfully they impressed the advice to call back if the pain returned.
About 90 minutes later, the patient called EMS again for recurrent pain.
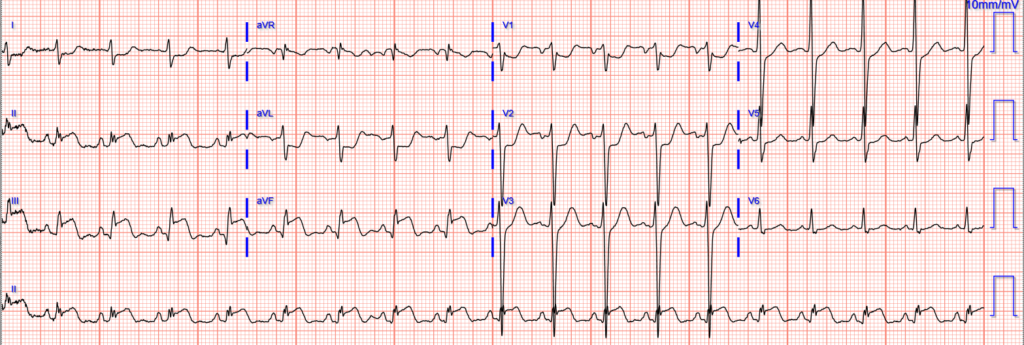
Here was his repeat ECG:
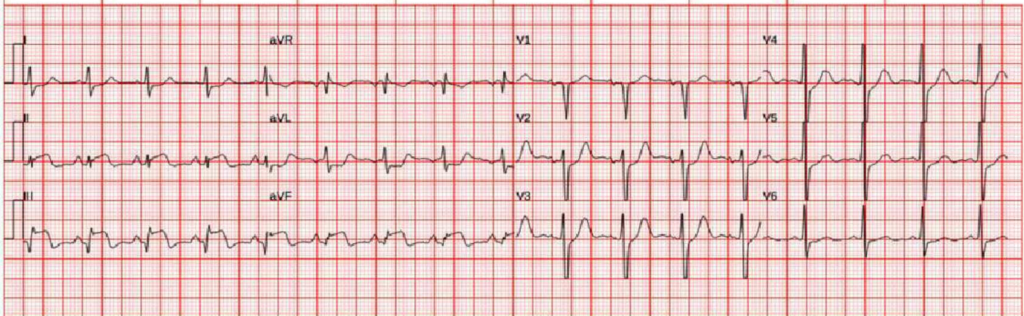
Reocclusion has occurred in the interim.
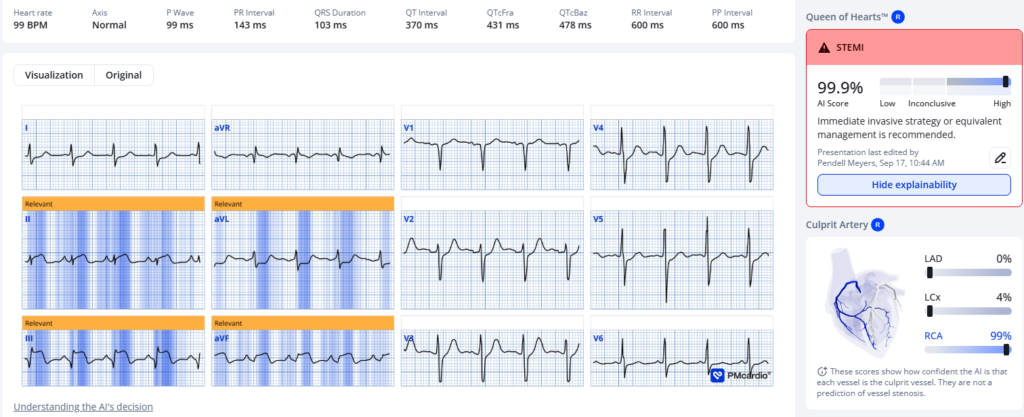
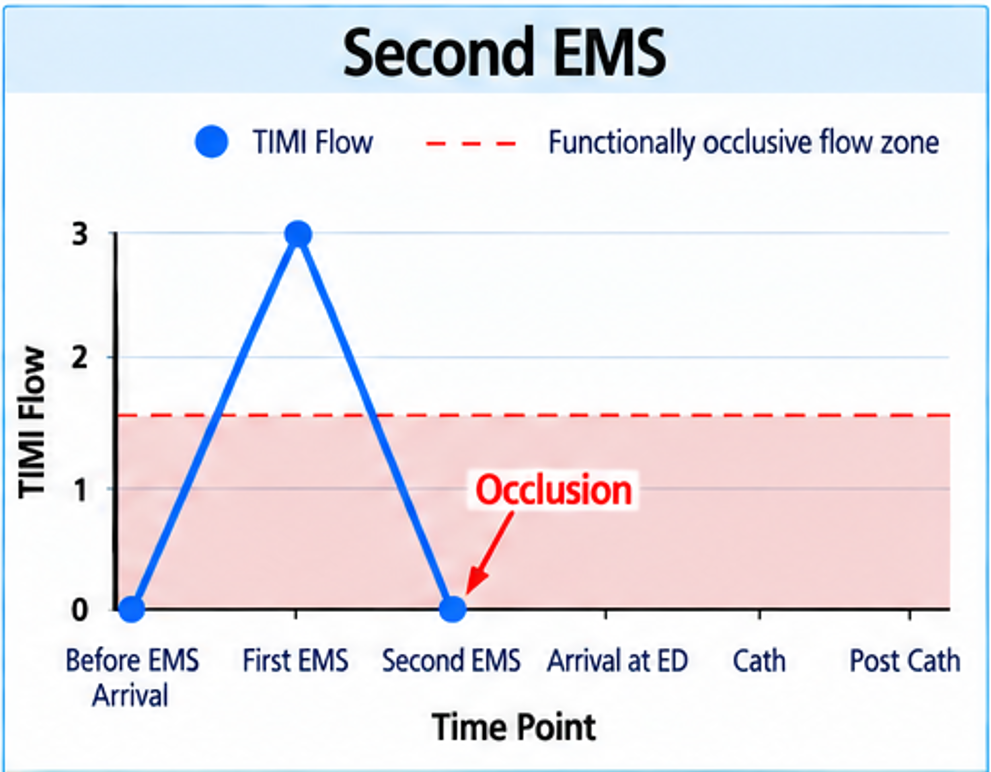
The pain was persistent on arrival to the ED:
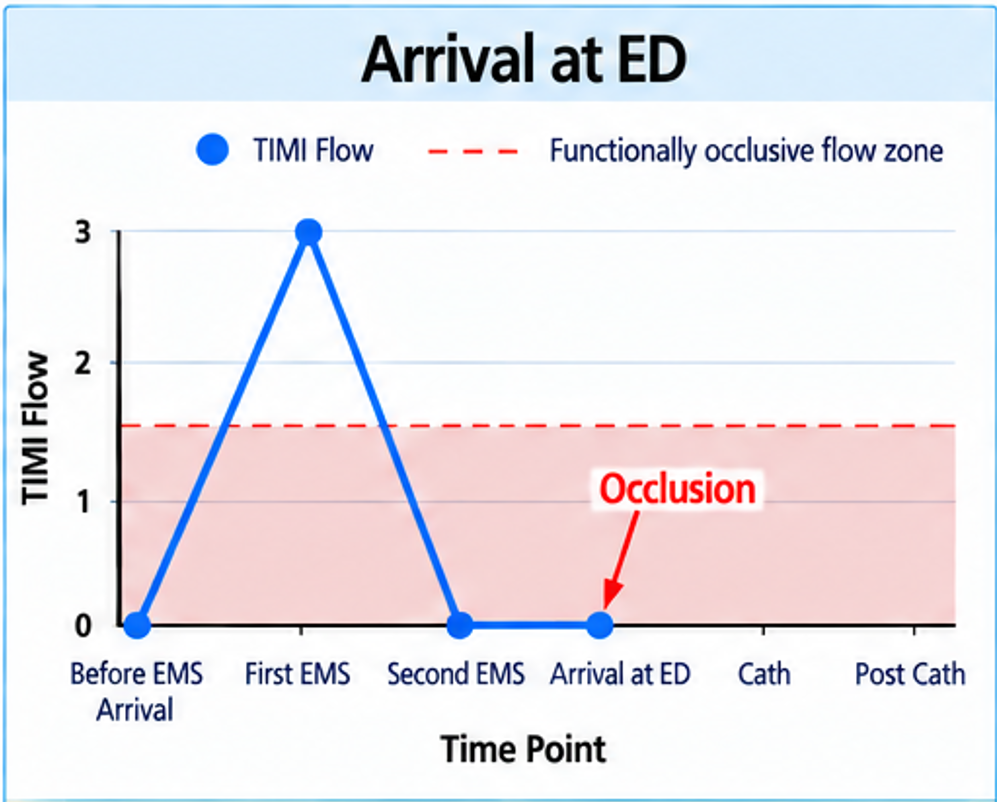
The cath lab was activated, maximal medical therapy was started while waiting for the cath lab, and symptoms had resolved again by the time he arrived in the lab.
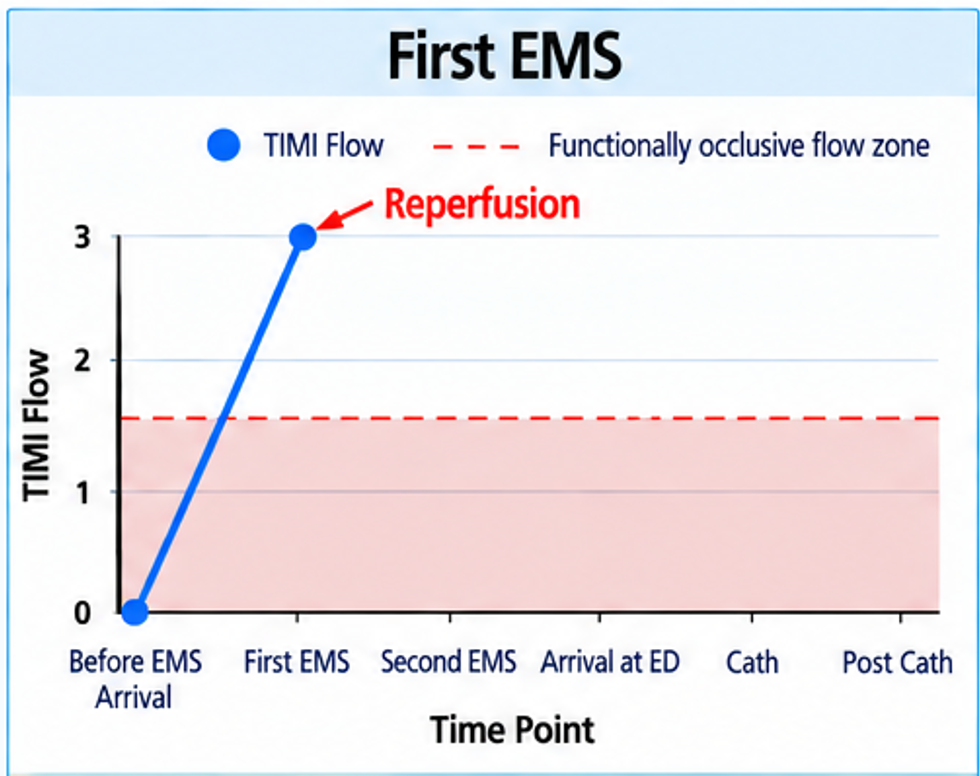
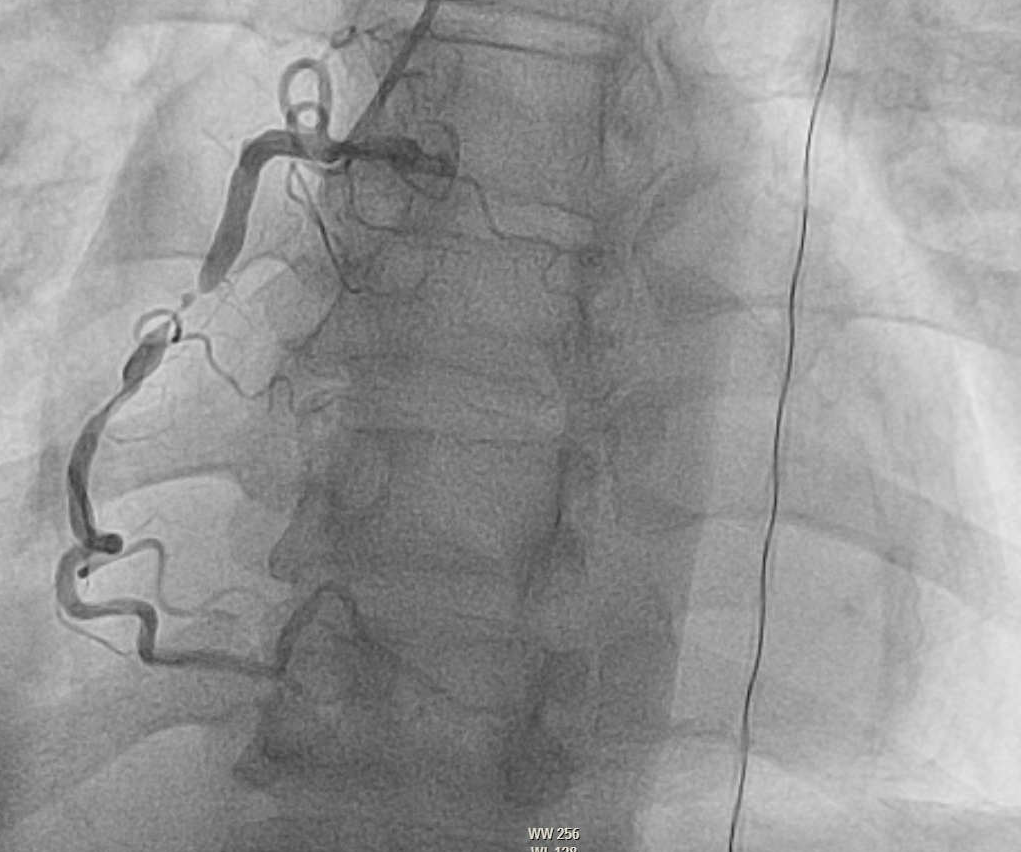
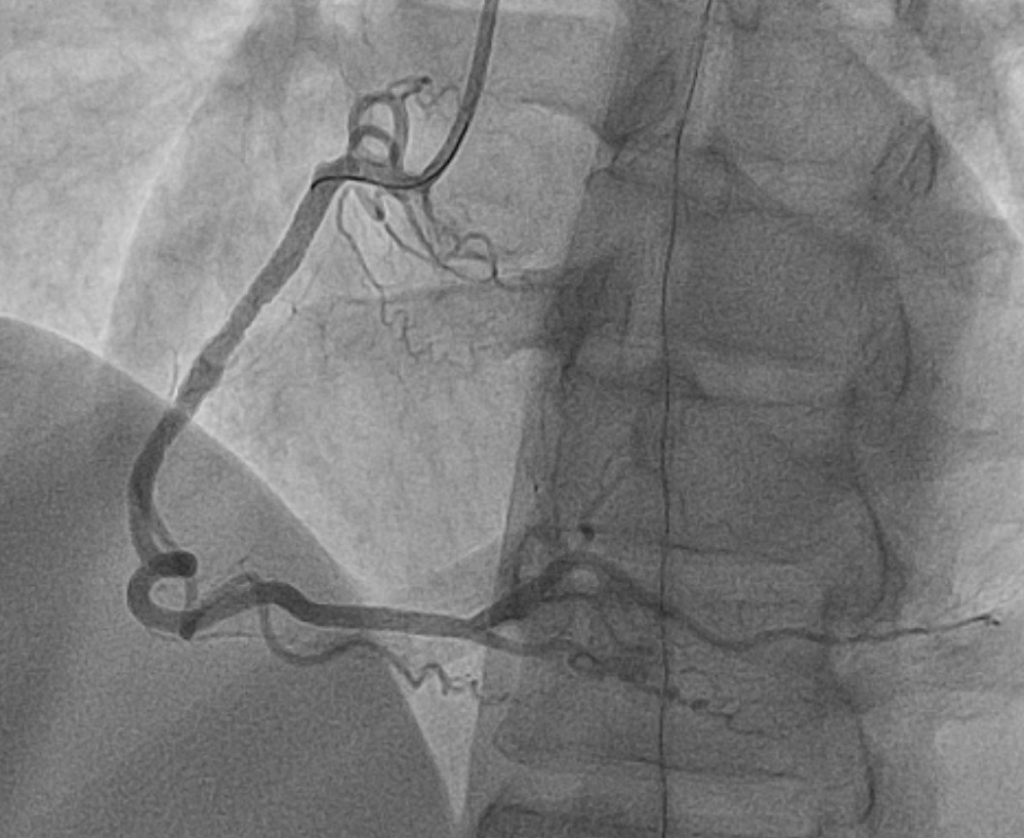
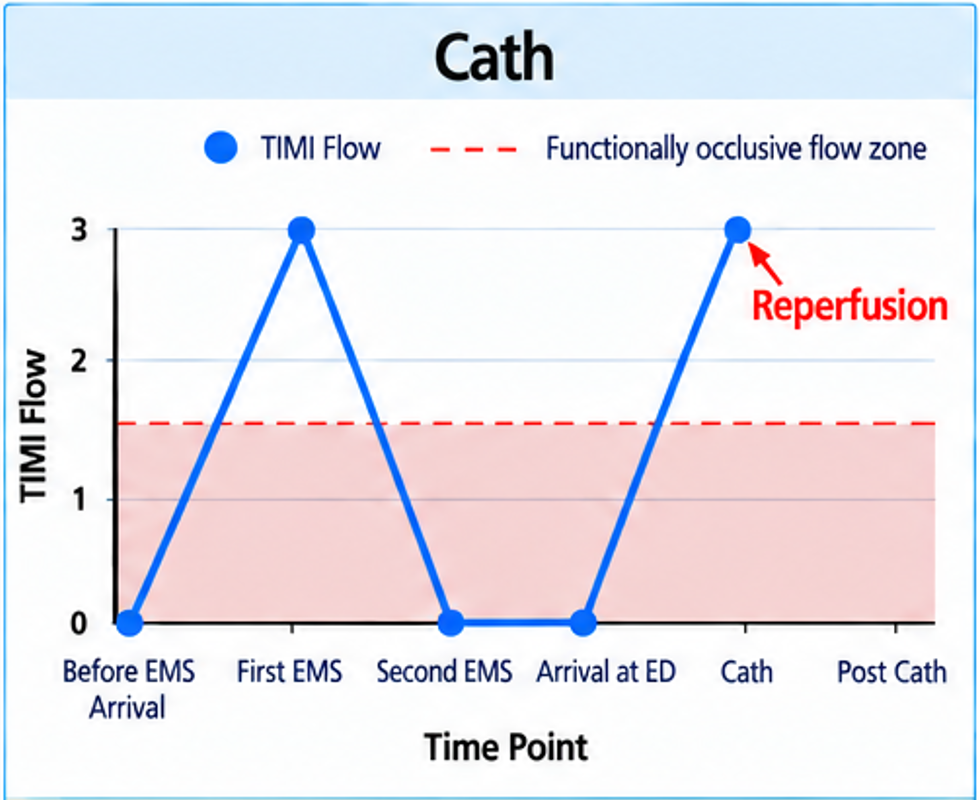
At the time of rapid angiogram, the RCA lesion was judged to have TIMI 3 flow, 99% stenosis:
Post-PCI:
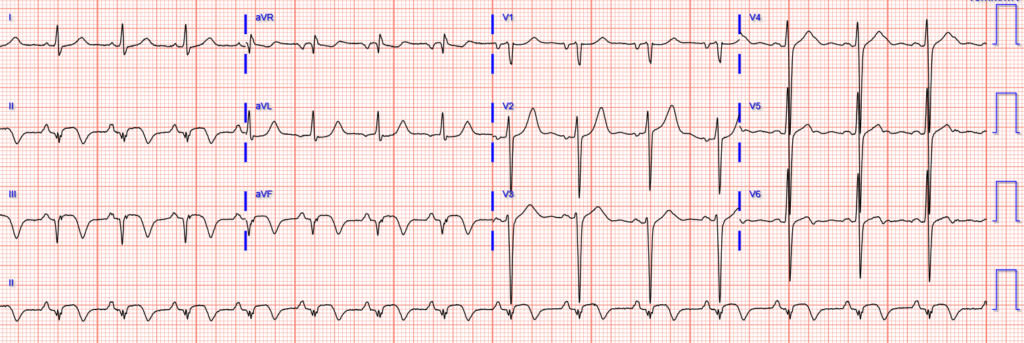
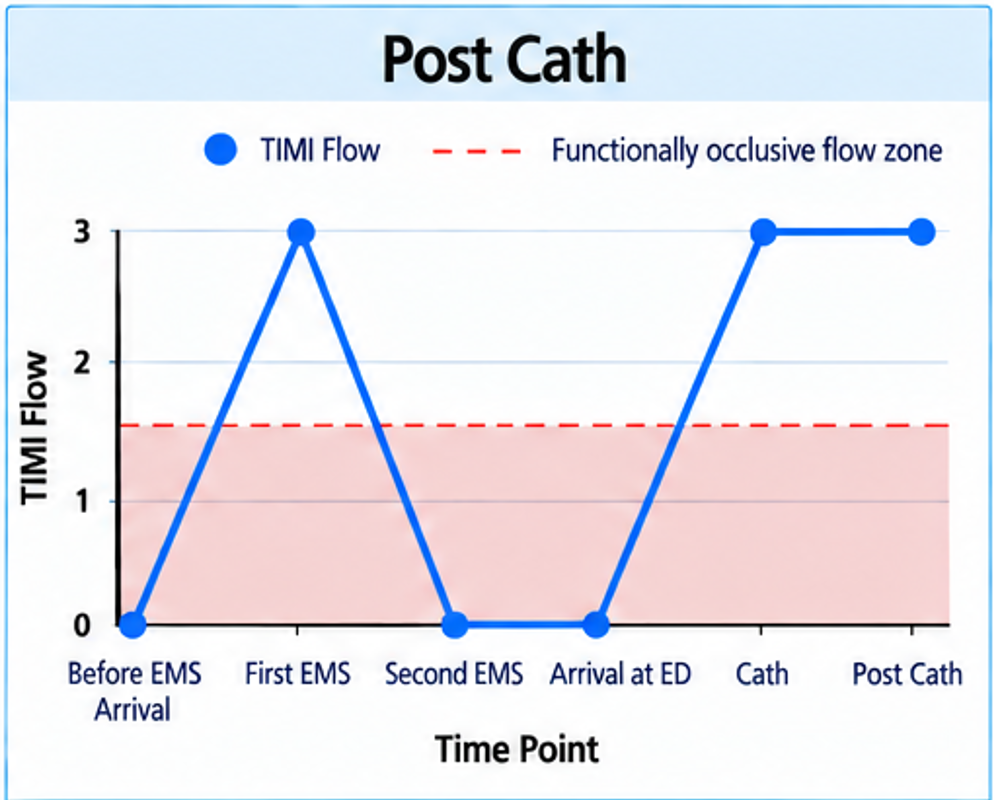
Post-cath ECG back to reperfused:
Troponins (high sens troponin I, URL <20ng/L):
2,552
>25,000
>25,000
(none further measured)
Key Points:
The reperfusion pattern happens in all distributions, and portends high risk for reocclusion without aggressive, immediate therapy.
You must understand how dynamic ACS is. In order to understand the disease well, you must understand the role of the ECG and the reperfusion pattern to understand the disease well. You must understand that the TIMI flow of the lesion changes dynamically during the disease, and therefore the TIMI flow at the time of the angiogram does not tell you the TIMI flow at any other time of the patients course.
Finally, a “99%” stenosis tells you nothing about flow; in this case there was a VERY tight 99% stenosis with good flow. It is the flow, and especially the microvascular flow, which determines ischemia. Stenosis by itself says NOTHING about ischemia.
(Exception: when there is high demand, such as during a stress test, stenosis can prevent the developement of supernormal flow which is necesssary in a high demand environment!)
Even if you respond immediately to reocclusion, the consequences may be terrible. Choosing to change management or deprioritize the patient based on temporary improvement incurs much risk and has little benefit.
Unless you are already as good as our AI ECG Model, consider using it.
= = =
==================================
MY Comment, by KEN GRAUER, MD (9/26/2026):
I found today’s case notable as illustration of how closely patient symptoms may correlate with the state of the “culprit” artery in a patient with an evolving OMI.
- Although certain specifics about the precise timing of events are less than optimally documented in today’s case — the initial ECG performed by EMS at the bedside (shown below in Figure-1) — did correlate with the patient’s “back” pain that had apparently lessened or resolved by the time this 1st tracing was recorded.
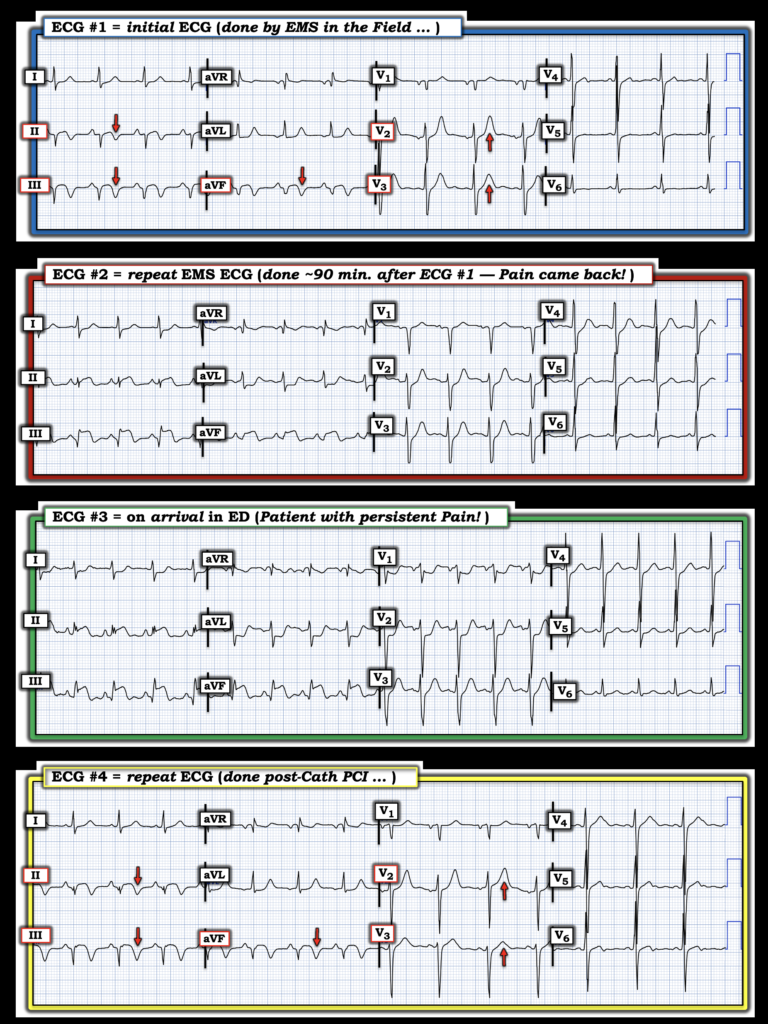
- As per Dr. Meyers — the overall pattern in ECG #1 suggests a recent infero-postero OMI, now with RED arrows highlighting a series of reperfusion T waves (= Deep T wave inversion in the inferior leads — and tall positive T waves in leads V2,V3).
- ST segment coving with residual ST elevation is still seen in leads II,III,aVF.
- Deep Q waves (QS complexes) are seen in each of these inferior leads — suggesting an established infarction that probably began hours (if not longer) ago.
- ST segment flattening is prominent in lead aVL — but the lack of ST depression in this lead supports the premise that the acute event most probably began a good bit earlier.
As per Dr. Meyers — the patient’s symptoms that had prompted him to call EMS presumably decreased or resolved while the EMS team was caring for him, such that the patient ultimately refused transport to the hospital. After the EMS team left — the patient’s pain came back — so he once again called EMS.
- The repeat ECG recorded by EMS on their return to the patient’s home is telling:
- ECG #2 (recorded ~90 minutes after ECG #1) — now highlights the dramatic changes of acute reocclusion of the “culprit” artery. These ECG changes correlate closely with return of the patient’s pain ( = hyperacute ST-T waves with ST elevation in the inferior leads are now seen in association with reciprocal ST depression in lead aVL).
- Observation #1: ST-T wave changes in ECG #2 are more subtle in the chest leads compared to the limb leads. Careful comparison between these first 2 tracings in today’s case does show some increase in J-point depression in leads V2-thru-V5 of ECG #2 (consistent with ongoing posterior OMI). That said — the reason I found this repeat EMS ECG remarkable, is that it underscores differences in the degree of ischemic change that may be seen between different areas of the heart (with the reason for this difference becoming more clear with Observation #3 below).
= = =
Figure-1: I’ve reproduced the 4 ECGs in today’s case. (To improve visualization — I’ve digitized the original ECG using PMcardio).
= = =
The Patient’s Pain Persists …
Comparison between ECG #2 and ECG #3 allows us to see the effect of persistent coronary occlusion — as this patient’s pain continued after arrival in the ED:
- Note further increase in the amount of inferior lead ST elevation in ECG #3. There has also been subtle increase in the angle of the ST segment “takeoff” in leads II,III,aVF — suggesting a greater degree of “hyperacuity”.
- Observation #2: Despite an increase in the amount of inferior lead ST elevation in ECG #3 — the QS complexes that were initially seen in ECG #1 (which was recorded during a period of presumed spontaneous reperfusion) — these QS complexes have now unexpectedly regressed to no more than the relatively small infarction q waves that we see in leads III and aVF ( ==> so much for previous dogma saying Q waves represent a “permanent” manifestation of dead myocardium).
- Meanwhile, the increased amount of reciprocal ST depression in high-lateral leads I and aVL now much better matches the dramatic increase in ST elevation seen in the inferior leads.
- Observation #3: The amount of ST depression in lead V2 has significantly increased in ECG #3 compared to ECG #2. In addition — there is now marked ST depression in lead V1 (that was not present in ECG #2).
- PEARL: ST elevation in right-sided leads (including lead V1) — is often a transient phenomenon with acute RV involvement. This suggests that the lack of ST depression in lead V1 that we saw in ECG #2 in association with the marked limb lead changes in that tracing — was the result of acute RV MI (in which the amount of ST elevation that we would have seen in lead V1 with pure RV MI was attenuated by anterior lead ST depression from simultaneously occurring posterior OMI).
- I suspect that ECG #3 reflects some resolution of transient lead V1 ST elevation from RV MI — now showing a predominant ECG picture of an acute infero-postero OMI.
- Clinically — these evolutionary changes in ECGs #2 and #3 strongly suggest the proximal RCA (rather than the LCx) as the “culprit” artery.
- NOTE: Obtaining right-sided leads at the time ECG #2 was recorded most probably would have confirmed acute RV MI (For more on the “Hows” and “Whys” of right-sided leads — Check out My Comment at the bottom of the page in the July 19, 2020 post in Dr. Smith’s ECG Blog).
= = =
The Pattern Repeats …
The cath lab was activated.
- Once again there was close correlation between patient symptoms and the state of the “culprit” RCA:
- The patient’s pain resolved while awaiting cath lab activation. This resolution of pain correlated with the cath finding of TIMI-3 ( = “normal” ) flow despite the 99% RCA narrowing ==> there once again must have been at least some spontaneous reperfusion of the “culprit” artery just before PCI was performed.
- This cath finding of TIMI-3 flow despite 99% narrowing of the proximal RCA correlates with the findings in ECG #4 — that again shows similar reperfusion T waves in the inferior leads and in lead V2 as we saw in today’s initial ECG. In addition — the reciprocal high-lateral lead ST depression and the ST depression in lead V1 that was seen in ECG #3 — have both almost completely resolved.
= = =
Summary Reflections on Today’s CASE:
- The sequential serial ECG changes in Figure-1 nicely illustrate clinical correlation between this patient’s waxing and waning pain and the state of the “culprit” RCA during the stuttering course of this patient’s acute OMI.
- Confirmation of this correlation was forthcoming by the unexpected finding on cath of at least some flow despite 99% narrowing of the proximal RCA (PCI still being desperately needed because of the marked stenosis).
- Isn’t it satisfying when we can put together a clinical story that explains each step in the series of dramatic ECG changes that are sequentially seen in Figure-1?
- P.S.: It’s good to be aware that in the stuttering, waxing and waning course that may be seen during acute OMI evolution (ie, when there are cycles of spontaneous reperfusion alternating with reocclusion) — marked ECG changes may sometimes occur quickly!
= = =
= = =