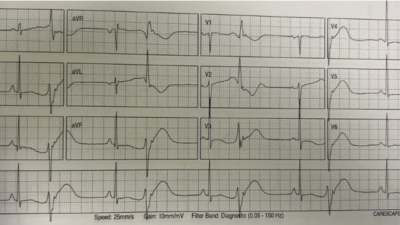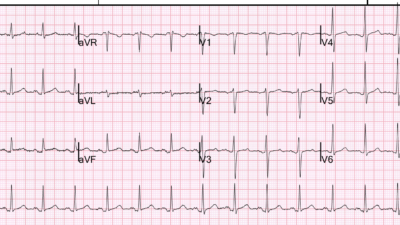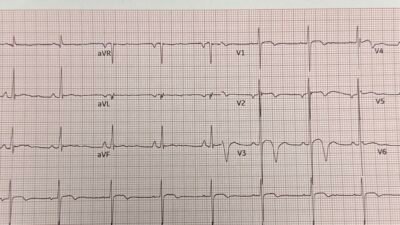
Steve published this fantastic post 16 years ago which compares 2 important types of abnormally large T-waves.
We can look back at this post and see: what we taught to you then, we can finally now quantify, objectify, and (with AI) allow anyone with any level of training to detect and differentiate both life threatening patterns.
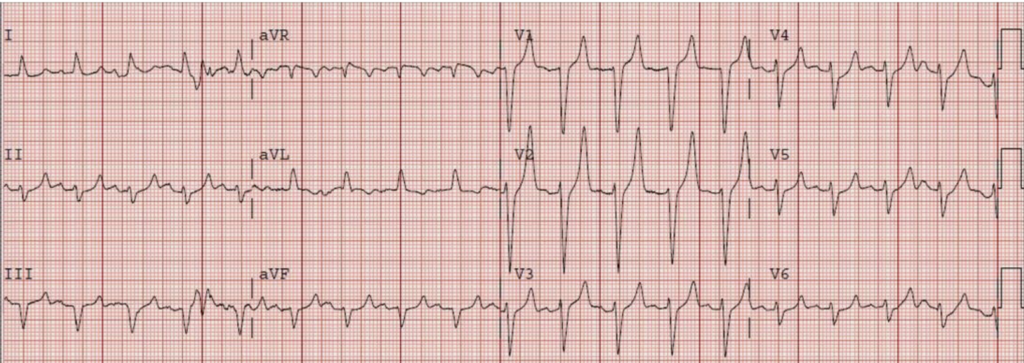
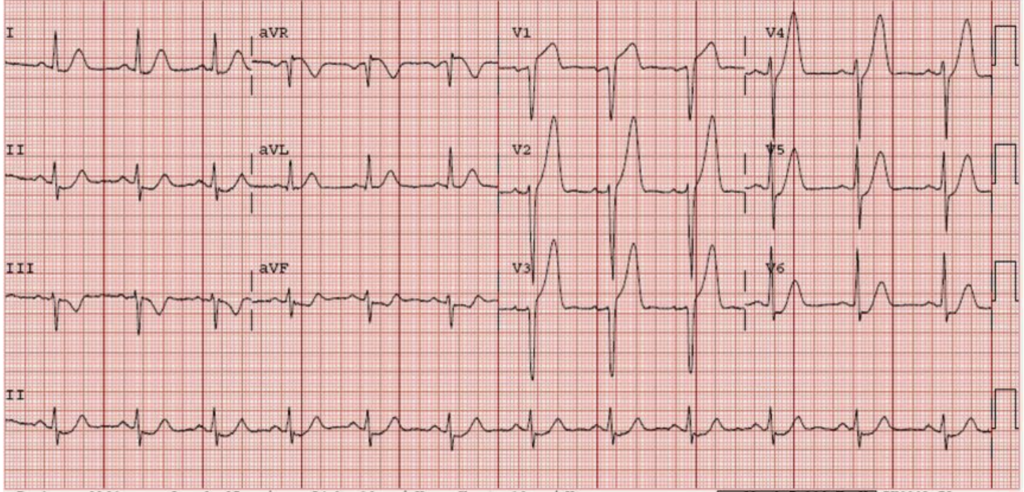
Here are two of the ECGs below, without giving away the diagnosis yet. (there are a couple other fascinating ones at the post that you should also see!):
ECG#1:
ECG#2:
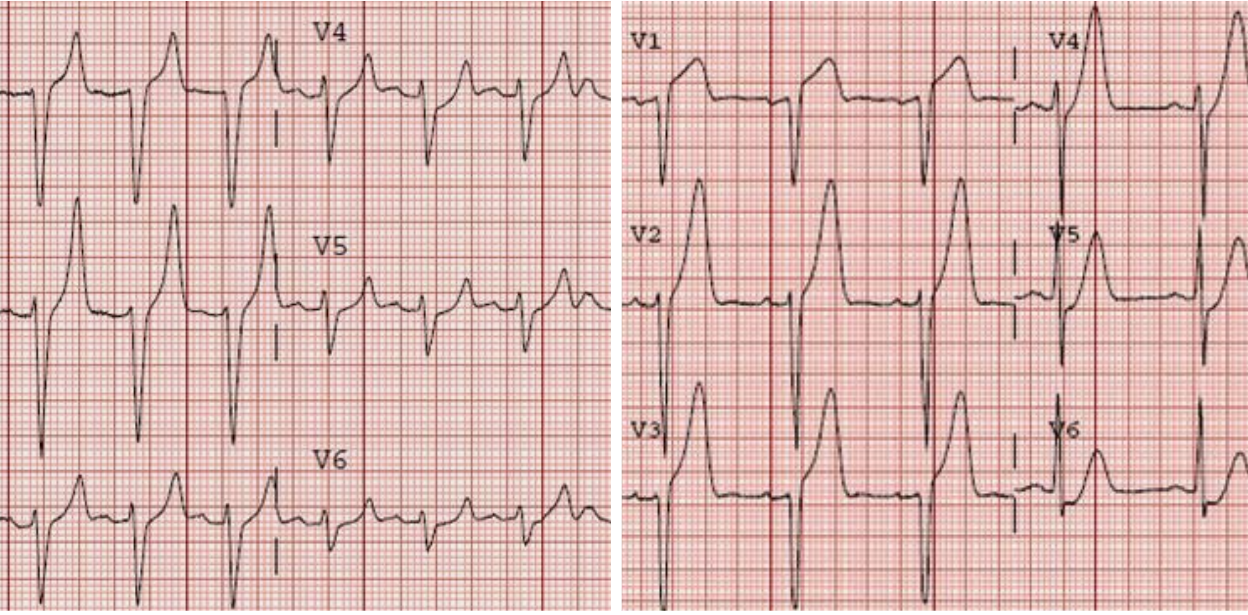
Here are the precordial leads side by side:
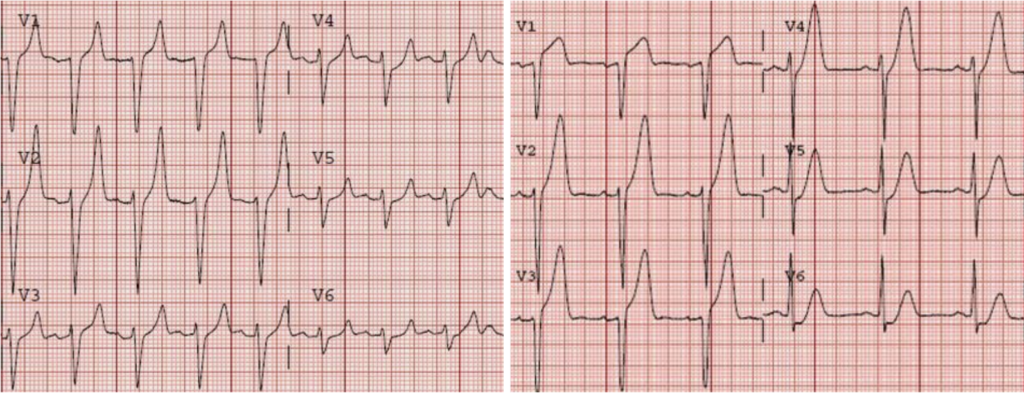
From what condition are each of these patients suffering? Can you easily diagnose them both and save their lives?
And can you distinguish these from the hordes of normal patients with normal large baseline T waves that have neither of these specific patterns above?
If you have been reading this blog all along, yes you can. But you are in the extreme minority of clinicians. Thankfully now AI can do it too.
Both hyperacute and hyperkalemic T waves can be “enlarged” and more symmetric than the patients’ baseline T waves. However T wave height or amplitude does not define EITHER of them, nor differentiate them from normal variant T waves.
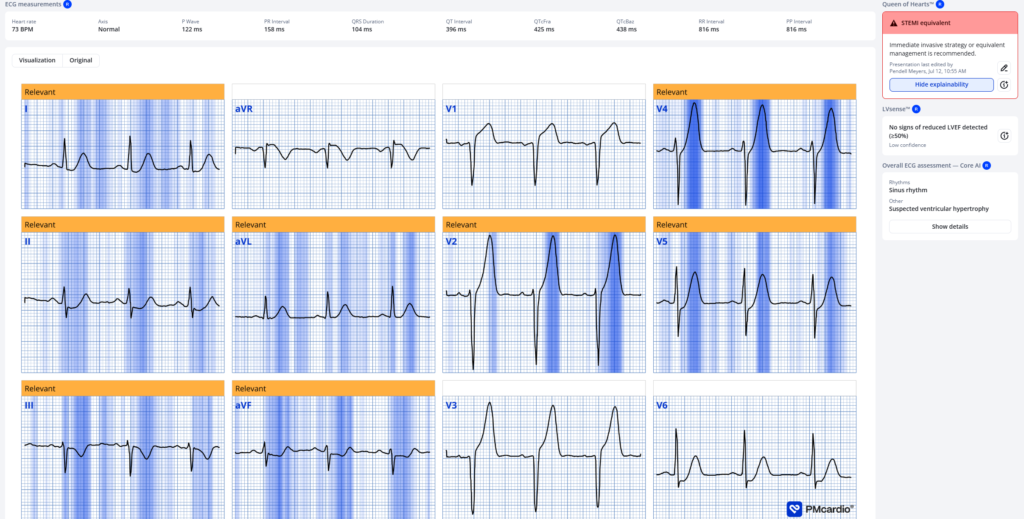
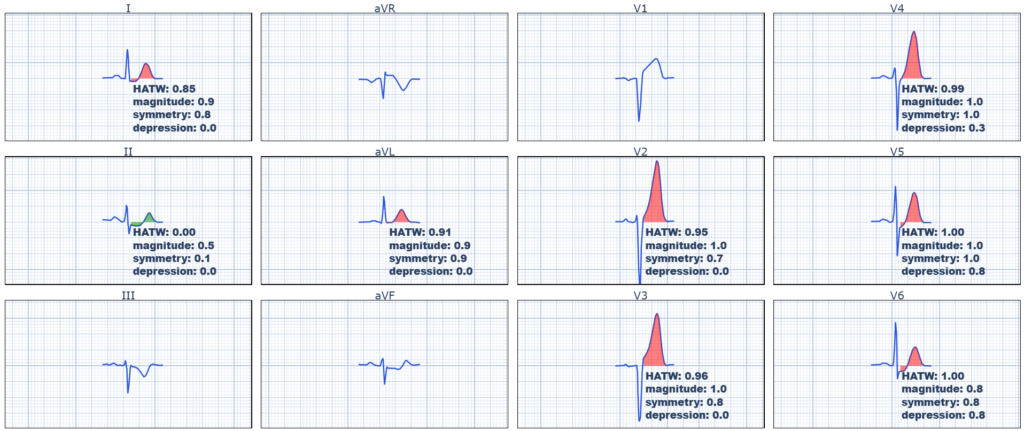
We have published the highest quality research to date on what defines hyperacute T waves (HATW) as a highly specific pattern of acute coronary occlusion, even in the absence of “diagnostic” ST elevation. We showed that hyperacute T waves are defined by:
Increased “magnitude” and increased “symmetry”.
Here is the reference: Meyers HP, Simančík F, Herman R, et al. Hyperacute T Waves are specific for Occlusion Myocardial Infarction, even without diagnostic ST elevation. JACC Adv [Internet] 2025;(102120):102120. Available from: http://dx.doi.org/10.1016/j.jacadv.2025.102120
T wave magnitude is a function of its Area under the entire T-wave “curve” relative to its preceding QRS amplitude [how big (large, inflated, bulky, only part of which is affected by height or amplitude) it is compared to the QRS complex that made it]. Normal T waves have smaller magnitude, while HATW have bigger magnitude.
T wave symmetry is a function of when the T wave peak occurs along the entire ST-T interval. Normal T waves are “pushed to the right”, meaning their peak occurs later in the ST-T interval (usually much later than 50%), while HATW have increased symmetry (the peak is moved to earlier in the interval, sometimes literally around 50% of the interval).
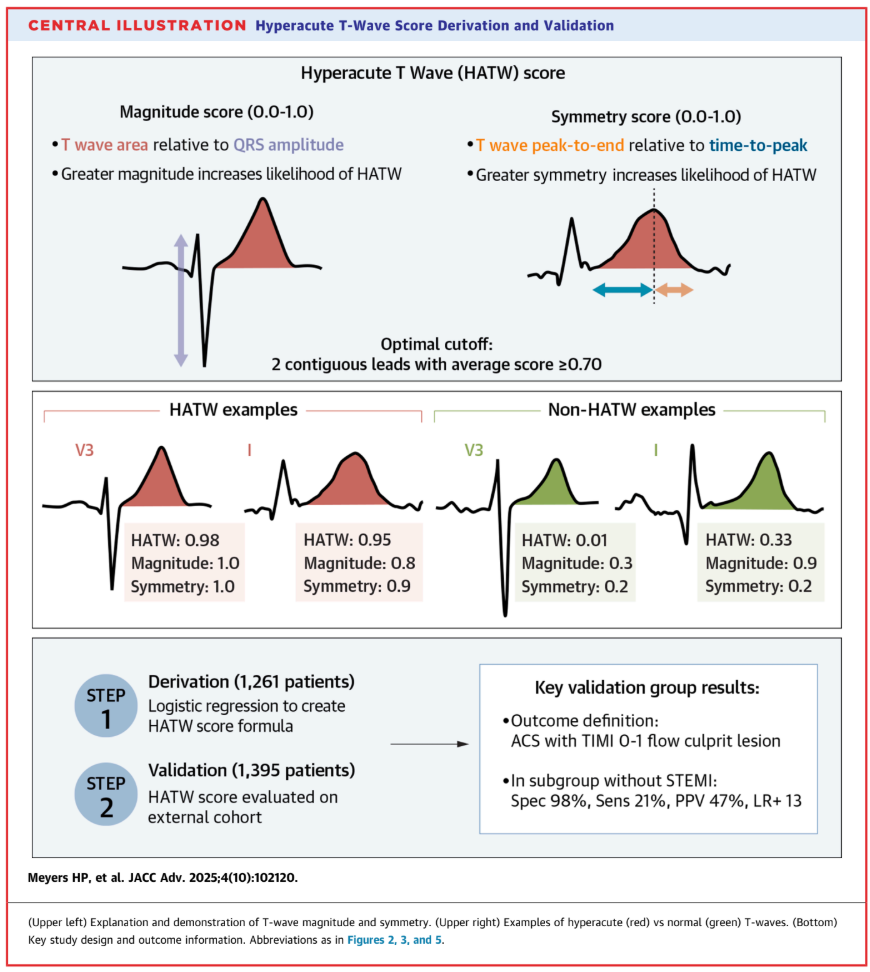
Finally, if you simply take a HATW by the definitions above, and you ADD ST segment depression in the same lead, then that makes it the famous TINY subset of HATW known as “de Winter” hyperacute T waves.
Hyperkalemic T waves, while they also have increased symmetry compared to the patient’s baseline, are usually exactly opposite when it comes to magnitude: hyperkalemic T waves have dramatically decreased T wave area compared to HATW.
When I teach this visual skill to my learners, I describe them like this:
HATW:
Like you’re inflating the T wave with air from below
Hyperkalemic:
Like you’re pitching a tent in the T wave by pushing a pole up in the middle
I think I stole this next part from Ken Grauer:
I also describe hyperkalemic T waves as like the Eiffel tower, while HATWs are like the US Capitol building (admittedly, after you cut off the very top part…).
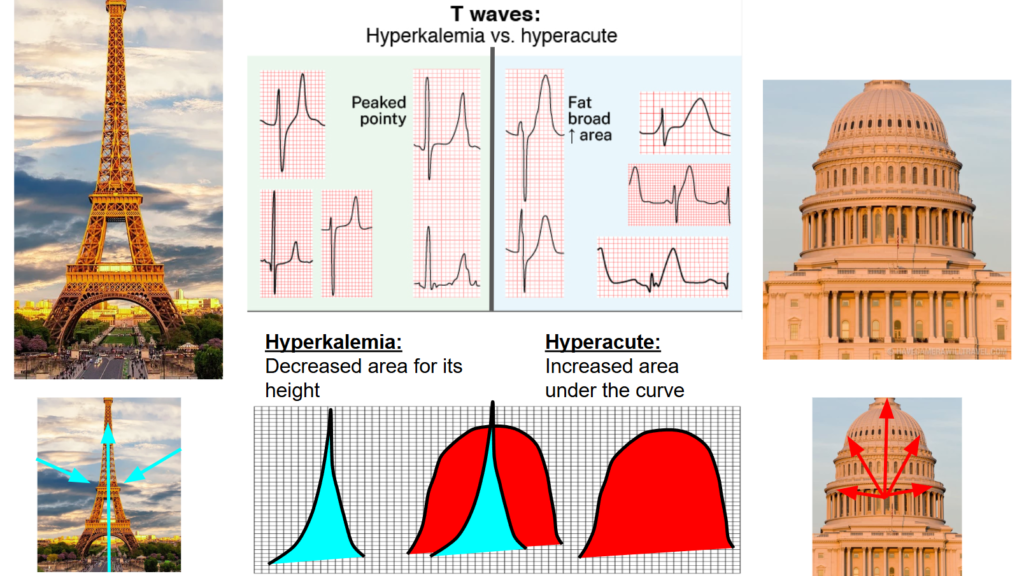
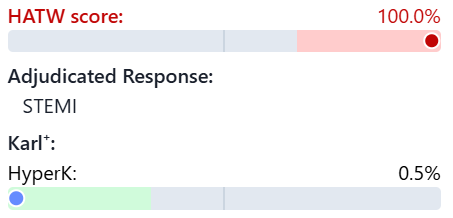
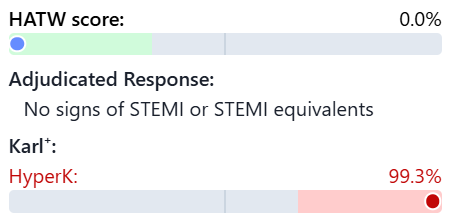
So here are the “answers” to the cases above:
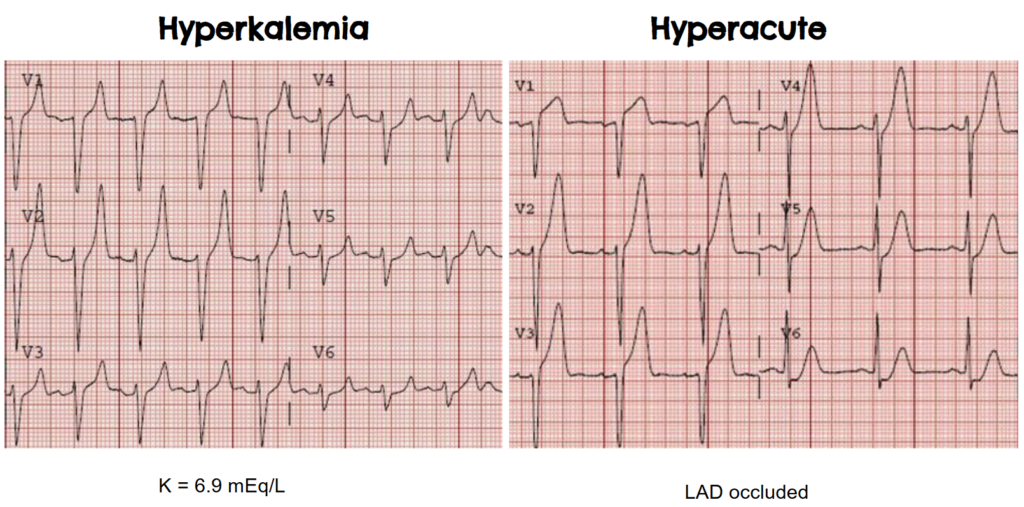
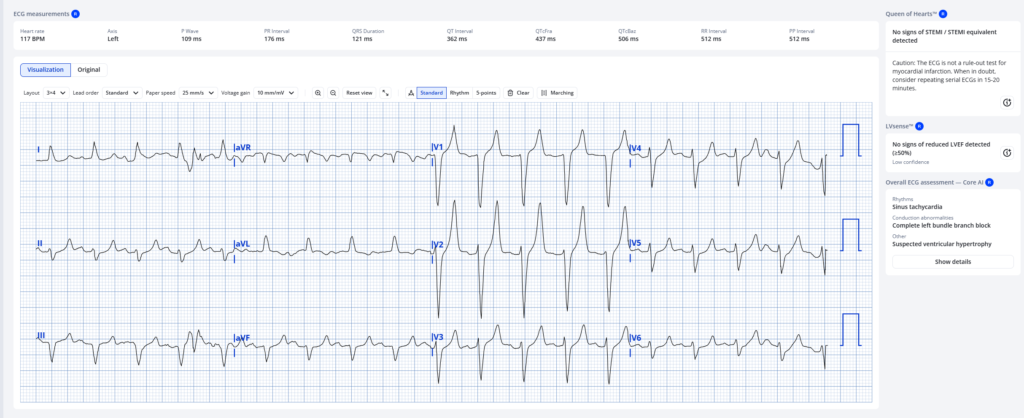
See how both the Queen of Hearts and our objective HATW formula are easily able to distinguish them, and also how our upcoming hyperkalemia model (Nicknamed “Karl”) can too.
Now for the hyperkalemia ECG:
= = =
==================================
MY Comment, by KEN GRAUER, MD (7/17/2026):
I find it intriguing and illuminating to go back and review what we thought in the past — and what we’ve learned with the years that have passed. When the opportunity to do so arises (as it occasionally does when I encounter a case in which years earlier, I interpreted a prior ECG on the case I am currently reviewing) — I often find it humbling to see what I thought in years past (and sometimes I marvel at how little I knew then — and how much I have since learned).
- And so — I found it interesting to go back to the January 12, 2010 post by Dr. Smith that Dr. Meyers reviews in today’s case. Sure enough — what Dr. Smith wrote 16 years ago (based on his uncanny interpretation skills enhanced by his ECG intuition) — has now been verified and quantified by Smith/Meyers research and contribution to development of the QOH (Queen-Of-Hearts) AI model.
= = =
Taking Another Look …
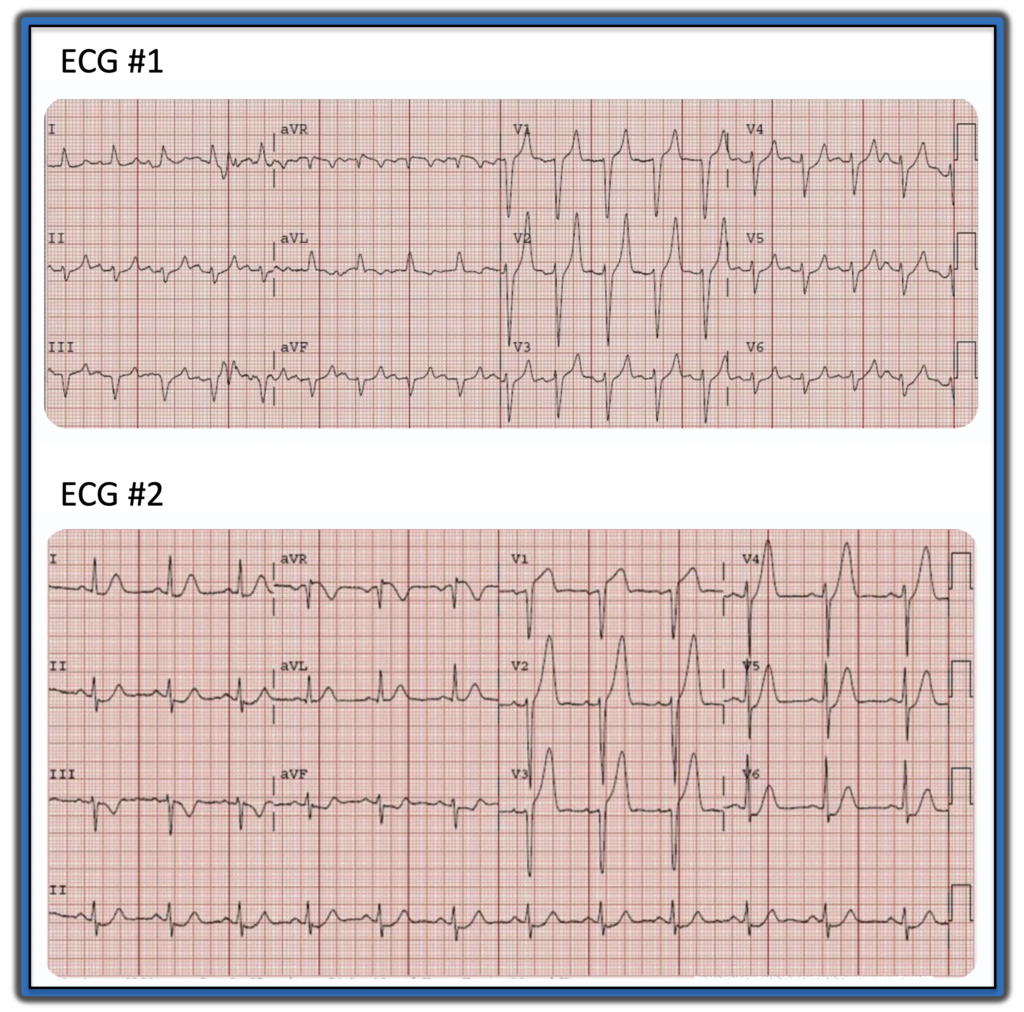
I’ve reproduced below in Figure-1 — the 2 ECGs that Dr. Meyers uses to initiate his discussion.
- As noted by Dr. Meyers — I popularized the concept of Eiffel-Tower T waves in the early 1980s. I initially compared the image of “tall, peaked, pointed T waves” to the shape of the Empire State Building. But I soon realized that the tapering look of the Eiffel Tower much more closely approached the T wave appearance of “textbook hyperkalemia”, with symmetric ascending and descending T wave limbs that finish with a surprisingly narrow T wave base. I find this narrow T wave base to be equally characteristic of hyperkalemia as is the T wave peaking. These features are clearly present in ECG #1.
- NOTE: I’ve learned all too well since the early 1980s that many patients with hyperkalemia “fail to read the textbook” — such that the T wave picture in ECG #1 is not always found with K+ elevation.
ECG #2 conveys a number of important lessons. These include the following:
- There is no substitute for side-to-side comparison when assessing serial ECGs. I prove this to myself every time that I take the “shortcut” of quickly looking first at one tracing, and then at the next without placing them side-by-side as we do in Figure-1.
- Isn’t it so much easier to appreciate the difference in ST-T wave morphology when we put ECGs #1 and #2 together in Figure-1? Doing so allows our eye to immediately appreciate the “fatter” T wave peak and “bulkier” look with wider T wave base in so many of the leads in ECG #2.
- Side-by-side comparison of the 2 tracings in Figure-1 also allows us to immediately appreciate the downsloping reciprocal ST depression in each of the inferior leads in ECG #2 that is not seen in ECG #1.
- The above said — When I first looked at ECG #2, I was not initially certain that this tracing represented an acute OMI until I focused on lead V1! Whereas all leads in ECG #1 show tall pointed T waves with narrow base — lead V1 in ECG #2 is distinct in showing marked ST segment straightening with disproportionate ST elevation (basing “disproportionality” on the amount of J-point ST elevation considering modest depth of the S wave in this V1 lead). Any sliver of doubt that I may have had about the acuity of the process in ECG #2 was instantly removed on seeing this ST-T wave in lead V1.
- PEARL: Once you identify ST-T wave changes in 1 or 2 leads that you know are truly abnormal — it becomes much easier to recognize less marked abnormalities in other leads.
- In the context of this marked ST elevation in lead V1 — the lesser amount of ST elevation in leads V2 and V3 is significant.
- J-point ST depression begins in lead V4 — and progressively increases until we see marked, flattened ST depression in lead V6.
- There is loss of R wave as we move from lead V2-to-V3.
- All chest leads show hyperacute T waves — with marked “fattening” of the T waves in leads V5,V6.
- Hyperacute T waves are seen in high-lateral leads I and aVL (These T waves being much “fatter”-at-their-peak and wider-at-their-base then expected) — with some ST depression also seen in lead I.
- As previously noted — there is reciprocal ST depression in each of the inferior leads (with marked terminal T wave positivity in leads II and aVF).
- There is ST elevation in lead aVR.
- Conclusion: Marked ST-T wave abnormalities are seen in all 12 leads of ECG #2. This tracing is diagnostic of extensive, ongoing infarction from acute proximal LAD occlusion (showing deWinter T waves + subendocardial ischemia).
= = =
Figure-1: I’ve reproduced the first 2 ECGs in today’s case.
= = =
= = =