This is the first post on our new blogger, WordPress. Notice that the URL is different from before (drsmithsecgblog.com). We’re hoping this will give you a better experience, as the old Google Blogspot was no longer supported by Google and had very bad search characteristics.
This case came from Drs. Luca Sala and Paolo Villa from a public hospital (Ospedale Luigi Sacco) in Milan Italy.
CASE
A 60-something male presented with one hour of “oppressive” chest pain radiating to the back and to the left arm. He has a history of diabetes and COPD.
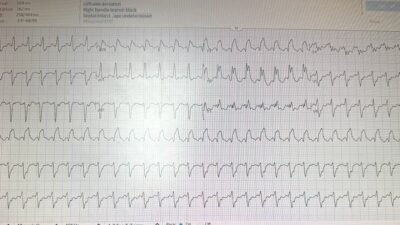
This ECG was recorded:

There is at most 0.5 mm ST Elevation in V2 and V3, but there are hyperacute T-waves in V2-V4. There is terminal QRS distortion, meaning that there are no S-wave or J-waves in EITHER V2 or V3 (in this case, none in BOTH V2 and V3, which is even more worrisome).
Whenever you are in doubt about hyperacute T-wave in V2, look at inferior leads for any ST depression or “down-up” T-waves. Lead II has ST depression. Lead III has STD with down-up T-wave, as does aVF. There is also minimal STE in aVL.
So this ECG is diagnostic of proximal LAD Occlusion.
The physicians state they used the Queen of Hearts but that they obtained “No OMI”.
We discovered the reason: they had used an older version of PMCardio. All new versions identify this as OMI.
I ran it through the most recent versions of BOTH PMCardio for Individuals AND PMCardio for Organizations and this was the result:

She says “OMI” for the same reasons that I do.
The newest version, which is not available to the public, had extremely high probability of OMI.
New PMcardio for Individuals App 3.0 now includes the latest Queen of Hearts model and AI explainability (blue heatmaps)! Download now for iOS or Android. https://www.powerfulmedical.com/pmcardio-individuals/ (Drs. Smith and Meyers trained the AI Model and are shareholders in Powerful Medical.)
Nevertheless, the physicians were almost certain of OMI, so they called cardiology. The on-call cardiologist performed a bedside echo immediately and found wall motion abnormalities of the apex and septum, with EF 40%.
They immediately activated the cath lab, with very little delay and without waiting for troponin.
Note: Waiting for troponin results in excess loss of myocardium!! Many trials of emergent vs. delayed intervention for NSTEMI show no difference because they wait for troponin to decide if the patient has an acute MI (and therefore Non-ST-Elevation MI — NSTEMI) and so do not intervene until usually 6 hours after pain onset. Nearly all of the benefit of reperfusion is lost by 6 hours. This is why you need expert ECG interpretation to diagnose acute MI without ST Elevation — or use the Queen of Hearts.
At angiogram, they found a 99% culprit lesion with TIMI-3 (perfect) flow and it was stented.

Note: Does TIMI-3 flow mean that there was no occlusion? No!! Fully 20% of cases in which everyone agrees that “STEMI” is present (meeting ST Elevation millimeter criteria) have TIMI-3 flow by the time of angiogram. This is due to spontaneous reperfusion (recanalization) between the time of the ECG and the time of the angiogram.
The peak troponin T was 1055 ng/L, which due to very fast intervention is quite a limited infarct given the very large amount of myocardium at risk.
Here is the ECG after the PCI (digitized by PMCardio):

And the next day:

These T-wave inversions in V2-V6 are “terminal T-wave inversion” or biphasic, and are analogous to Wellens “Pattern A” waves. This is diagnostic of reperfusion (the Queen says “reperfusion of the LAD”) in the most up-to-date algorithm.
This is excellent OMI care. They recognized hyperacute T-waves. They used the Queen of Hearts, but an out-of-date version, and in spite of the fact that she said “Not OMI”, they called cardiology and an echo showed a new wall motion abnormality. So they diagnosed OMI not only based on the ECG, but also on Echo. Notice that ST Elevation had nothing to do with the diagnosis of OMI. Nor did Troponin. They delivered the patient to the cath lab very quickly. Fortunately for the patient, the LAD spontaneously reperfused before they could open it, but it would have been quickly opened even if it needed intervention to do so. The patient had a limited infarct size and is unlikely to have heart failure because of this.
======================================
MY Comment, by KEN GRAUER, MD (6/27/2025):
Today’s case is gratifying, because as per Dr. Smith — the diagosis of acute OMI with need for prompt cath was quickly made. CREDIT to Drs. Sala and Villa!
- Regardless of whether or not STEMI criteria were met — the important point is to recognize that today’s initial ECG is clearly diagnostic of acute proximal LAD OMI.
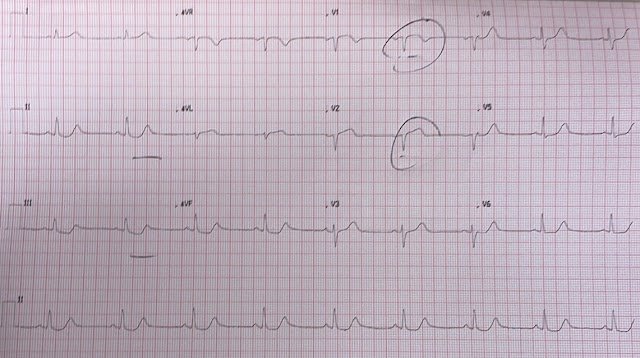
Today’s Initial ECG:To facilitate rapid recognition of the need for prompt cath — I’ve labeled KEY findings in Figure-1.
- As per Dr. Smith — nearly all the benefit of reperfusion is lost by 6 hours. It is for this reason that cases such as the one presented today by Drs. Sala and Villa should be recognized within seconds of seeing an initial ECG like the tracing shown in Figure-1.
- Rapid recognition begins with the history. Knowing the patient is a 60-something man with known diabetes and COPD (therefore presumably a longterm smoker) — who presented with 1 hour of “oppressive” CP (Chest Pain) — instantly places this patient in a higher-risk group for having an acute cardiac event (ie, Our “threshold” for activating the cath lab should be lowered — so as to include not only diagnostic ECG findings, but also those ECG findings that are somewhat less certain, but still suspicious for OMI).
ECG #1 — shows sinus rhythm — normal intervals — a leftward axis (but not negative enough to qualify as LAHB — because the QRS is predominantly positive in lead II, therefore an axis of less than -30 degrees).
- Overall QRS amplitude is reduced, especially in the chest leads where none of the 6 leads manifests an amplitude greater than 7 mm. Whether this overall reduction in QRS amplitude is the result of body habitus, the patient’s COPD — and/or reduced QRS amplitude as a result of cardiac stunning in association with acute infarction, is uncertain from this single tracing.
- Transition occurs surprisingly early (ie, The QRS becomes all positive as soon as in lead V2). The reason (and potential significance) of this unusual finding is uncertain — but important to appreciate in our assessment of ST-T wave appearance in anterior leads.
- The above said — my “eye” was immediately drawn to the ST-T waves in leads V2 and V3 (within the RED rectangle). That the T waves in both of these leads are hyperacute — should be recognized by the disproportionately enlarged T wave dimensions compared to the tiny QRS amplitudes in V2,V3.
- As noted by Dr. Smith — both leads V2 and V3 manifest T-QRS-D (Terminal QRS Distortion), because neither lead has a J-point or an S wave that descends below the baseline (See My Comment in the November 14, 2019 post in Dr. Smith’s ECG Blog for more on T-QRS-D).
To Emphasize: In this higher-risk patient with severe, new CP — the abnormal ECG findings within the RED rectangle in Figure-1 would be enough to justify prompt cath lab activation. But there is lots more that is abnormal on this initial ECG.
- In the context of the above described definitely abnormal ST-T waves in leads V2,V3 — Neighboring leads V1 and V4 are also clearly abnormal. The slight ST elevation with ST segment straightening, disproportionately prominent postive T wave with subtle terminal T wave negativity in lead V1 — is not normal for the ST-T wave appearance in this lead.
- By itself — I might not interpret the T wave in lead V4 as hyperacute. But in the context of definite hyperacuity with T-QRS-D in leads V2,V3 — the T wave in V4 is surprisingly tall, and both “fatter”-at-its-peak and wider-at-its-base than expected given modest R wave amplitude in this lead.
- Reciprocal changes are seen in each of the inferior leads. Light BLUE arrows highlight ST segment flattening in leads II,III,aVF — with slight ST depression in III and aVF — and (as emphasized by Dr. Smith), with telltale terminal T wave positivity (darker BLUE arrows) that supports an ongoing acute cardiac event.
- Finally— Lead aVL provides an excellent example of subtlety that by itself would not be significant — but which in the context of acute anterior chest lead findings + reciprocal ST-T wave changes in all inferior leads — confirms an acute event. That is, the shape of the ST-T wave in lead aVL is coved and ever-so-slightly elevated.
- PEARL: A proximal LAD location is suggested for this OMI because: i) An acute ST-T wave appearance begins with lead V1; ii) There are reciprocal ST-T wave changes in the inferior leads; and, iii) Lead aVL shows slight-but-real ST segment coving with ever-so-slight ST elevation.

======================================