A middle aged male presented with acute chest pain. He was seen by Emily Dawra, one of our 2nd year EM residents, about to become 3rd year in 3 days.

What do you think?
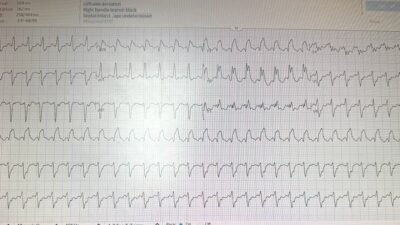
This ECG is diagnostic of LAD occlusion and Emily immediately recognized it, as she has become very good at recognizing OMI that has little if any ST Elevation.
Explanation: There is subtle STE in V1, a very hyperacute T-wave (HATW) in V2, and subtle HATW’s in V3-V6. There is ST depression in V5 and V6. ANY ST depression (except for in aVR) makes it impossible for any STE to be normal variant!! This pattern is (subtle) “precordial swirl” (link to many other blog posts). There is inferior ST depression and “down-up” T-waves. This ECG is diagnostic of LAD Occlusion; there is no doubt!!
Recent paper in Journal of Electrocardiology: Goss L, Meyers HP, Friedman B, Smith SW. Precordial swirl sign: A new ECG pattern of left anterior descending artery occlusion myocardial infarction; J Electrocardiol [Internet] 2025;(153931):153931. Available from: http://dx.doi.org/10.1016/j.jelectrocard.2025.153931
Emily verified her diagnosis using the Queen of Hearts. (Remember that this is not FDA approved)


The darker the blue on this “Heat Map” of explainability, the more important the ECG feature is to making the diagnosis.
Note that it is very dense dark blue at the HATW in V2.
New PMcardio for Individuals App 3.0 now includes the latest Queen of Hearts model and AI explainability (blue heatmaps)! Download now for iOS or Android. https://www.powerfulmedical.com/pmcardio-individuals/ (Drs. Smith and Meyers trained the AI Model and are shareholders in Powerful Medical.)
Emily activated the cath lab. She did not wait for troponin, which later returned at 45 ng/L. The positive predictive value for acute MI (OMI and NOMI combined) of an initial troponin I of 45 ng/L is very low (about 25%, see below).
There was a 100% Proximal LAD Occlusion. Door to balloon time was VERY fast because of recognition of subtle OMI.
Our data shows that an initial troponin I of 45 ng/L has a Positive Predictive Value of only 25% for a type 1 MI, and OMI is a subset of type 1 MI. So even if you did wait for troponin, it would not tell you that this is a acute OMI.
Sandoval Y, Smith SW, Schulz K, Sexter A, Apple FS. Rapid identification of patients at high risk for acute myocardial infarction using a single high-sensitivity cardiac troponin I measurement. Cin Chem 2020; 66:620-2.

======================================
MY Comment, by KEN GRAUER, MD (6/27/2025):
As per Dr. Smith (and CREDIT to Dr. Dawra!) — Today’s case provides an excellent example of how rapid recognition of an acute OMI that does not satisfy STEMI criteria can expedite needed prompt cath and PCI.
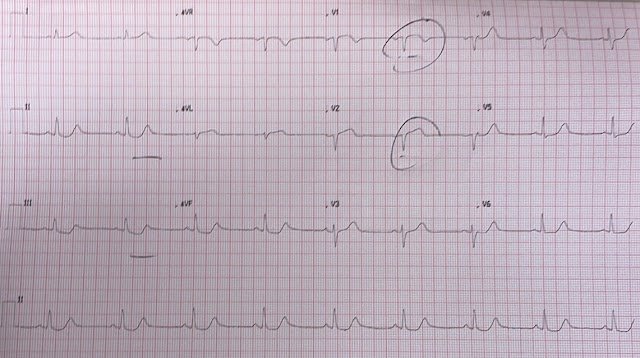
Since introduction of the colorful descriptor, Precordial “Swirl” by Drs. Meyers, Smith et al (Reference cited above in Dr. Smith’s discussion) — this term has seen increasing utility for quick-look identification of acute proximal LAD occlusion in progress. As per My Comment in the October 15, 2022 post in Dr. Smith’s ECG Blog — I like to focus on the appearance in leads V1 and V6:
- Although 1-2 mm of upsloping ST elevation is commonly (and normally) seen in anterior leads V2 and V3 — most of the time we do not see ST elevation in lead V1 (especially not with the ST segment coving seen in my labeled Figure-1). In addition — the surprisingly deep T wave inversion in lead V1 of today’s tracing is clearly abnormal. I immediately become suspicious of “precordial swirl” whenever there is suggestion of LAD OMI and in addition lead V1 looks different than expected!
- Further support of proximal LAD occlusion is forthcoming in Figure-1 by the clearly abnormal ST segment takeoff straightening that we see in lead V2.
- KEY Point: ST elevation can be seen in leads V1,V2 as a “strain equivalent” sign in patients with LVH. But in such cases of LVH — the S wave in anterior leads V1,V2 should be deep (and S waves in Figure-1 for these leads are small!).
- The final part in diagnosing “precordial swirl” — is to see reciprocal ST depression at least in lead V6 (if not also in lead V5).
- Once I’ve decided that the tracing I am looking at is not LVH that mimics precordial swirl — I focus on the shape of the ST-T wave in lead V6. With “swirl” — I’ve been impressed that the shape of ST-T wave depression in lead V6 often looks different than the asymmetric ST-T wave depression characteristic of LV “strain” — in that the depressed ST-T wave depression with “swirl” tends to be flatter (consistent with what see in lead V6 in Figure-1).
In a patient with new CP (as in today’s case) — recognition of the above-described ST-T wave findings in leads V1,V2 and V6 should take no more than seconds. I like to “confirm” the diagnosis of acute proximal LAD occlusion in my mind — by seeking out additional support of LAD OMI in the remaining leads.
- As per Drs. Smith and Dawra — T waves in the remaining chest leads are hyperacute (BLUE arrows in leads V3,V4,V5).
- In the limb leads — lead aVL manifests ST segment takeoff straightening and ST elevation (clearly present when one looks closely at the J-point in this tiny QRS complex) — with deep reciprocal ST depression in each of the inferior leads (BLUE arrows in leads II,III,aVF).
The “good news” in today’s case — is that Dr. Dawra’s eagle-eyed recognition of Precordial “Swirl” led to prompt cath lab activation with needed PCI.

===================================