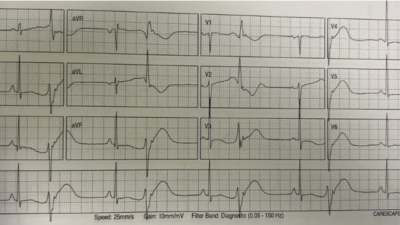
An alcoholic presented with confusion. He had this ECG recorded:
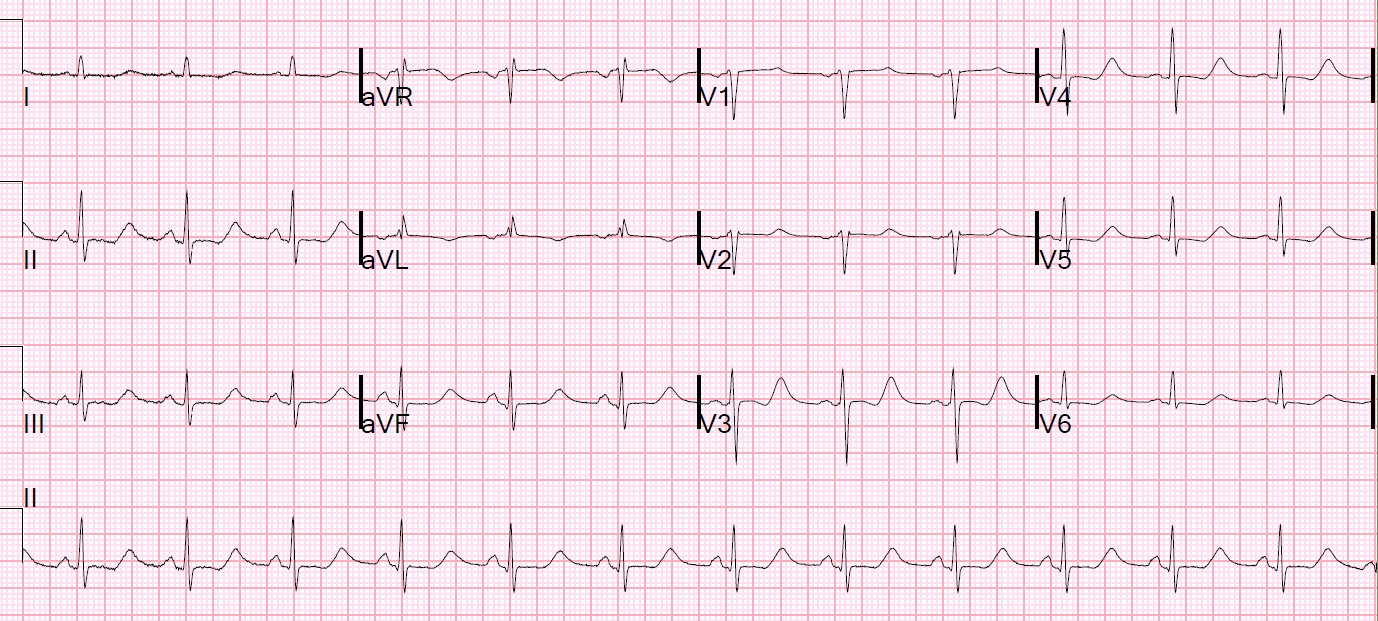 |
| What do you think? Computer measures the QT at 505 ms, and QTc at 533 ms The measure appears to be correct. |
V3 reminds me of this ECG:
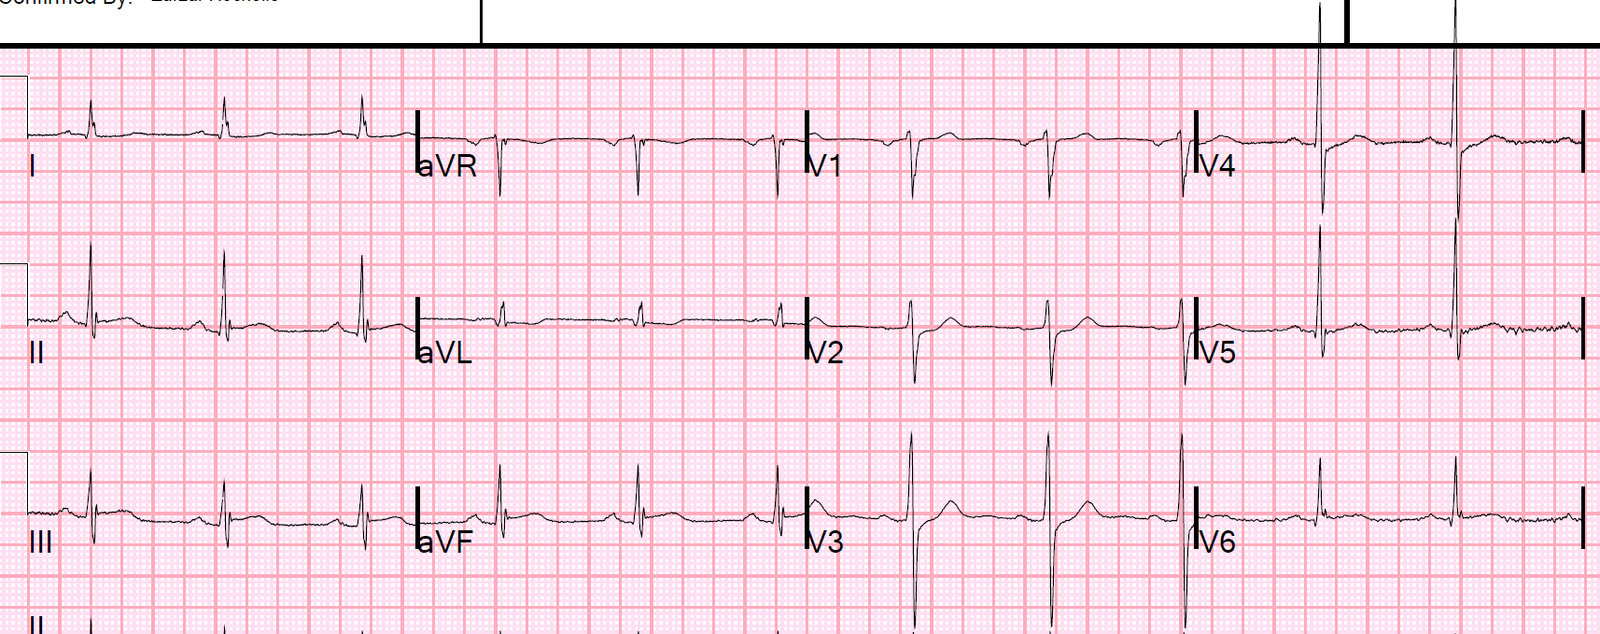
Are These Wellens’ Waves??
 |
| What is going on? |
These waves which you think are T-wave are really very large U-waves.
The clues are:
1) the down-up morphology
2) the apparent very long QT
The K returned at 2.1 ng/mL.
The pH was 7.55 and bicarb was 47, with chloride less than 68. The patient has a severe hypokalemic metabolic alkalosis from vomiting.
(By the way, the pCO2 was 55. An appropriate compensation for metabolic alkalosis is 0.9 x bicarb + 15. So 47 x 0.9 = 43. Add 15 and you get an expected pCO2 of 58. A pCO2 of 55 is just a bit below predicted.)
The importance of this is:
Anything that increases ventilation (hypoxia, agitation, anxiety) can lead to dangerous alkalemia.
If the pCO2 were to be lowered to normal (= 40), then the pH would rise to 7.70 (very dangerous).
Here is a lecture on Acid Base Disorders (55 minutes)
Here are subsequent ECGs:
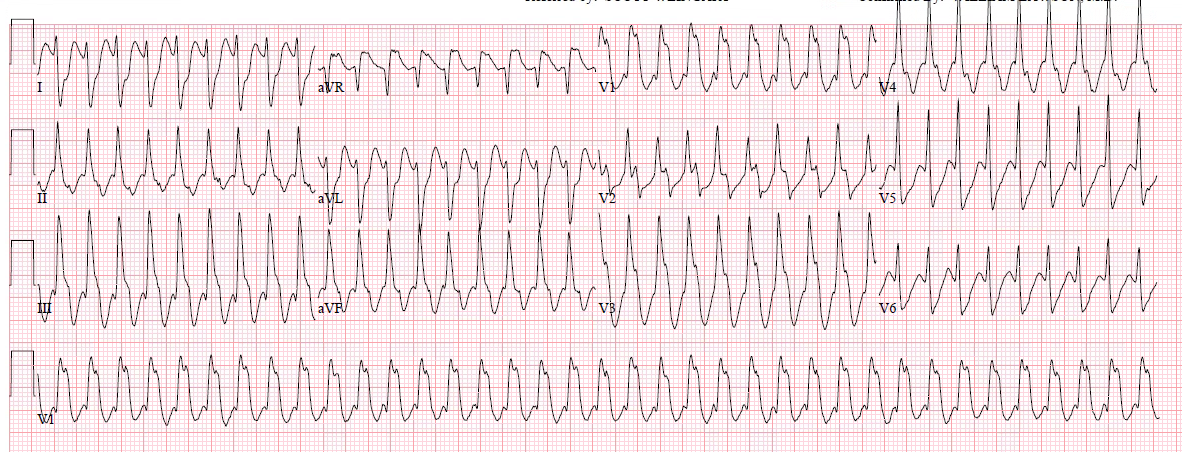
This one at K = 2.4
 |
| The down up morphology remains The computer measures the QT at 565 ms, QTc at 591 ms This measurment also appears to be correct (except that now we know it is measuring the QU-interval, not the QT) Large U-waves, with long QU-interval, also puts patients at high risk of polymorphic VT |
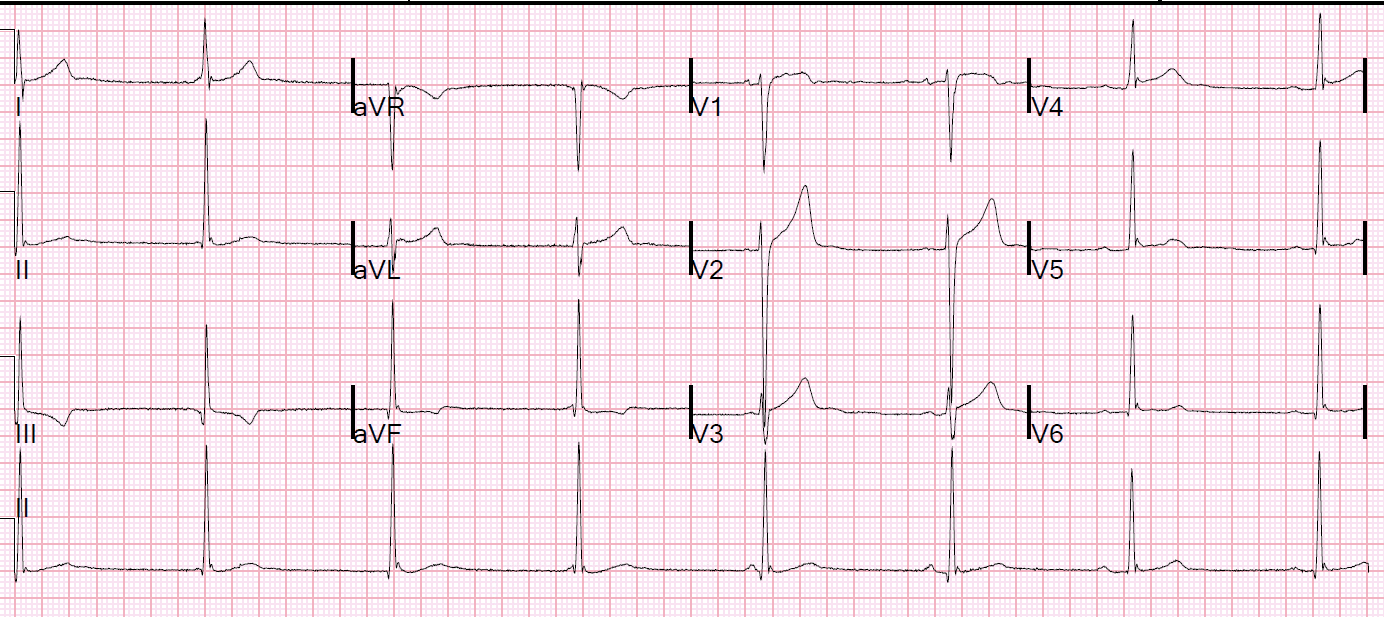
And 6 hours later at K = 2.6 mEq/L:
 |
| Now the apparent T-waves are really T-waves (not U-waves), and the QT is 479, QTc 500 |
Learning Points:
1. When the QT interval is impossibly long, the “T-waves” are probably U-waves. In this case, the QT was long, but not impossibly so. Nevertheless, one should think of U-waves.
2. When there are down up T-waves, and the apparent QT is long, they are probably U-waves.
3. Large U-waves are associated with a high risk of VT. (I will write more on this later)