A 50 something with no previous cardiac history, but with history of seizures, presented to triage with a few hours of chest tightness and pressure, 5/10, radiating to the left arm. He was from out of town and had forgotten to bring his seizure medications. He thought maybe he had had a seizure as cause of his symptoms?
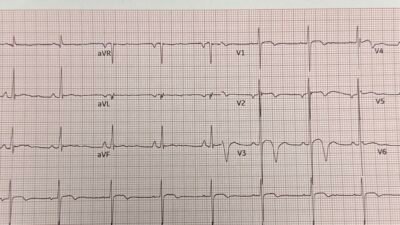
He had this ECG recorded:
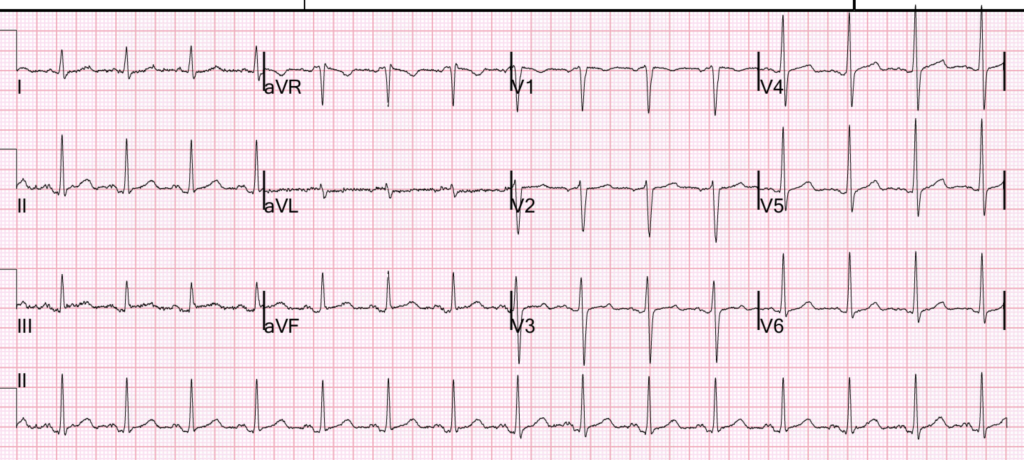
Cardiologist interpretation:
NONSPECIFIC ST ELEVATION [0.05+ mV ST ELEVATION]. BORDERLINE ECG
What do you think?
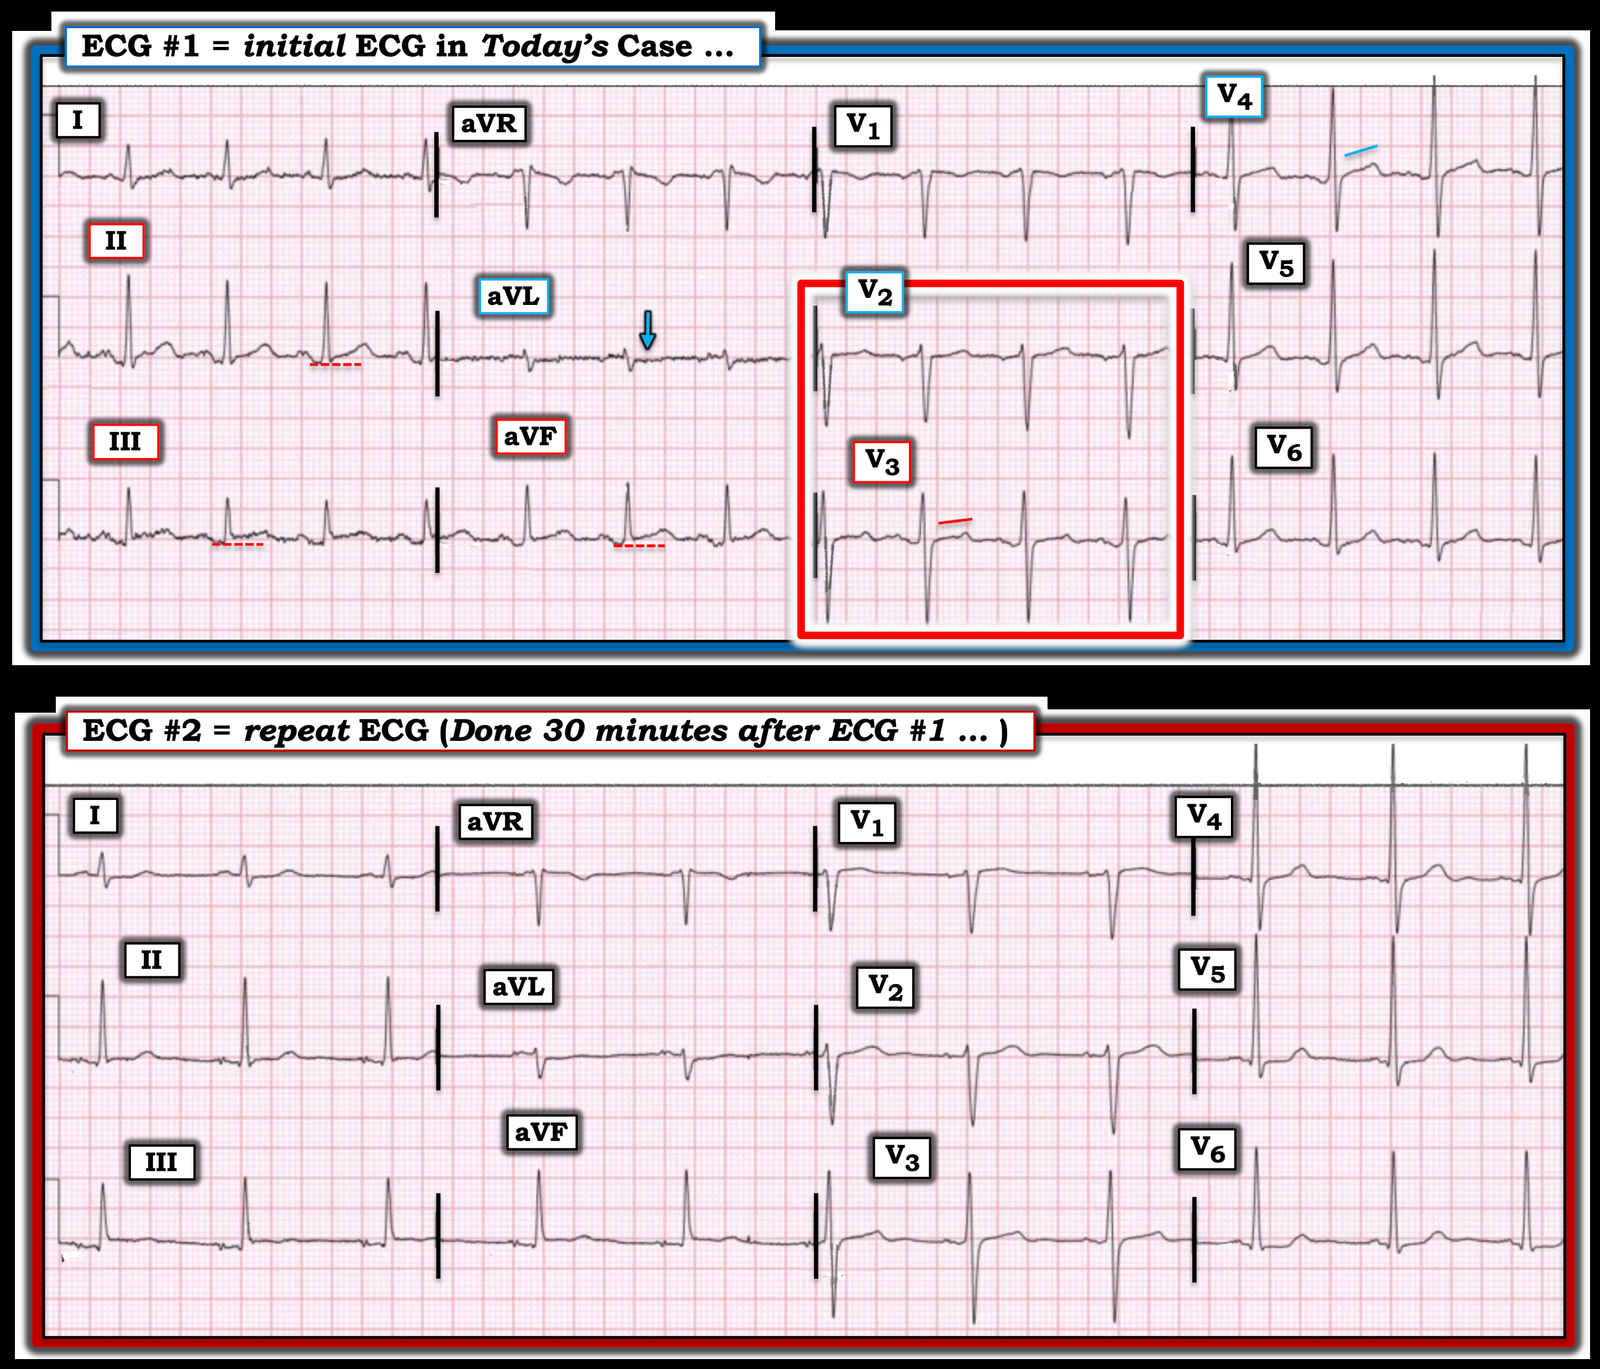
There is < 1 mm STE in inferior leads, most in lead III. There is minimal reciprocal ST depression in aVL. The absence of an S-wave in leads III and aVF is very supportive (this finding in V2-3 is called “terminal QRS distortion” and is diagnostic for LAD occlusion in those leads; it is highly suggestive in other leads). Thus, this ECG is all but diagnostic for inferior OMI.
This is the PMCardio Queen of Hearts AI ECG model interpretation:
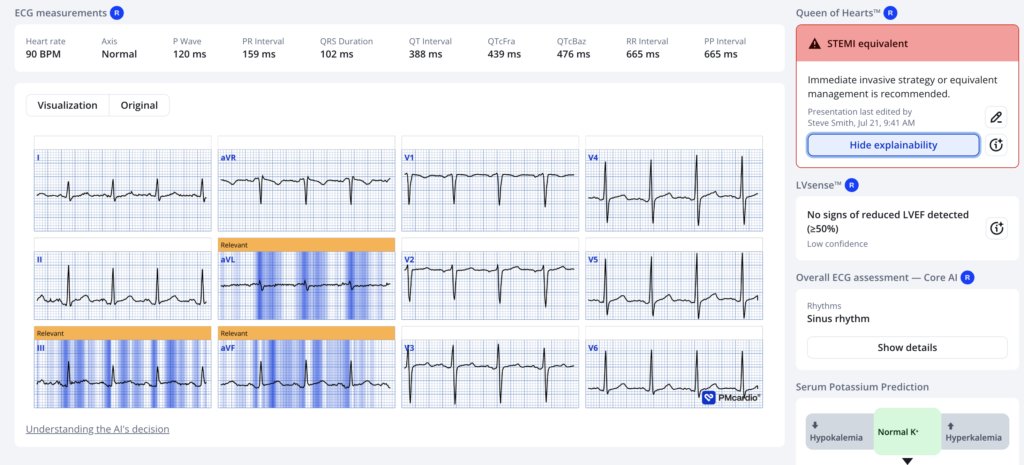
The raw score was 0.72 (scale is 0-1.0, with a value > 0.50 for positive, 0.30-0.50 as indeterminate). 0.72 is equivalent to a specificity of ~98%, so the Queen is quite certain of the diagnosis.
Unfortunately, these findings were not recognized by the physician who first saw the ECG, and the patient was placed in the waiting room.
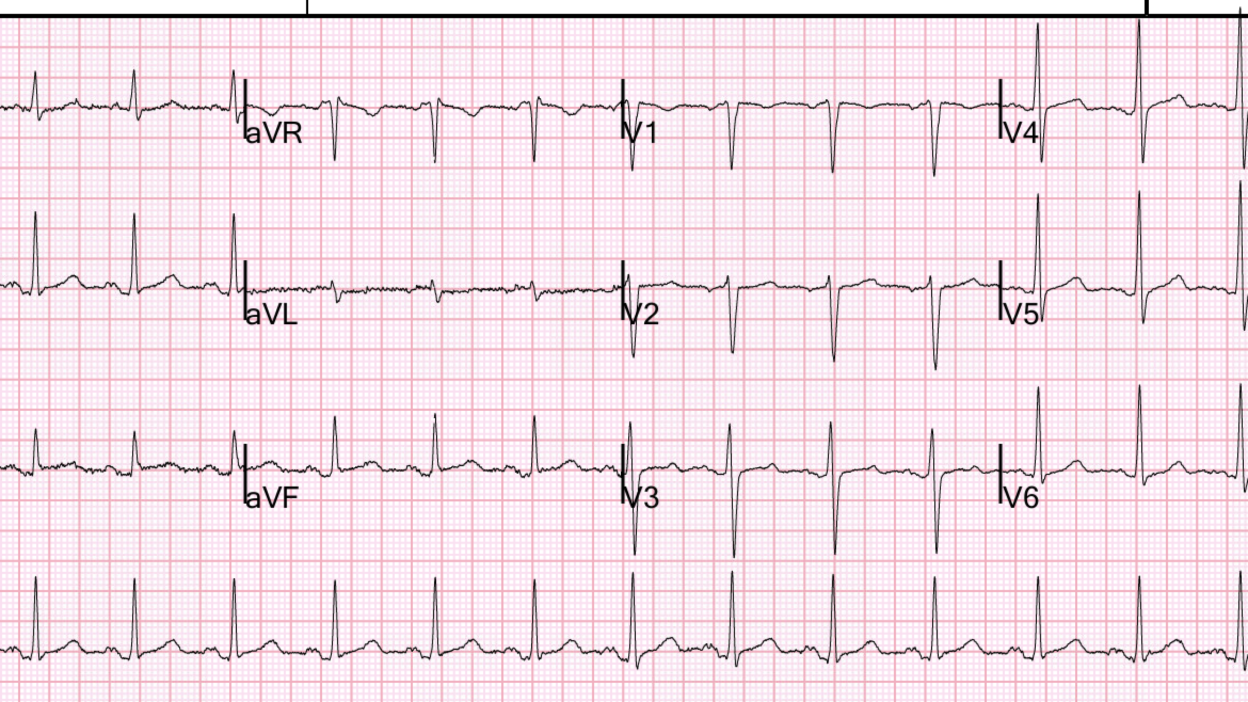
Another ECG was recorded 30 minutes later in the waiting room (it unclear if there was active chest pain during this EKG):
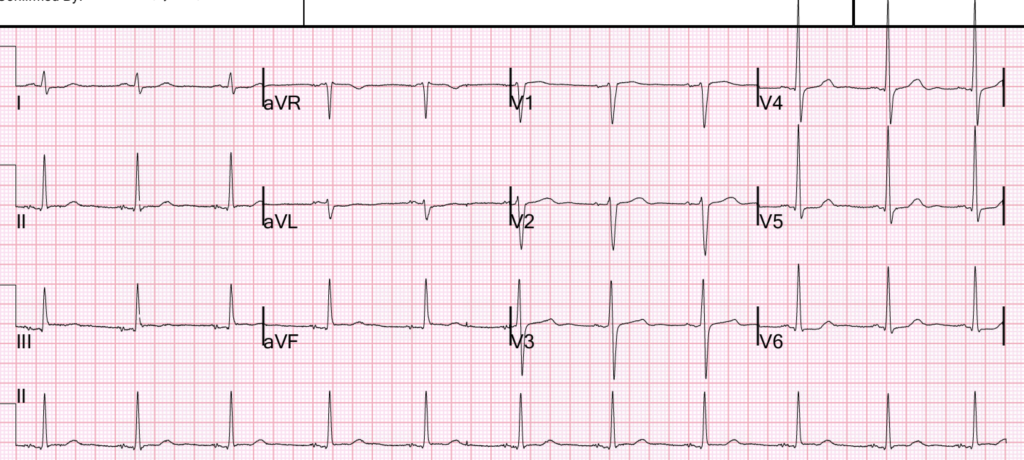
Cardiologist interpretation:
MINIMAL ST DEPRESSION [0.025+ mV ST DEPRESSION]. BORDERLINE ECG
Smith: This one has the same findings, but more subtle. But the fact that it is dynamic makes the first one even more diagnostic!
On this one, the Queen did not see any signs of OMI. The score was 0.00. The Queen unfortunately does not compare serial ECGs, or compare with old (previous) ECGs. We will work on that in the future.
1.5 hours after arrival, the first hs troponin I returned slightly elevated at 48 ng/L. In a patient with no previous cardiac history and with acute chest discomfort, this elevated value, even if the ECG were normal, would have a VERY high positive predictive value for acute MI.
2 hours after arrival, the patient was placed in a room.
One of our graduating G3 residents came upon the patient and looked at the first ECG and knew immediately that it was an inferior OMI. She somehow got access to the Queen of Hearts (its use has been restricted until FDA approval) and confirmed it.
The cath lab was activated.
Angiogram: ostial/proximal LAD thrombus! So this could have been a disastrous case.
LAD: a large-caliber vessel that wraps around the apex (“wraparound LAD”) and is noted to have 90% stenosis (TIMI flow not documented, but the artery is open) in the ostial/proximal segment and ill-defined hazy filling defect at the D1 bifurcation.
There was underappreciated plaque extending into the left main and significant plaque burden in the proximal LAD along with fresh thrombus filling a majority of the proximal LAD lumen, which is strongly suggestive of acute plaque rupture rather than SCAD (spontaneous coronary dissection).
Suspected culprit for the patient’s non-ST elevation myocardial infarction with dynamic EKG changes is a ruptured plaque in the proximal LAD, as demonstrated on IVUS.
Successful PCI of the ostial and proximal LAD with a 4.0 x 16 mm Synergy XD drug-eluting stent.
Wraparound LAD: this means it wraps around the apex to the inferior wall and this explains the inferior findings. Usually with wraparound LAD, however, one sees findings in the apical leads of V5 and V6, which are absent in this case.
Highest measure trop I = 1882 ng/L (this was not the peak; we do not know the peak troponin which correlates fairly well with infarct size. The majority of OMI with total occlusion at angiogram have peak hs troponin I > 5000-10,000 ng/L, or peak hs troponin T > 1000 ng/L if that is the assay used. Large infarcts have peak trop I > 25,000 – 50,000. Huge ones have
Echo:
The estimated left ventricular ejection fraction is visually estimated at 50-55%. Normal LV cavity size and wall thickness. No wall motion abnormality. Looks like no really significant damage was done.
2 days later:
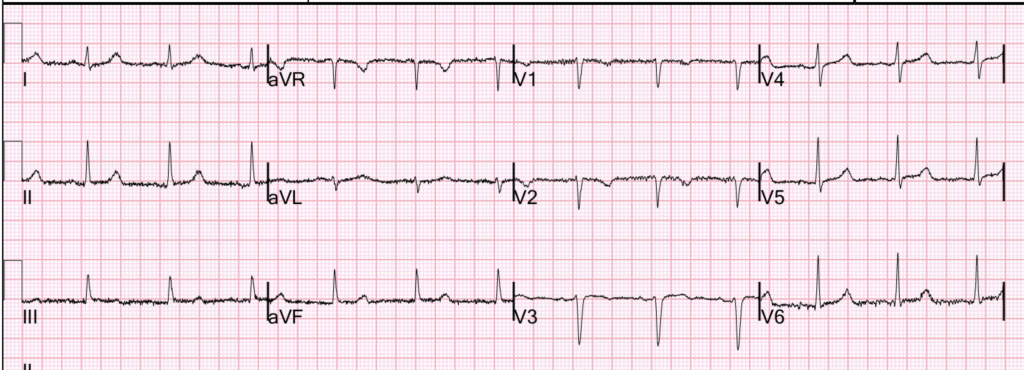
There are subtle findings of LAD reperfusion,.
Learning points
- Although this turned out to not be a very large infarct, the risk was incredibly high with an ostial LAD thrombus, which could have propagaget and killed at any time.
- OMI findings can be incredibly subtle. The Queen of Hearts can help you identify them.
- Sometimes, OMI findings are not at all evident on the ECG. But persistent chest pain (as in this patient) and an elevated troponin without a solid explanation is an indication for the cath lab.
- Inferior OMI can be caused by LAD thrombus, especially if the LAD is a wraparound to the inferior wall.
= = =
==================================
MY Comment, by KEN GRAUER, MD (7/24/2026):
As I reviewed today’s case — I thought to myself, “This is very likely to be a subtle OMI that will not be recognized by any clinician still ‘stuck’ on the STEMI paradigm — but we may need a repeat ECG to prove it!“.
- For clarity and ease of comparison in Figure-1 — I’ve put the first 2 tracings in today’s case together.
= = =
The initial ECG in Figure-1 …
Today’s patient is a 50-something year old man who presented to the ED with new CP (Chest Pain).
- To Emphasize: The above brief history immediately places this patient in a higher-risk group for having an acute event. By definition — this significantly increases the chance that subtle ECG findings may be significant.
- The rhythm is sinus at ~85/minute. Intervals (PR-QRS-QTc) and the frontal plane axis are normal. There is no chamber enlargement.
- My “eye” was immediately captured by lead V3 (within the RED rectangle). As we’ve so often emphasized in Dr. Smith’s ECG Blog — leads V2 and V3 normally manifest a slight amount of gently upsloping ST elevation. Therefore, in an adult with new CP — the ST-T wave flattening that we see in lead V3 is distinctly abnormal (especially given that the only chest leads showing ST segment flattening in this tracing are leads V2 and V3!).
- While there is slight upsloping of the ST segment in lead V2 — there is no ST segment elevation. Taken together in this patient with new CP — this finding of chest lead ST segment flattening that is limited here to leads V2 and V3 — is highly suspicious for acute posterior OMI.
- By the principle of “neighboring” leads: Given the abnormal ST-T wave appearance in leads V2,V3 — I thought the ST segment takeoff in neighboring lead V4 was abnormally straightened (and it is leads V2,V3,V4 that tend to show the most ST segment straightening, if not depression with acute posterior OMIs).
My “eye” next surveyed the inferior leads:
- Because of a common blood supply to the LV posterior wall and the inferior wall (by either the RCA and/or LCx) — seeing suspicious ST-T wave changes in the inferior leads provides support that any abnormal finding(s) in leads V2,V3 and/or V4 is truly indicative of ongoing infero-postero OMI.
- Looking closely in ECG #1 — Each of the inferior leads show subtle-but-real ST elevation. In support of this finding in leads II,III,aVF — is the ST segment flattening with a hint of ST depression in lead aVL, that I interpreted as a reciprocal change (BLUE arrow in lead aVL).
BOTTOM Line: The above ST-T wave findings are subtle! (and all-but-certain to be overlooked by any clinician still “stuck” in the outdated STEMI paradigm). BUT, in this 50-something year old man with new CP — the abnormal ST-T wave findings that I describe above in 7/12 leads suggest ongoing infero-postero OMI until proven otherwise.
- Cardiac cath performed sooner rather than later will almost certainly be needed — although more evidence (ie, in the form of a repeat ECG performed within 10-to-30 minutes) may be needed to convince the interventionist of the need for cath.
= = =
Figure-1: Comparison of the first 2 ECGs in today’s case.
= = =
The repeat ECG in Figure-1 …
As I regularly emphasize in the cases presented in Dr. Smith’s ECG Blog — the simple technique of side-by-side comparison is the most time-efficient way to appreciate subtle differences in serial ECGs.
- Applying this technique in Figure-1 — It should take no more than 10 seconds of side-by-side comparison to appreciate the following “dynamic” ST-T wave changes that we now see in the repeat ECG done 30 minutes after ECG #1:
- Improvement in the subtle hyperacute ST elevation that had been present in the initial tracing.
- Some regeneration of the gentle ST segment upsloping expected in leads V2,V3,V4 — with a more normal-appearing upright T wave now seen in the repeat tracing.
- New ST segment flattening with slight depression in the lateral chest leads of ECG #2.
BOTTOM Line: Any hesitancy that might have been present on the part of the interventionist after seeing ECG #1 — should no longer be present after seeing the above “dynamic“ ST-T wave changes in the repeat ECG.
- I was surprised by the LAD location of the “culprit” vessel in today’s case. That said — this in no way lessens establishment of the need for prompt cath with PCI on the basis of ECG #1, with removal of any doubt by ECG #2.
= = =
= = =