Written by Pendell Meyers
A man in his 60s with HTN and AF presented with chest pain that started about 1 hour ago and started to subside during transport via ambulance. Vitals were normal except for a heart rate of 49 bpm at triage.
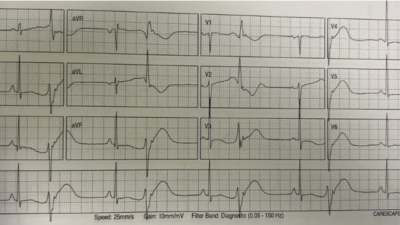
Here was his EMS ECG recorded just before arrival:
 |
| What do you think? |
Sinus bradycardia with clear but subtle evidence of inferior OMI. The T-waves in III and AVF are certainly hyperacute, as they are fat and wide compared to their small, normal QRS complexes and are corroborated by the inappropriate T-wave inversion in aVL. Lead II would probably also be proven to be hyperacute in comparison to a baseline ECG if we had one with a clear baseline T-wave.
V3 also has a hyperacute appearance, but I am not sure how to reconcile this with the distribution of findings in the rest of the ECG.
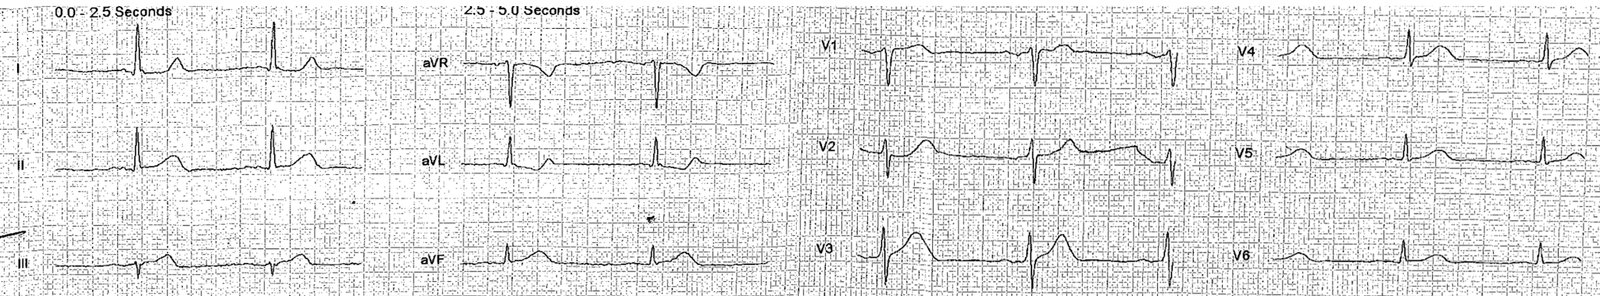
The only available prior ECG in the system was this one in atrial flutter:
 |
| Despite flutter somewhat obscuring the T-waves, you can see that the inferior T-waves at baseline are not as big as the presentation ECG, proving they are indeed hyperacute. The T-wave in aVL is upright at baseline, and inverted in the presentation ECG. |
The ED physician was worried about the EMS ECG and obtained an immediate repeat on arrival in the room:
 |
| Sinus bradycardia persists, but the hyperacute T-waves are deflating compared to the EMS ECG. It would seem that the patient is reperfusing at this time, which of course fits with the clinical data of decreasing pain. Of note, V3 is also improving, solidifying the notion that it was truly hyperacute in the first ECG. |
It is unclear whether the cardiology team understood that the patient has an unstable ACS lesion causing intermittent OMI. They advised starting heparin drip (already received ASA) and no urgent cath at this time.
The initial troponin of course returned undetectable (our contemporary troponin T takes 4-6 hours from onset of persistent occlusion to rise).
Suddenly the family of the patient cried for help.
The team arrived in the room to find the patient in VF arrest.
He was successfully defibrillated with immediate return of mental status.
The team called the cardiologists back to bedside and obtained this repeat ECG:
 |
| I can’t say I see a meaningful difference between the inferior leads on this ECG and the last one. Perhaps there is some new STD in V2. The T-wave in V3 has become hyperacute again, and now in retrospect it looks as if the entire anterolateral wall (V3-V6) may be affected by whichever artery is involved. The bottom line is: there is ongoing evidence of an unstable coronary lesion which is causing ongoing ischemic symptoms and a VF arrest! |
They took the patient to cath and found a mid-RCA lesion which was barely open at that time (it is documented as 95% in one place in the report, 99% in another) but resulting in TIMI 2 flow. PCI was performed with excellent angiographic result. There was also disease in other arteries such as 75% LAD and 70% D1, which were not deemed acute lesions. They did not comment whether the RCA somehow supplied the anterior and/or lateral walls (which it appears to, based on the ECGs).
Here is the ECG after cath:
 |
| Clear inferior reperfusion findings in III and aVL, as well as V2-5. |
For whatever reason, the cardiologists decided not to order any more troponins! So the only one on file is the initial troponin (prior to VF arrest) which was undetectable. It is obvious to me that the troponins would have risen, but I cannot prove it, and we do not know what the peak would have been.
Learning Points:
The RCA supplies the nodes (SA and AV), and RCA OMI frequently presents with sinus bradycardia and/or AV blocks.
You must be able to recognize subtle hyperacute T-waves. You must understand that they are proportional to their QRS complexes, and that ECGs with small voltage may have small absolute T-waves which are completely diagnostic of hyperacute T-waves.
This patient never met STEMI criteria, but had RCA OMI causing VF arrest. If this patient had been prospectively identified by an expert electrocardiographer as OMI and taken to the cath lab immediately, I think there is a strong possibility that we could have prevented his cardiac arrest and likely saved him some myocardium (and hopefully, then, long term sequelae).
![]()
===================================
MY Comment by KEN GRAUER, MD (2/28/2020):
===================================
Five ECGs are done in this case. I’ve labeled these — and focus My Comment on ECGs #1, 3 and 4 — which I’ve reproduced in Figure-1.
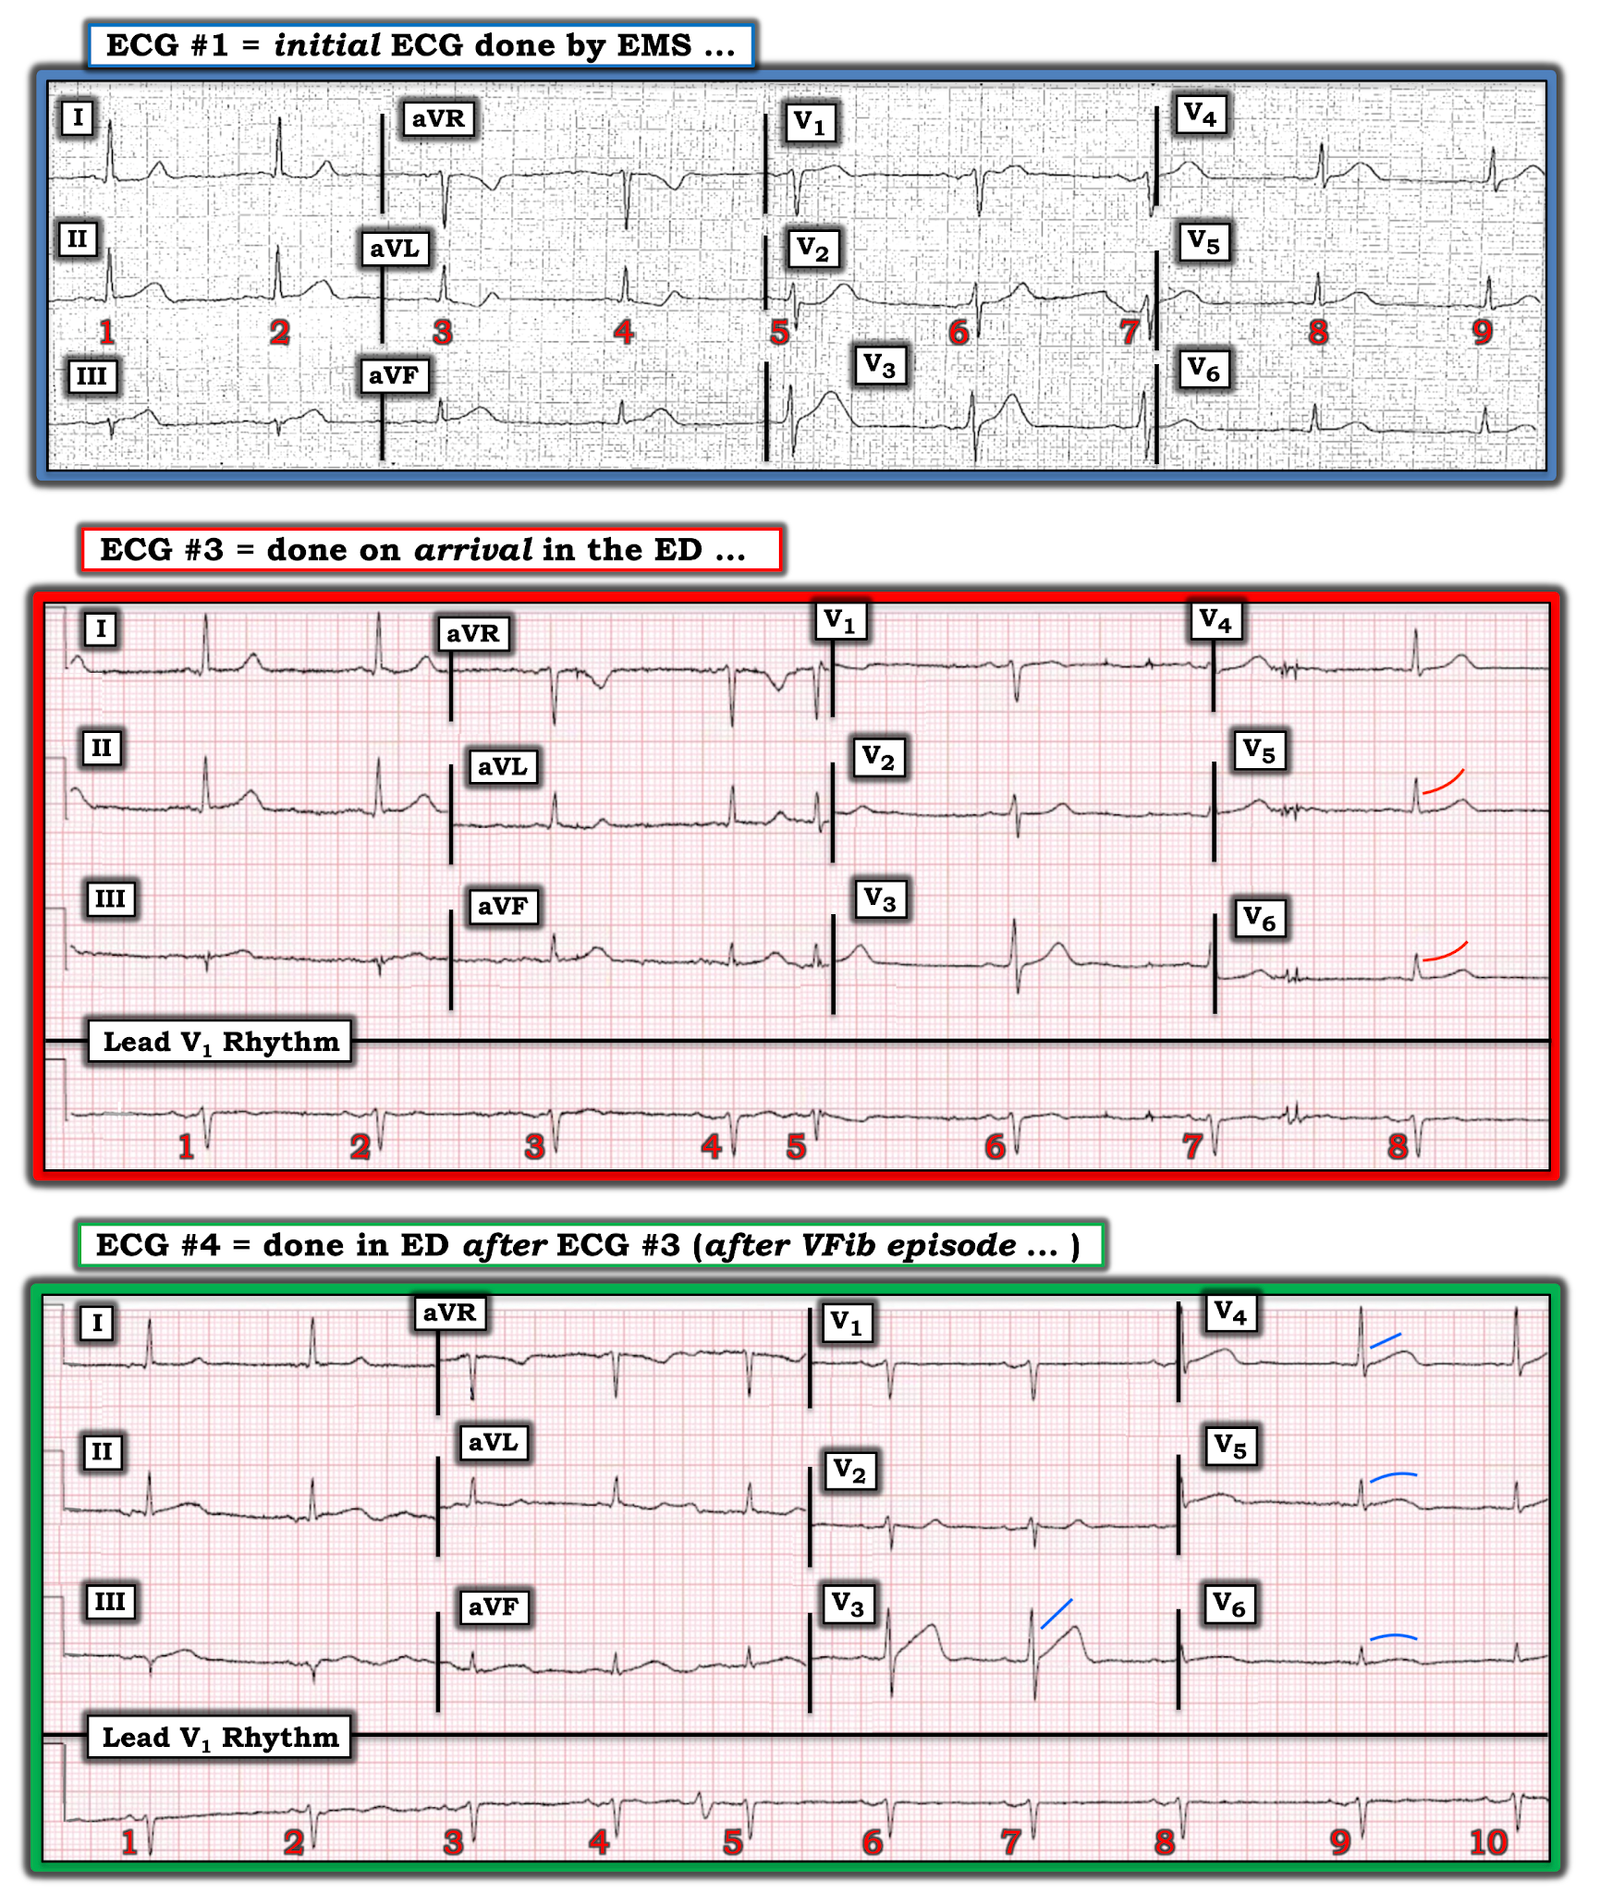 |
| Figure-1: The 1st, 3rd and 4th ECGs shown above from this case (See text). |
ECG #1: As per Dr. Meyers — the ST-T waves in each of the inferior leads are hyperacute. This is most marked for leads III and aVF, in which the T waves are disproportionately tall considering the tiny size of the QRS complex in these leads.
- The ST-T wave change in lead II is more subtle — but it has to be considered in light of the definite hyperacute changes in the other 2 inferior leads (ie, my “threshold” for considering subtle change significant in the 3rd inferior lead is lowered — since both leads III and aVF are clearly abnormal). In this context — the T wave in lead II is indeed fatter-than-expected at its peak.
- Confirmation that these inferior lead ST-T wave changes are real — is forthcoming from the ST depression with positive terminal T wave in lead aVL — that is nearly a mirror-image opposite change to the hyperacute T wave in lead III.
- The ST segment in the other high-lateral lead ( = lead I) is also abnormal, in that it is uncharacteristically straight, with abrupt angulation at the onset of its T wave.
- PEARL — On occasion, the T wave may be normally inverted as an isolated finding in leads III — aVF — and/or aVL. This is especially true when the QRS complex in the lead with T wave inversion is predominantly negative (ie, the T wave axis often follows close behind the QRS axis). However, when the QRS complex in lead aVL is positive (as it is in ECG #1) — ST depression as seen in lead aVL of this tracing is not a normal finding.
- BOTTOM LINE — Each of the limb leads in this tracing (other than lead aVR) is abnormal. In the context of this man in his 60s with new-onset chest pain — the conclusion that ECG #1 represents acute OMI until proven otherwise is inescapable.
Looking further in ECG #1 — the reason I’ve numbered the beats in this tracing, is because of the variation in ST-T wave morphology in leads V2 and V3. Is it the ST-T wave of beat #5 — or beat #6 that is altered by artifact?
- If ST-T wave morphology of beat #5 is real — then there appears to be some ST depression in lead V2 + a hyperacute T wave (fat at its peak and wide in its base) in lead V3.
- On the other hand, if artifact is deforming the ST-T wave of beat #5 — and it is beat #6 that is showing the true ST-T wave morphology — then there may not be acute changes in the chest leads of ECG #1.
- BOTTOM LINE — If decision-making depends on what is (or is not) going on in the chest leads — then ECG #1 should be promptly repeated. That said — I would not have needed to immediately repeat this tracing — because the limb leads alone are diagnostic.
ECG #3: The 3rd ECG shown above in this case ( = ECG #3) — was the initial tracing done in the ED. As per Dr. Meyers — there is improvement in the acute ST-T wave abnormalities noted in ECG #1 (which considering the associated decrease in chest pain — was consistent with spontaneous reperfusion).
- The rhythm in ECG #3 is sinus bradycardia at ~50-55/minute.
- Beat #5 is a PAC that conducts with slight aberration.
ECG #4: Some time after ECG #3 was done — the patient went into VFib. He was successfully defibrillated — and then ECG #4 was obtained.
- As per Dr. Meyers — there does not appear to be a significant ST-T wave change in the appearance of the limb leads in ECG #4 compared to ECG #3.
- On the other hand — there is subtle-but-real change in leads V3-thru-V6 of ECG #4 compared to ECG #3.
- Lead V3 in ECG #4 provides the most interesting finding. Regardless of whether beat #6 or beat #7 in lead V3 of ECG #4 manifests the “true” ST-T wave morphology — both complexes show hyperacute changes in the form of slight ST elevation, ST segment straightening, and an extremely wide base to the T wave. This change is remarkable compared to lead V3’s appearance in ECG #3.
- The ST segment in leads V4, V5 and V6 of ECG #3 is gently upsloping (curved RED lines). In contrast — the ST segment is straightened and/or slightly coved in these leads in ECG #4 (BLUE lines).
- So WHY was there such a dramatic change in ST-T wave appearance in lead V3 of ECG #4? Normally acute changes aren’t seen in lead V3 when the “culprit artery” is the RCA (as was shown to be the case on cath). But this patient did have multi-vessel disease, including significant narrowing in the LAD — and, subtle-but-real changes are seen in leads V3-thru-V6 of ECG #4. Taken together, there have been subtle-but-real dynamic changes occurring over the course of the 3 tracings shown in Figure-1.
- Beyond-the-Core — IF you interpreted the rhythm in the long lead V1 rhythm strip of ECG #4 as sinus — LOOK AGAIN! Isn’t there a change in P wave morphology between the first 2 P waves in the long lead V1 rhythm strip (which are positive, with a short PR interval) — compared to the P waves preceding the rest of the beats on this tracing (which are biphasic, with a longer PR interval)? While this shift in the site of the atrial pacemaker is unlikely to have clinical implications — it is good to train your eye to pick up this type of subtle finding. PEARL: By making it a practice to always spend the first 3 seconds (That’s all it takes!) in your interpretation of any ECG by looking to see if P waves are consistently present with constant PR interval in front of each QRS complex — You will not overlook subtle arrhythmia changes.
Our THANKS to Dr. Meyers for presenting this case.
![]()