This was sent by a reader:
“I would really appreciate your thoughts on this ekg progression. 71 yo F, only risk factor hyperlipidemia, has isolated chest discomfort, non-exertional and non-radiating.”
 |
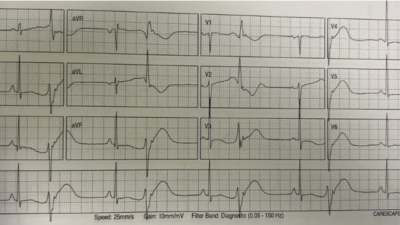
| Sinus rhythm with one PVC. What do you think? |
Smith response:
This ECG has symmetric (hyperacute) T-waves in V2-V4. It is diagnostic of LAD occlusion.
If you’re uncertain, use the formula:
https://hqmeded-ecg.
I applied it here after measuring a QTc of 440 ms.
The value comes to 19.73 (greater than 18.2 is quite good for Diagnosis of LAD occlusion.)
Even if you measure QT as 411 ms, it still comes to greater than 18.2.
The reader continues:
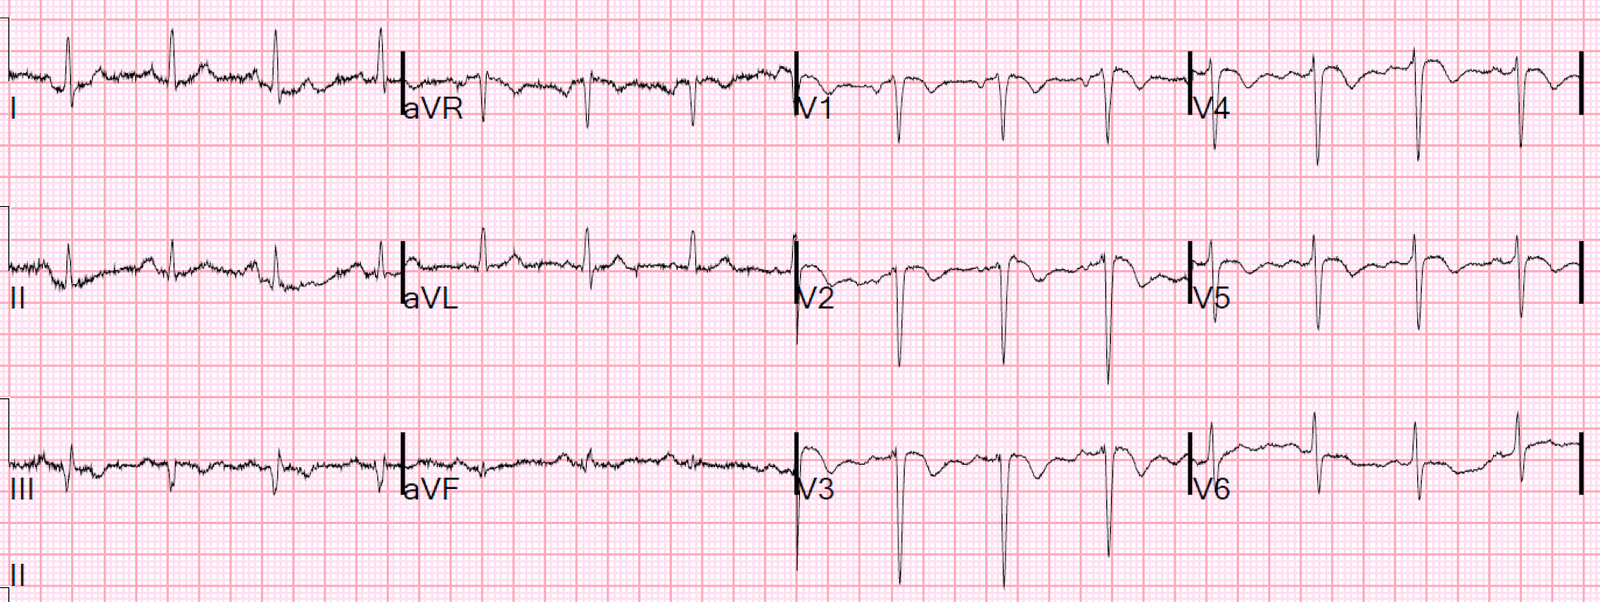
“I saw slight elevation avL and slight depressions inferiorly prompting repeat ekg 1 hour later.”
 |
| Now it is an anterior STEMI, obvious to anyone |
Learning Point:
Use the formula for differentiating subtle LAD occlusion from normal ST Elevation.
![]()
===================================
MY Comment by KEN GRAUER, MD (2/22/2020):
===================================
This case is short. The patient is a 71yo woman who presents with chest discomfort. The concise Smith response summarizes the essentials: “This ECG has symmetric (hyperacute) T waves in V2-thru-V4. It is diagnostic of LAD occlusion.”
- I’ll add 3 thoughts on the initial ECG that I’ve redrawn in Figure-1.
 |
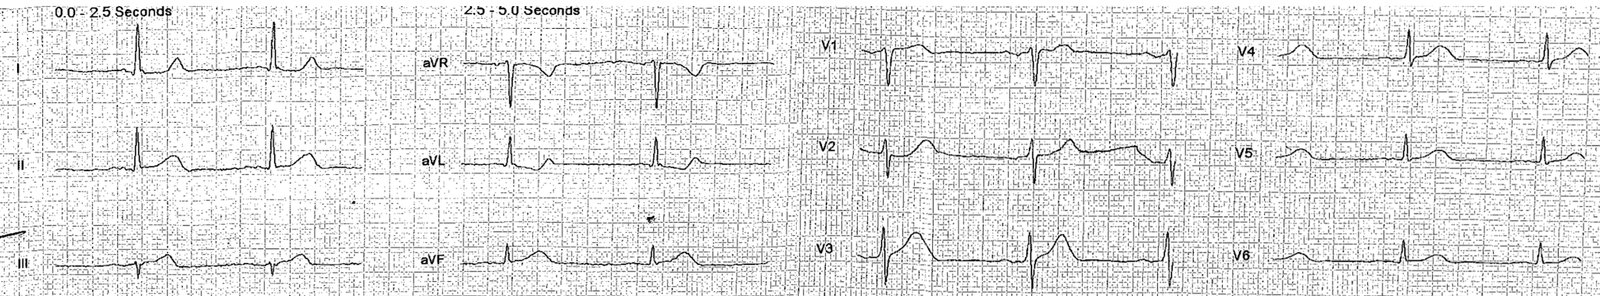
| Figure-1: I’ve numbered the beats in the initial ECG (See text). |
THOUGHT #1: There are some technical issues with this tracing. We see 10 QRST complexes (ie, 3 looks at each of the 10 beats) — but unfortunately, there is NO long lead rhythm strip below the 12-lead tracing. This means there is NO way to try and correlate what we see in the 12-lead, with a simultaneously-obtained long lead rhythm strip in which all supraventricular QRS complexes should look the same unless altered by aberrant conduction or artifact.
- The underlying rhythm in ECG #1 is sinus arrhythmia (ie, there is some variation in the R-R interval of sinus-conducted beats).
- Beat #6 occurs very early. This 6th beat looks like a PVC in lead V1.
- Beat #6 looks much more like a supraventricular beat in lead V3. It is narrow in this lead — and the T wave looks similar to the appearance of a T wave one would expect in a lead V3.
- I can’t decide what beat #6 looks like in lead V2 … The QRS complex is of small amplitude, and does not look wide to me — but the QRS of beat #6 in lead V2 clearly looks different than the QRS of beat #7 in lead V2. And, there are only 2 beats to choose from in leads V1, V2, V3 …
- My Impression — I suspect there may be artifact superimposed on the initial portion of beat #6 in lead V1 (and perhaps also in lead V2). That said — We can’t prove anything — because there is no simultaneous long lead rhythm strip.
- The reason I’m focusing on beat #6 — is that 2/3 of the KEY findings on this ECG appear in leads V2 and V3 — and it’s always preferable to base critical judgments on more than a single QRS complex. IF indeed early-occurring beat #6 is a PAC deformed by artifact, rather than a PVC — then the ST-T wave of beat #6 in lead V3 would look a lot less worrisome.
- BOTTOM LINE — The 1st Learning Point I would make about this tracing — is that when the data you have is technically impaired — GET better data. I would have immediately Repeated the ECG. Ideally, the repeat ECG would show a long lead rhythm strip under the 12-lead — but even if no simultaneously-obtained rhythm strip was available — at least critical decisions could be based on more than a single complex.
THOUGHT #2: Regardless of the technical issue concern that I raise in Thought #1 — one has to assume (as per Dr. Smith) that the T waves of sinus-conducted beat #7 in leads V2 and V3 are hyperacute until proven otherwise in this 71yo woman with chest discomfort.
- Numerically — One can assess this tracing by Dr. Smith’s Formula (as he discusses above).
- Subjectively — The T waves in both lead V2 and lead V3 are disproportionately taller than-they-should-be + fatter-than-they-should-be at their peak + wider-than-they-should-be at their base — which in a patient who presents with chest discomfort, defines these T waves as hyperacute until you prove otherwise.
THOUGHT #3: Taking a closer look at lead V4 — there is again a technical issue. Here, we at least have 3 beats (ie, beats #8, 9 and 10) to choose from — but there is a problem with the 1st of the 3 complexes ( = beat #8) that we see in lead V4.
- The sharp downsloping angulation that we see in the short ST segment (before the T wave) of beat #8 in lead V4 is not real (WHITE arrow). That this 1st QRST complex in lead V4 is altered by artifact is supported by the finding of an elevated baseline for beat #8 in lead V5. The 2nd Learning Point I would make, is that assessment about ST-T wave morphology for beat #8 in lead V4 may not be reliable.
- That said — We are still privilege to 2 QRST complexes in lead V4 that are valid (ie, beats #9 and 10) — and, there should be NO doubt that the unusually straight and short ST segment (BLUE arrows in lead V4) that is elevated by ~1 mm above the baseline, with sharp angulation at the junction between ST segment and T wave, followed by T waves for beats #9 and 10 in lead V4 that are disproportionately taller than-they-should-be + fatter-than-they-should-be at their peak + wider-than-they-should-be at their base — are hyperacute until you prove otherwise. (Yes, the ST-T wave in beat #10 is partially cut off — but I think we see enough to validate that the ST-T wave appearance in beat #9 in lead V4 is real).
BOTTOM LINE — It’s important to recognize technical shortcomings in a tracing that might impair assessment of ST-T wave morphology for the presence of acute changes.
- When you see this — immediately repeat the ECG if thought that technical issues may impair interpretation.
- That said, despite technical shortcomings — there is more than enough evidence in ECG #1 to diagnose acute LAD occlusion (as per Dr. Smith’s interpretation that was proven true with the 2nd ECG done 1 hour later).
![]()