This was sent by an EM colleague at Highland Hospital in Oakland. His name is “Deep”
A 40-something male complained of chest pain and SOB that began 2 hours prior at work and was becoming progressively worse. He had additional nausea and vomiting and complained of fever. The pain was constant, pressure-like, substernal, without radiation, and was 10/10 in intensity.
He stated that his wife had been diagnosed with Covid 3 months prior and that he, too, had been tested but never received the results.
BP was 213/128. Apparently no temperature was recorded as the patient looked very uncomfortable. Temp was not recorded until much later when it was 36.5.
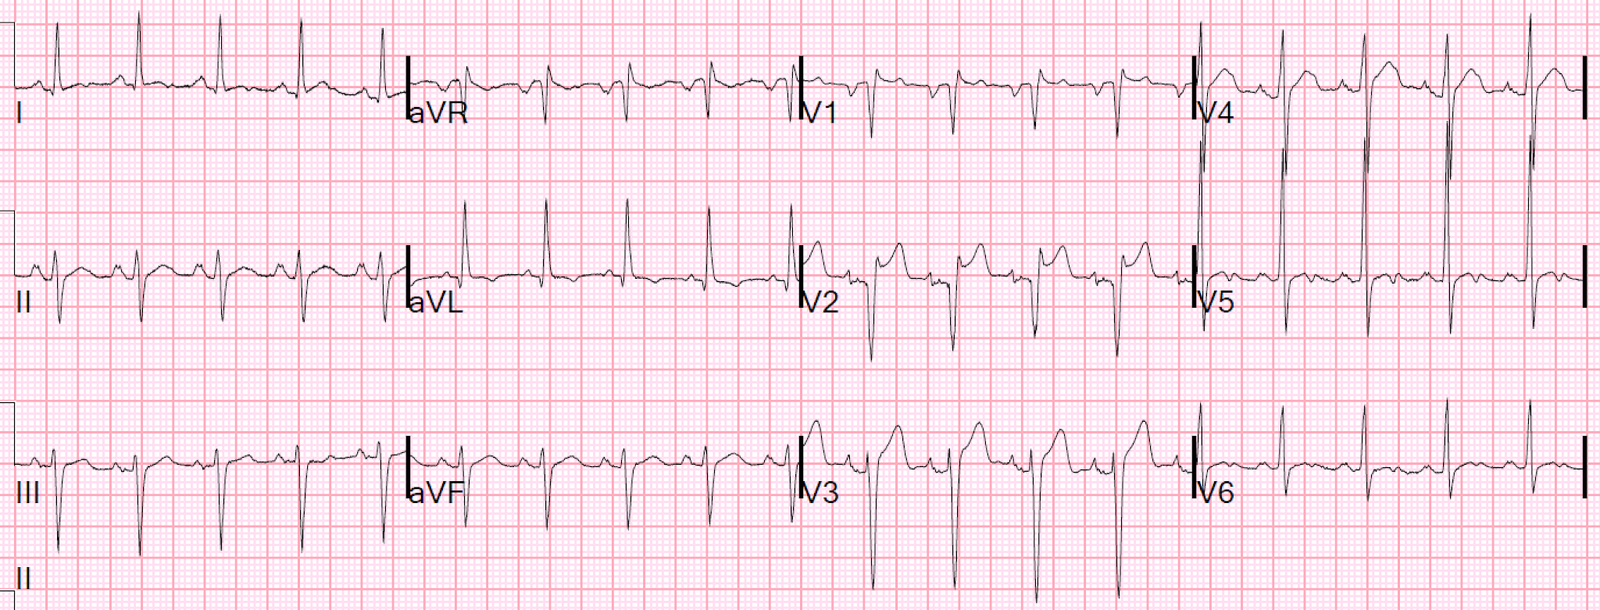
Here was his triage ECG:
There is ST Elevation that meets STEMI criteria in V2 and V3
What do you think?
The initial 4th generation troponin I was less than 0.010 ng/mL (undetectable).
The ECG looks a lot like early repolarization because:
1. There are asymmetric T-waves (slower upstroke, faster downstroke) 2. There is upward concavity in all of leads V2-V6 (in this case, even in V1) 3. There is no reciprocal ST depression 4. There is no terminal QRS distortion (there are S-waves in both V2 and V3) 5. There are no Q-waves
However, there is lots of ST Elevation, and Upright T-wave, in V1: (In our study, Upright T-wave in V1 was found in 46% of Normals and 73% of LAD occlusion. T-wave in V1 larger than T-wave in V6 was found in 15% of Normals and 39% of LAD occlusion. Both results were highly significant but did not add value to the multivariate logistic regression formula.
Because of V1, and also due to the patient’s clinical presentation, Deep was pretty sure this was a STEMI, but because it also has a lot of features of benign ST Elevation (also frequently called “Early Repolarization”) which also has STE in V2-V4, he used the relatively new 4-variable formula, which is used to differentiate subtle LAD occlusion (in that it looks normal) from normal variant ST Elevation.
See use of the formula here: 12 Example Cases of Use of 3- and 4-variable formulas to differentiate normal STE from subtle LAD occlusion
WARNING: the formula is not perfect. Beware of using it to reverse your prior opinion that the ECG represents LAD occlusion. I recommend using it when you are worried that an ECG with apparent normal ST Elevation might be LAD occlusion. Sensitivity is not perfect.
Using these values, he calculated the formula using these 4 variables: QTc-Bazett = 418, QRSV2 = 33, R-wave V4 = 12.5, STE (60 ms after J point) = 4. Value = 17.65. 18.2 is the most accurate cutpoint.
In this external validation, “the published cut-point of 18.2 had a sensitivity, specificity, and diagnostic accuracy of 83.3%, 87.7%, and 85.9%, respectively.” A tale of two formulas: differentiation of subtle anterior MI from benign ST segment elevation.
Remember that it was only subtle LAD occlusion that was studied, so the sensitivity for all LAD occlusion is substantially higher.
In our Hennepin data, the sensitivity at a cutpoint of 17.0 was 97% (only 3% of LAD occlusions had a value less than 17.0).
Clinical Course
Deep realized that this was a false negative formula value, and he activated the cath lab. A 100% LAD occlusion was found and opened and stented.
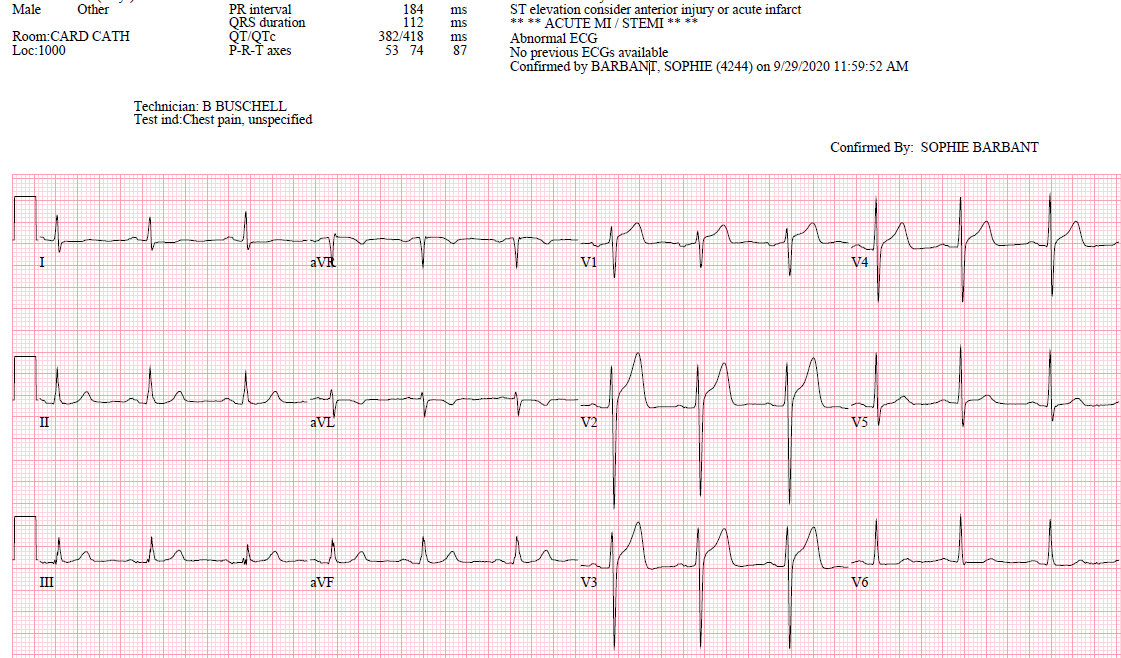
Here is the post PCI ECG:

Classic Wellens’ Pattern A T-waves diagnostic of reperfusion.
Notably, there is not much R-wave amplitude, suggesting that there was substantial myocardial loss.
(Wellens’ pattern A T-waves biphasic, with terminal T-wave inversion — up-down).
These will always evolve into Wellens’ Pattern B over hours to day.
Classic Evolution of Wellens’ T-waves over 26 hours
Peak troponin was 19.9 ng/mL, which is typical of STEMI, but is at the low end of peak troponins in anterior STEMI.

===================================
MY Comment by KEN GRAUER, MD (10/24/2020):
===================================
TOUGH case today! — and one that I fully acknowledge that I was not at all certain about my answer after seeing the initial ECG. Reasons this case is so challenging include:
- Reason #1: The initial ECG looks a lot like a repolarization variant (because of the 5 findings noted above by Dr. Smith).
- Reason #2: There is at-the-least voltage for LVH (by Peguero Criteria) — and given how markedly increased this patient’s BP was in triage (ie, 213/128 mm Hg!) — there is most likely true chamber enlargement.
==========================
NOTE: Among the criteria for ECG diagnosis of LVH that I favor — are Peguero Criteria, which state: LVH is present IF sum of deepest S in any chest lead + S in V4 ≥23 mm (female) or ≥28 mm (male). If the deepest S wave is in lead V4 — then double this value.
- Applying Peguero Criteria to ECG #1 in today’s case (Figure-1 below) — the deepest S wave is ~21 mm in lead V2 + an S wave ~ 11 mm in lead V4 = 32 mm, which satisfies voltage criteria for LVH.
- For those wanting review of “My Take” on a user-friendly approach to the ECG diagnosis of LVH — Please SEE My Comment at the bottom of the page in the June 20, 2020 post of Dr. Smith’s ECG Blog.
==========================
PEARL #1: Although the ED physician in this case knew to immediately activate the cath lab — You do not have to definitively decide on whether or not there is acute OMI on the basis of this single ECG!
- We have shown numerous cases on Dr. Smith’s ECG Blog of acutely evolving OMIs in which a 2nd ECG done no more than a few minutes later showed obvious hyperacute changes or frank ST elevation. Therefore — Repeat the ECG ~5-15 minutes later (and if needed, frequently thereafter) — and, the chances are good that “the Answer” will soon become apparent.
- Other modalities (ie, high-sensitivity troponin, stat Echo during chest pain, finding a prior ECG for comparison) may all help clarify if ongoing OMI is in progress.
- That said, even without a definitive ECG diagnosis of OMI — persistence of chest pain + the ECG findings that we do see in ECG #1 are enough to justify prompt cath.
TAKE another LOOK at the initial ECG in today’s case (Figure-1).
- HOW MANY LEADS show suspicious ECG findings? WHAT are the abnormalities?
- HINT: Look at the leads in which there are horizontal RED or PINK dotted lines.
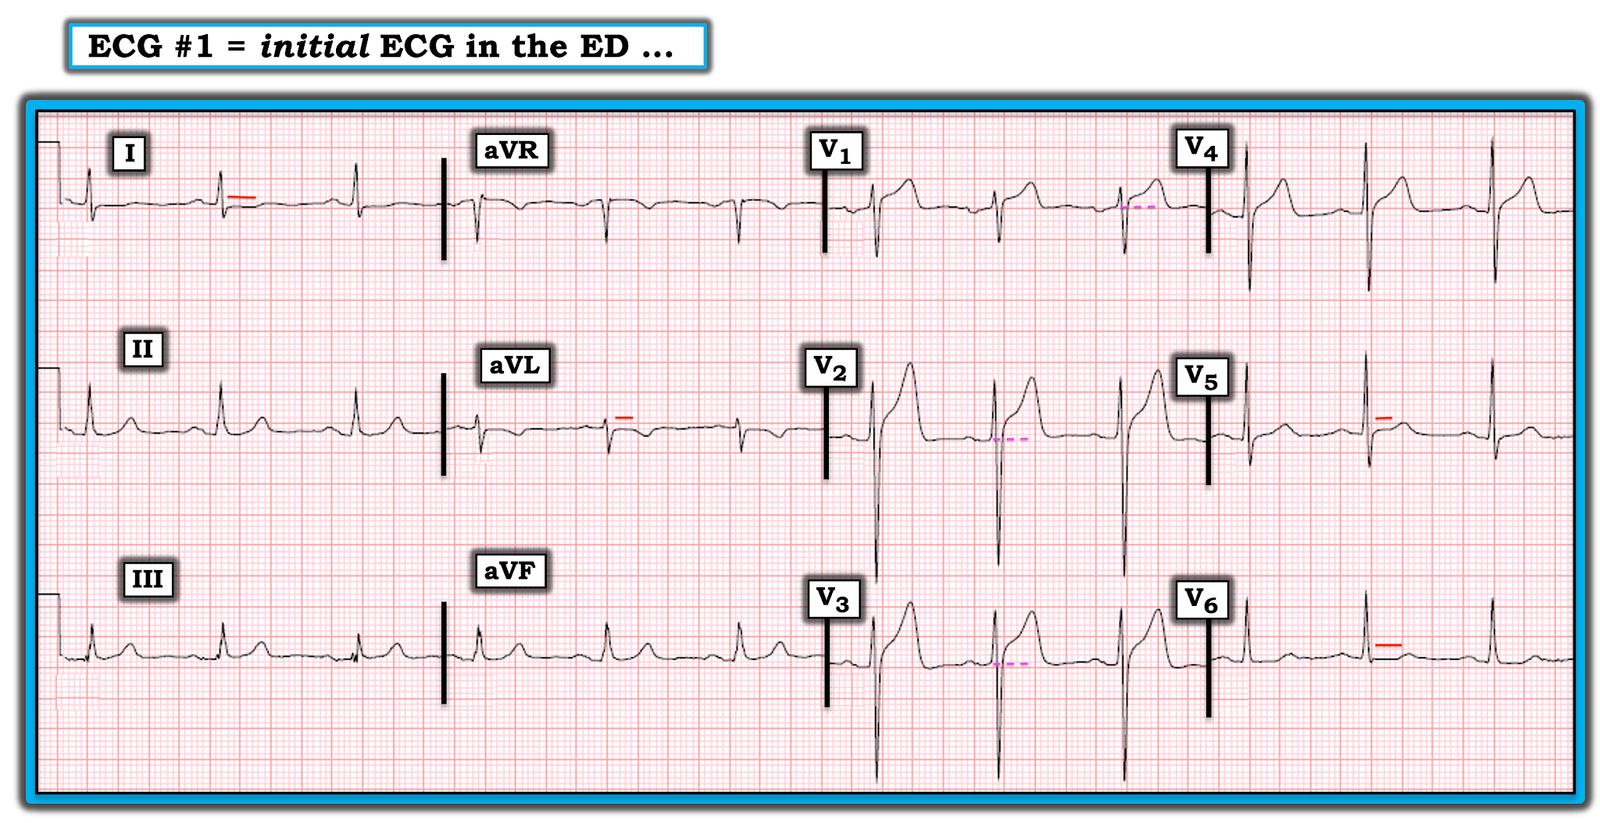
Figure-1: The initial ECG in this case (See text).
MY Thoughts on ECG #1:
When I first saw this case (before I read what happened) — I was aware of 3 types of “input” information that went into my decision-making process:
- Input Type #1: Consideration of the History = which is of a 40-something man who presented to the ED with new-onset chest pain that began just 2 hours earlier. Chest pain was pressure-like and constant, with a 10/10 severity rating. Clearly, this presentation places this patient in a high-prevalence likelihood for OMI even before you look at his ECG!
- Input Type #2: Consideration of objective ECG findings in the initial tracing that further increase concern. These include: i) ST elevation in lead V1 that looks disproportionate given modest depth of the S wave in this lead; ii) Somewhat more-than-expected ST elevation in the next 2 anterior leads (leads V2 and V3); iii)Unexpected ST flattening in leads I, V5 and V6 (short RED horizontal lines in these leads); iv) flattening of the ST segment before the inverted T wave in lead aVL (ie, Although the T wave in aVL may normally be inverted when the QRS complex in this lead is predominantly negative — the preceding ST segment in lead aVL is usually not as flat as seen here) — and, v) The upright T wave in lead V1 is larger than the T wave in lead V6.
- Input Type #3: Consideration of “stuff-that-I-feel” but am not able to put into objective terms. In view of the fact that this patient presented with new-onset worrisome chest pain + an initial ECG showing more-than-expected ST elevation in anterior lead V1 — if anything, it looked to me as if despite less deep S waves, the relative amount of J-point ST elevation in lead V3 is more than what is seen in lead V2. My “intuitive” sense of concern was heightened by this suspicion of abnormal anterior ST elevation (in leads V1, V2 and V3) — in the context of unusual and abnormal ST segment flattening in the 4 lateral leads (leads I, aVL; V5 and V6).
PEARL #2: An under-appreciated important clue to potential acute changes is the above noted finding of a new upright T wave in lead V1 that is taller than the T wave in lead V6. When found in a patient with new chest pain who does not have LBBB (that normally produces tall, upright anterior T waves) — one should be suspicious of acute ischemia, if not impending OMI.
- NOTE: This Pearl #2 is not to say that tall, upright T waves in lead V1 might not sometimes be the result of a repolarization variant or a mirror-image reflection of LV “strain”. Instead, it is simply to say that on occasion — I have found recognition of a tall, upright T wave in lead V1 that is clearly much taller than the T wave in lead V6 to be an insightful clue (as it was for me in today’s case) of impending acute anterior OMI.
BOTTOM Line: It’s not common that anterior OMI is seen on an ECG that satisfies criteria for LVH. Today’s case provides one such example.
- ECG findings suggesting OMI on the initial ECG are extremely subtle. Nevertheless — suspicious ECG findings are seen in 7/12 leads. I’d bet that a repeat ECG done no more than a short while later would have been more definitive.