Written by Robert Herman, MD, PhD with Edits by Stephen W Smith (with adaptation by Ken Grauer from the original publication in ECG Insights).
It’s 4 AM. A man in his 60s presents to a community hospital — no cath lab on site — with a history that should make any clinician sit up straight.
- For the past two days: oppressive chest pain radiating to the throat, lasting under 10 minutes and then spontaneously resolving. The next day, symptom-free.
- Then, toward evening of Day #2: the same pressure, same radiation, now coming in waves and not improving. Not provoked, not respiratory, not consistently positional — though seemingly better sitting, worse lying down.
- No recent illness. No cardiac history documented.
The patient arrives in the ED. He looks okay. Alert, not clammy, well-perfused, sats 100%, no lung findings, muffled heart sounds but no heart murmur.
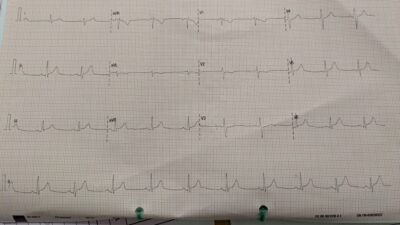
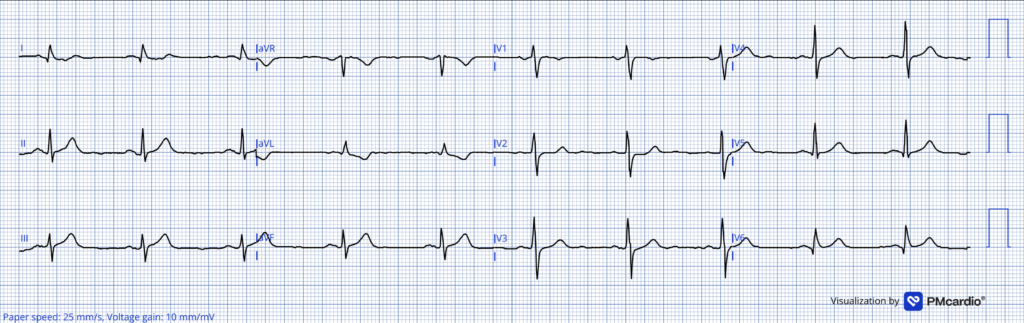
Here is the initial ECG recorded in the emergency department.
— What do you think? —
= = =
The ED physicians at the non-PCI center over-read the ECG as “no obvious repolarization abnormality.” If you are only looking for tombstone ST elevation, this interpretation is understandable…
However, those T-waves in the inferior leads are enormous, almost the same size relative to the QRS complex. Broad, bulky, symmetric — what we would call hyperacute T-waves. There is almost no ST-elevation. Yet there is clear reciprocal STD in leads I and aVL, along with an inverted T-wave in aVL and also ST depression maximal in V2–V3, where slight ST elevation would normally be expected and thus there is probably > 1 mm of relative ST depression (relative to the normal position of ST Elevation).
Thus, there is also posterior OMI.
Smith: There is also a reciprocally inverted hyperacute T-wave in aVL. What is a reciprocally inverted hyperacute T wave? Sometimes the most obvious hyperacute T-wave is reciprocal to the ACTUAL hyperacute T-waves. Lead aVL has a VERY large, bulky, inflated inverted T-wave in proportion to the R-wave.
Here I have inverted the image of aVL to show this phenomenon:
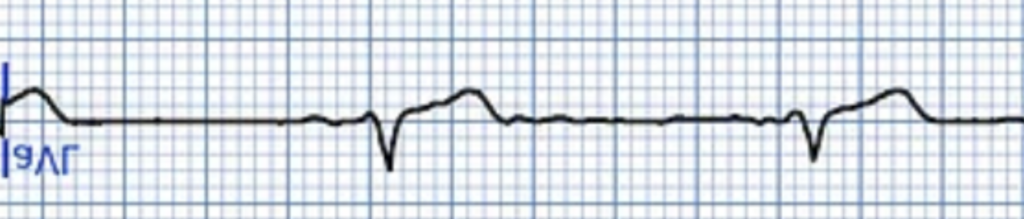
Smith: That looks like a VERY hyperacute T-wave, even more than the inferior upright ones.
Unfortunately, the ED physicians at the non-PCI center did not yet have access to the Queen of Hearts AI ECG Model (this case ultimately played a key role in convincing them to get it! ). The initial high-sensitivity troponin-I came back at 120 ng/L (URL = 53 ng/L). Repeat at 108 ng/L.
- Smith: Do not be reassured by this. A flat or slightly falling troponin does not exclude acute coronary occlusion, especially in the setting of resolving or intermittent chest pain. This pattern is well described — and frequently misinterpreted. One should never base emergency intervention on rising or falling troponins; troponin is a rear view mirror of what was happening. There are 2 datapoints that tell you what is happening right now: 1) the ECG (active ischemia or not), and 2) the presence of active symptoms.
- Non-OMI often has rising troponins due to ischemia that occurred a few hours ago. Conversely, occlusion can happen right this second while troponins are falling from from brief absence of ischemia a couple hours ago.
The team interpreted these Troponin levels as “not significantly rising”, and did not activate the STEMI pathway. Instead, they administered pantoprazole 80 mg IV + aspirin 1 g IV — and opted for observation.
= = =
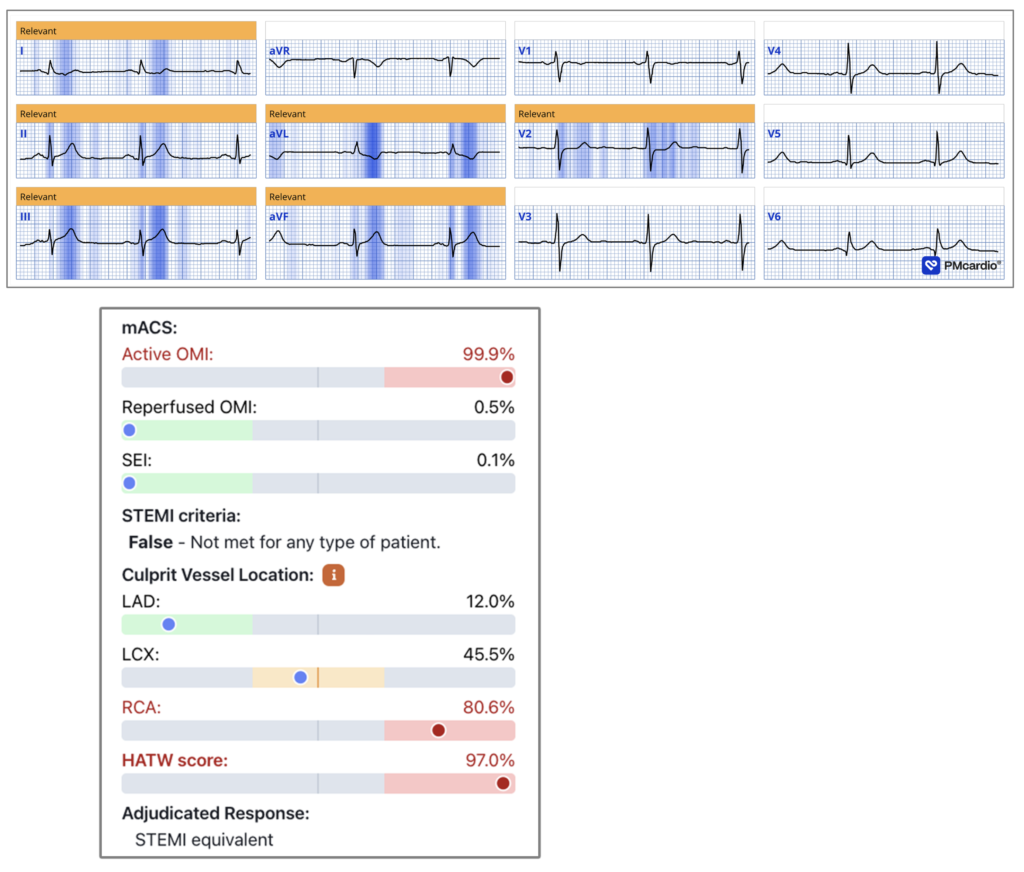
Hours later, the on-call cardiologist at the primary PCI center was contacted for an emergent NSTEMI consult. They had prospective access to QOH (Queen-Of-Hearts) — and here is the AI ECG interpretation (you can see that the Queen has MOST densely highlighted the reciprocally inverted hyperacute T-wave in aVL):
= = =
NOTE: This QOH interpretation includes a new experimental feature we are working on — and shows a 99.9% probability of active OMI. It also reports a HATW score of 97% and an 80.6% probability that the culprit lesion is in the RCA. (SEI in this figure stands for “subendocardial ischemia” — which the model also assesses — Here she sees none).
- The AI model outputs values ranging from 0 to 1, with 0.5 as the threshold for positivity. Values close to 1 can be interpreted as confidently positive. A value of 99.9% represents the highest possible output, corresponding to an extremely low likelihood of false positives. In all-comer ED cohorts, false positives at this level are rare, approximately 1 in 100,000.
- About the HATW score: In this is paper that we published in summer 2025, we derive and validate the first quantitative definition of HATW: Hyperacute T Waves Are Specific for Occlusion Myocardial Infarction, Even Without Diagnostic ST-Segment Elevation
= = =
On the Cath Lab Table:
- Revascularization Time = 10 AM ( = 5 hours later! ).
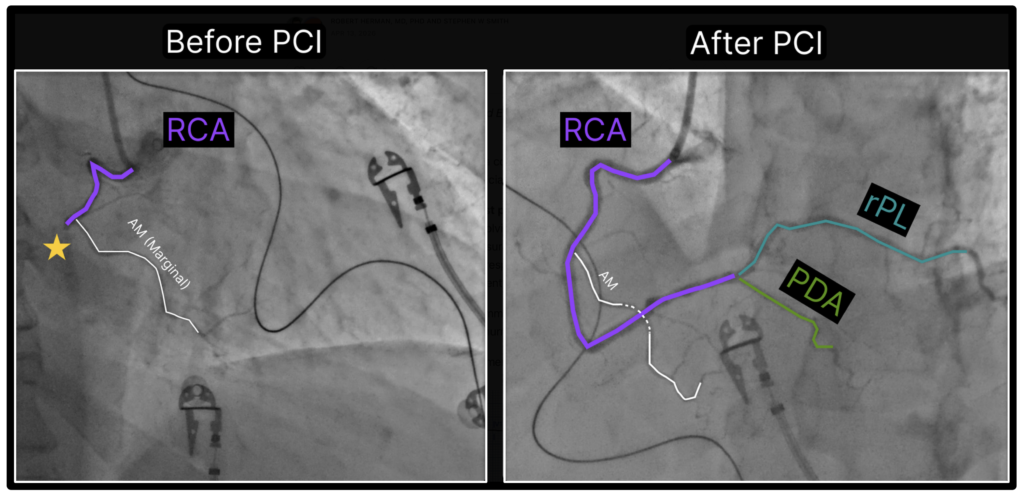
- Coronary angiography: Right-dominant system. Mid-RCA: 100% occlusion (SYNTAX segment 2).
= = =
This was an acute infero-posterior wall myocardial infarction from total occlusion of the mid-right coronary artery.
The patient went into ventricular fibrillation on the cath lab table. Successful cardioversion. Hemodynamic stability restored.
- Angiographic post-PCI result: Excellent!
See below the annotated coronary angiogram before and after PCI, using the color scheme defined by (sadly now EP fellow) Dr. Willy Frick. If you are new to coronary angiography, I strongly recommend his introductory guide. (This EASY LINK shows you how to find the LINK to Dr. Frick’s wonderful Cath Guide at the Top of every page in Dr. Smith’s Blog!).
The third troponin (now measured as hs-cTnT with an upper reference limit of 14 ng/L) — exceeded 1,800 ng/L. Unfortunately, serial measurements were not continued to peak, so the full extent of myocardial injury remains unknown.
= = =
Reperfusion T-wave Inversion: Not Just an Anterior Phenomenon
Most clinicians learn about “Wellens syndrome” as deep, symmetric T-wave inversions in V2–V4 after chest pain — a pattern classically linked to the LAD and anterior territory, signaling a critical proximal lesion.
I have two problems with this framing. First, clinicians mainly associate it with the LAD — yet the same physiology operates in every territory (as you’ll see below). Second, “Wellens Type A” and “Wellens Type B” are not two distinct entities, but 2 stages of the same pathophysiological process: the biphasic T-wave is earlier; the deep symmetric inversion is later. Calling them separate syndromes obscures what is actually happening.
Smith: The fact that “Wellens” represents coronary artery reperfusion (or spontaneous recanalization) on the ECG is apparent only to regular followers of my blog. It has never been formally described as such in the literature.
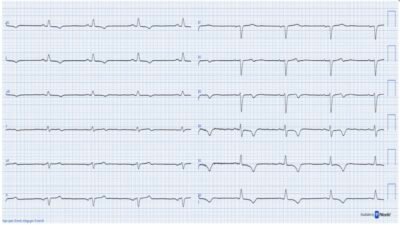
What is actually happening: after reperfusion of the culprit artery — whether LAD, RCA, or LCx — the T-waves in the corresponding distribution flatten and then invert as stunned myocardium recovers. This is a dynamic, time-dependent process. The correct name for it is simply reperfusion T-wave inversion, localized to the territory of the reopened artery.
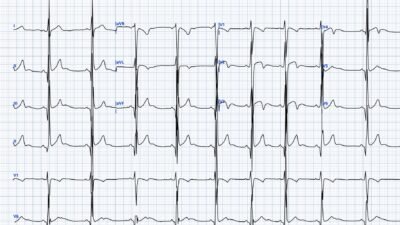
In today’s case, focus on the inferior leads in the tracings below. The previously hyperacute, broad T-waves in leads II, III, and aVF — the signature of the occluded RCA — progressively flatten and then invert after successful PCI, AND the previously inverted hyperacute T-wave in aVL becomes upright. This is the same pattern you would expect in leads V2–V4 after LAD reperfusion (Wellens). Different territory, identical physiology.
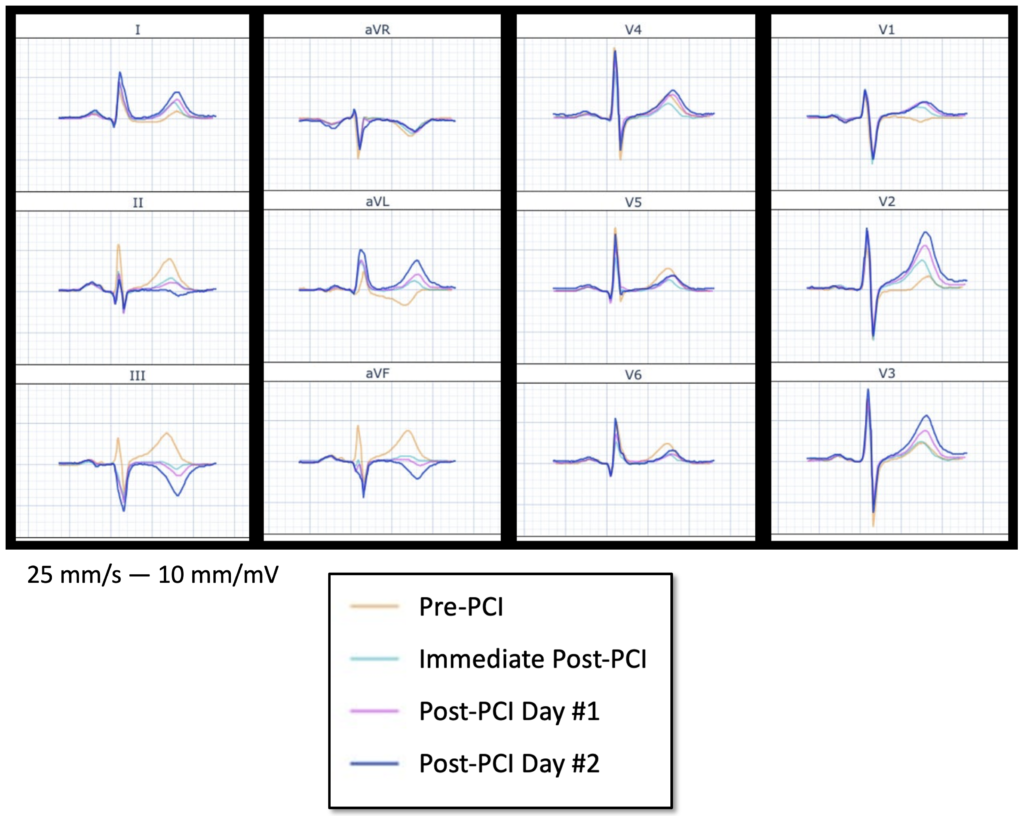
The above Figure shows the median beat of the pre-PCI (yellow) — immediately post-PCI (cyan) — post-PCI Day #1 (pink) — and post-PCI Day #2 (blue) ECGs, which are all overlaid on top of each other.
= = =
Why does recognizing this pattern matter? While T-wave inversion after PCI is an expected finding, the same pattern appears when patients present to the ED with an ECG that already shows reperfusion — meaning the artery opened spontaneously before arrival. The Queen of Hearts currently classifies these as “high-risk NSTEMI,” recognizing that the culprit artery is open at the time of the tracing but that the underlying lesion remains unstable and dangerous (and could re-occlude at any moment, since there was no mechanical intervention yet).
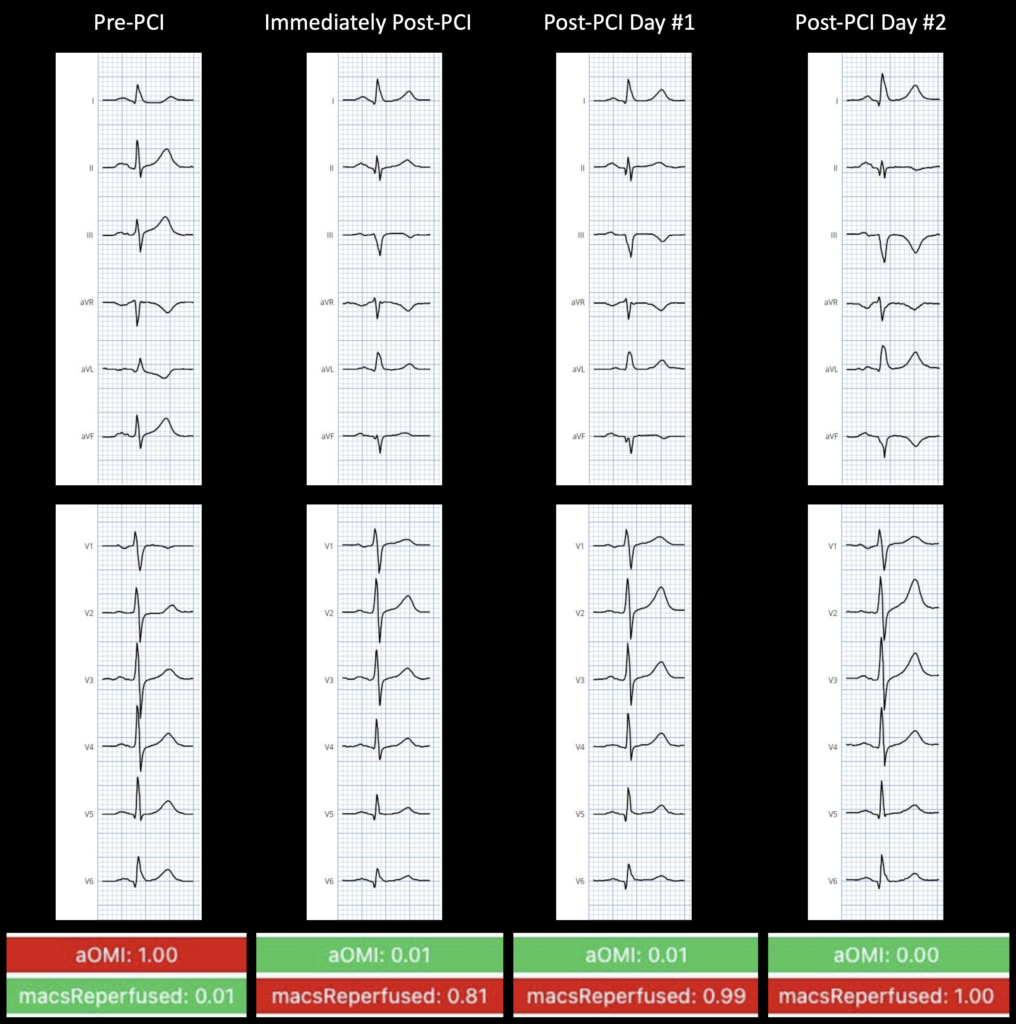
The above Figure shows scoring for aOMI ( = Active OMI) — and for mACS Reperfused (= Reperfused OMI). Note: Spontaneous vs mechanical Reperfusion cannot be differentiated using the ECG.
= = =
KEY Point: One critical distinction worth dwelling on — and one I hear get collapsed too often, even among clinicians who have embraced the OMI paradigm: the binary framing of “occluded vs non-occluded” misses a third state that changes management entirely. There are actually 3 clinically distinct scenarios:
- Active OMI: The artery is occluded right now. The ECG shows ST-elevation or in 50% of cases, STEMI equivalents (such as hyperacute T-waves, minimal ST-elevation, or other active ischemic changes). This patient needs the cath lab immediately.
- Reperfused OMI: The artery was occluded but has spontaneously recanalized before the ECG was recorded. The ECG now shows the reperfusion pattern: T-wave inversions in the culprit territory, often with a history of chest pain that has partially or fully resolved. Note: spontaneous recanalization (if the artery opens up on its own) —cannot be differentiated from mechanical reperfusion (if the artery is opened up via PCI in the cath lab).
- No OMI (includes NOMI and no MI): The artery was never occluded, or no myocardial infarction occurred. This category includes Type 2 MI (such as demand ischemia from another cause) — as well as Type 1 MI due to non-occlusive plaque rupture (the “lucky” patients who never fully occlude). It also encompasses, by far, the largest group of chest pain patients, those without any myocardial infarction or troponin elevation.
= = =
Key Learning Points:
- Hyperacute T-waves are the earliest — and most commonly missed — sign of OMI. Very high specificity. No ST-elevation required. Look at the T/QRS ratio, the breadth, and the symmetry. Reciprocal changes seal the diagnosis. Read more about our HATW formula paper in JACC: Advances.
- Two troponins that are “flat but elevated” do not exclude active occlusion.Waning chest pain with a plateau troponin is classic for stuttering OMI or spontaneous reperfusion — not reassurance.
- Reperfusion T-wave inversions occur in every territory, not just anterior.
- Prolonged ischemic time kills myocardium and creates procedural risk. This patient arrested on the table. Every hour of delay is both muscle lost and arrhythmia risk gained.
- AI interpretation at the point of first contact can change outcomes. The Queen of Hearts read this ECG as 99.9% Active OMI. That information was not available at the referring site when it mattered most.
= = =
======================================
MY Comment, by KEN GRAUER, MD (4/15/2026):
Today’s case by Drs. Herman and Smith highlights a series of essential points regarding assessment and recognition of the sequential stages of an acute OMI in a patient who unfortunately did not receive timely intervention.
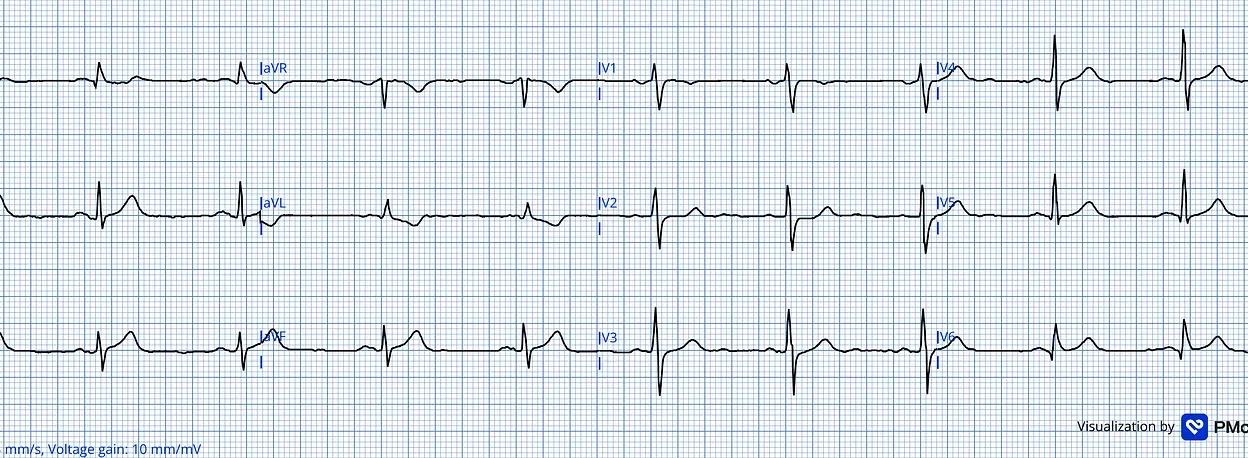
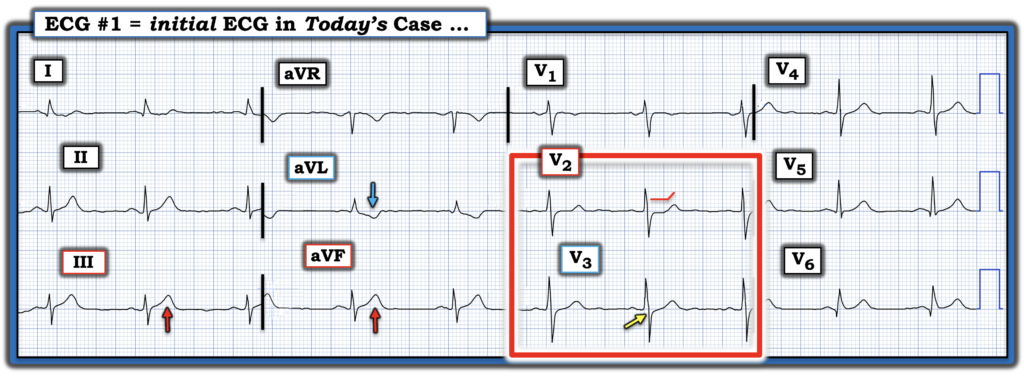
- I focus My Comment on some additional thoughts regarding the initial ECG — that I’ve reproduced and labeled in Figure-1.
= = =
What Caught my “Eye” …
On learning that today’s patient presented with a history of worrisome CP (Chest Pain) — it took me less than 5 seconds to appreciate the need for prompt cath!
- My “eye” was immediately captured by the ST-T wave in lead V2 (within the RED rectangle). In this tracing with sinus rhythm, normal intervals (PR,QRS,QTc) and no chamber enlargement — the lead V2 finding of “shelf-like” ST segment flattening with slight ST depression in a patient with worrisome CP is diagnostic of acute posterior OMI until proven otherwise!
- As we so often emphasize in Dr. Smith’s ECG Blog — leads V1,V2 should normally manifest a slight amount of gently upsloping ST elevation. As a result — even the very slight amount of ST depression that we see in Figure-1 is significant!
- Making this finding in lead V2 even more certain — is loss of the normal amount of slight upsloping ST elevation in neighboring lead V3 (YELLOW arrow in this lead).
= = =
The Limb Lead Findings …
As highlighted by Drs. Herman and Smith — the limb lead findings are equally diagnostic.
- The ST-T waves in leads III and aVF are clearly disproportionate in size compared to modest amplitude of the QRS in these leads — which in a patient with new CP, suggests hyperacuity (ie, These inferior lead ST-T waves being “fatter”-at-their-peak and wider-at-their-base than they should be given relatively small size of the QRS). By association — the 3rd inferior lead (= lead II ) is almost certain to also be hyperacute.
- Dr. Smith’s PEARL: Any uncertainty that I might have had about inferior lead hyperacuity in Figure-1 — was instantly resolved the moment I saw the reciprocal hyperacute ST-T wave in lead aVL! (BLUE arrow in this lead).
= = =
BOTTOM Line: In this patient with worrisome CP — today’s initial ECG is diagnostic of acute infero-postero-lateral OMI (As a “P.S.” — the larger-than-it-should-be Q wave and associated ST elevation that we see in lead V6 — suggests lateral involvement).
- As a result — the need for cardiac cath could have been established long before the 5 hours that it took.
- The fact that the initial Troponin was elevated further confirmed the need for prompt cath — BUT — cardiac Troponin results were not needed as part of the decision-making process.
= = =
Figure-1: I’ve labeled the initial ECG in today’s case.
= = =
= = =
= =
= = =